| Param | Original file | Final file |
|---|---|---|
| Filename | modeM0/AS1A10_094T24_9000005374_38334cztM0_level2.fits | modeM0/AS1A10_094T24_9000005374_38334cztM0_level2_quad_clean.evt |
| Size (bytes) | 443,589,120 | 84,568,320 |
| Size | 423.0 MB | 80.7 MB |
| Events in quadrant A | 2,719,510 | 589,822 |
| Events in quadrant B | 2,654,616 | 605,984 |
| Events in quadrant C | 2,395,129 | 576,673 |
| Events in quadrant D | 8,256,382 | 431,989 |
| Mode SS | |||
|---|---|---|---|
| Quadrant | BADHDUFLAG | Total packets | Discarded packets |
| A | 0 | 104 | 0 |
| B | 0 | 104 | 0 |
| C | 0 | 104 | 0 |
| D | 0 | 104 | 0 |
| Mode M0 | |||
|---|---|---|---|
| Quadrant | BADHDUFLAG | Total packets | Discarded packets |
| A | 0 | 11257 | 3 |
| B | 0 | 11255 | 2 |
| C | 0 | 10305 | 2 |
| D | 0 | 28143 | 2 |
| Mode M9 | |||
|---|---|---|---|
| Quadrant | BADHDUFLAG | Total packets | Discarded packets |
| A | 0 | 34 | 0 |
| B | 0 | 34 | 0 |
| C | 0 | 34 | 0 |
| D | 0 | 35 | 0 |
| Quadrant | Total seconds | Saturated seconds | Saturation percentage |
|---|---|---|---|
| A | 5081 | 36 | 0.708522% |
| B | 5081 | 66 | 1.298957% |
| C | 5081 | 7 | 0.137768% |
| D | 5081 | 1138 | 22.397166% |
Noise dominated data is calculated using 1-second bins in cleaned event files. If a bin has >2000 counts, and if more than 50% of those come from <1% of pixels, then it is considered to be noise-dominated and hence unusable.
| Quadrant | # 1 sec bins | Bins with >0 counts | Bins with >2000 counts | High rate bins dominated by noise | Noise dominated (total time) | Noise dominated (detector-on time) | Marked lightcurve |
|---|---|---|---|---|---|---|---|
| A | 7054 | 5082 | 28 | 28 | 0.40% | 0.55% | 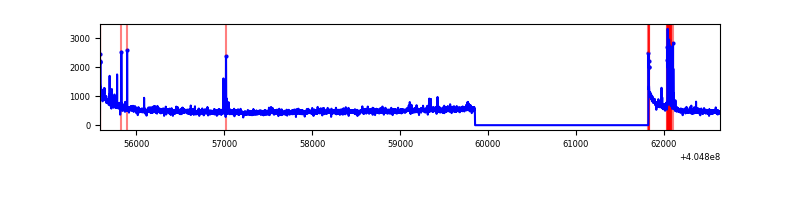 |
| B | 7054 | 5082 | 21 | 21 | 0.30% | 0.41% | 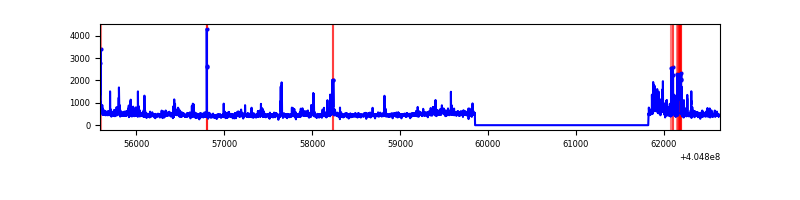 |
| C | 7054 | 5082 | 4 | 4 | 0.06% | 0.08% | 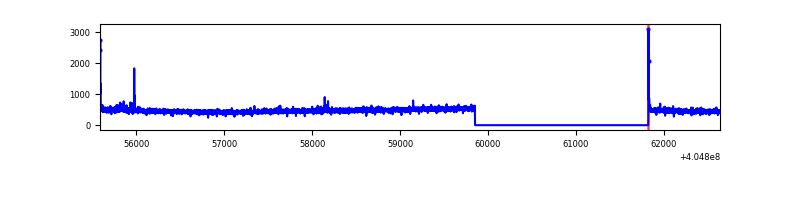 |
| D | 7054 | 5082 | 1156 | 1156 | 16.39% | 22.75% | 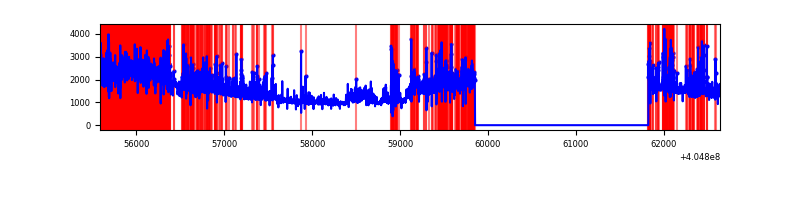 |
Top three noisy pixels from each quadrant. If the there are fewer than three noisy pixels in the level2.evt file, extra rows are filled as -1
| Pixel properties | Quadrant properties | ||||||
|---|---|---|---|---|---|---|---|
| Quadrant | DetID | PixID | Counts | Sigma | Mean | Median | Sigma |
| A | 10 | 83 | 383806 | 3412.57 | 554 | 543 | 112.3 |
| A | 13 | 248 | 92933 | 822.64 | 554 | 543 | 112.3 |
| A | 12 | 189 | 68342 | 603.68 | 554 | 543 | 112.3 |
| B | 0 | 183 | 267614 | 2516.69 | 558 | 543 | 106.1 |
| B | 0 | 229 | 98056 | 918.89 | 558 | 543 | 106.1 |
| B | 10 | 245 | 24603 | 226.72 | 558 | 543 | 106.1 |
| C | 15 | 214 | 215427 | 1698.9 | 546 | 549 | 126.5 |
| C | 0 | 10 | 19768 | 151.95 | 546 | 549 | 126.5 |
| C | 1 | 23 | 8434 | 62.34 | 546 | 549 | 126.5 |
| D | 10 | 203 | 4642855 | 37152.26 | 507 | 493 | 125.0 |
| D | 2 | 16 | 532708 | 4259.25 | 507 | 493 | 125.0 |
| D | 2 | 250 | 358031 | 2861.33 | 507 | 493 | 125.0 |
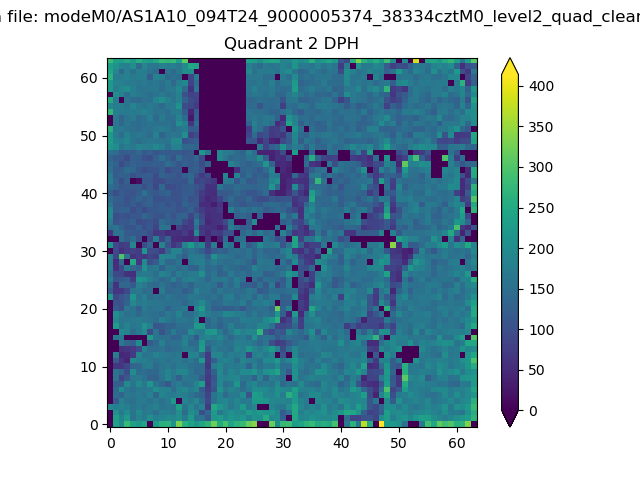
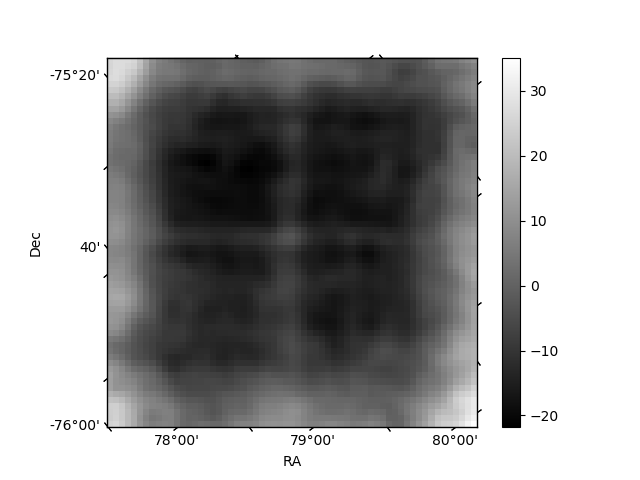
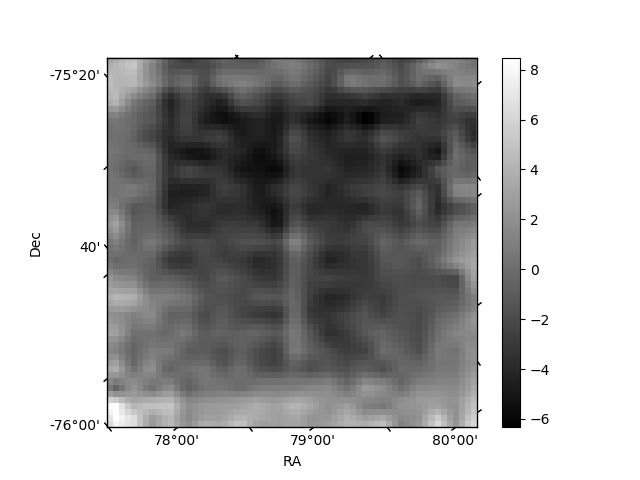
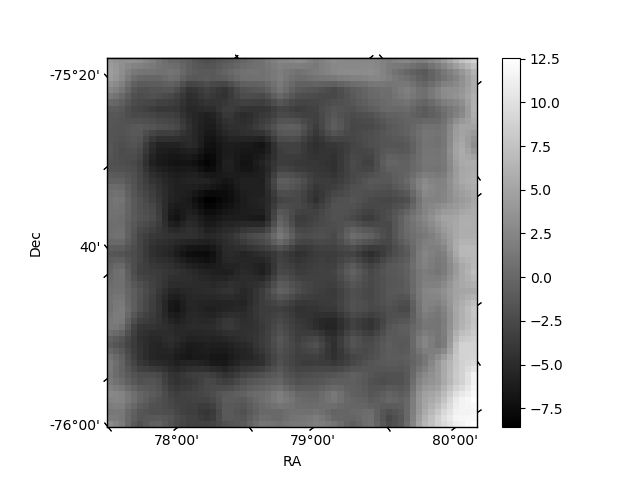
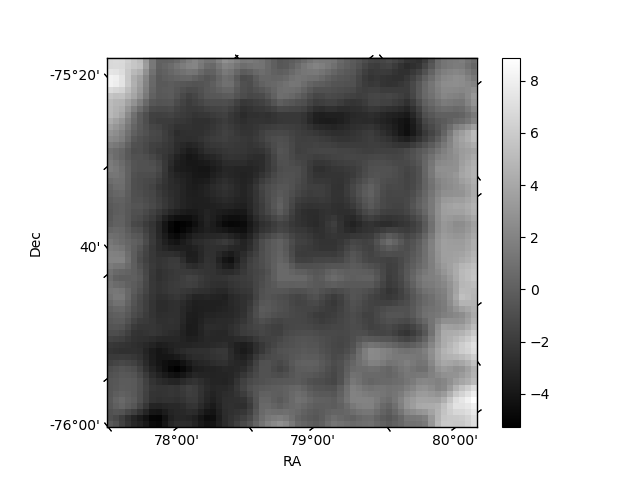
Histogram calculated using DETX and DETY for each event in the final _common_clean file
| Quadrant A | 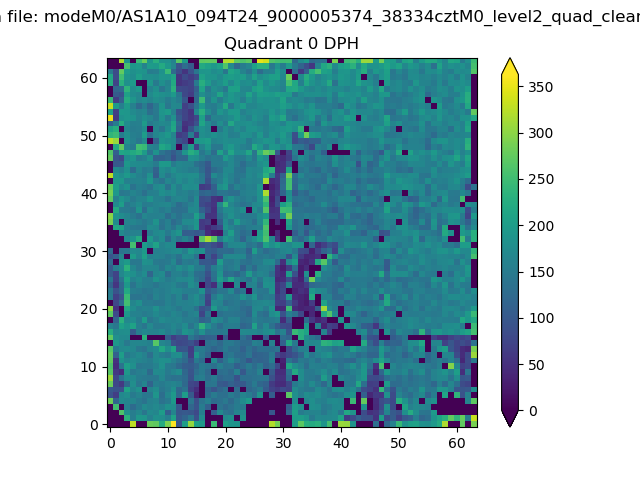 |
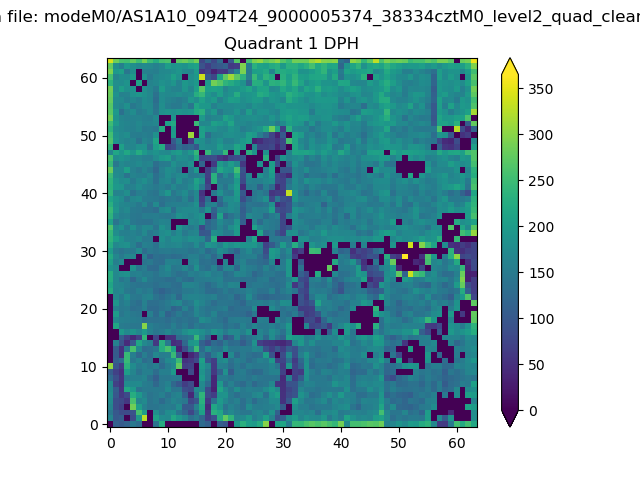 |
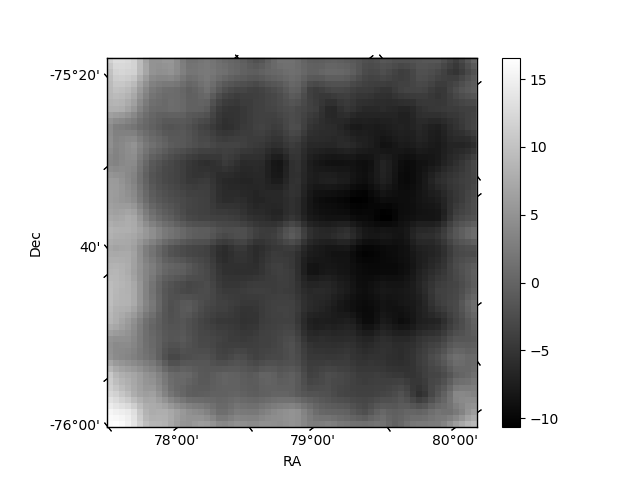
Quadrant B |
|---|---|---|---|
| Quadrant D | 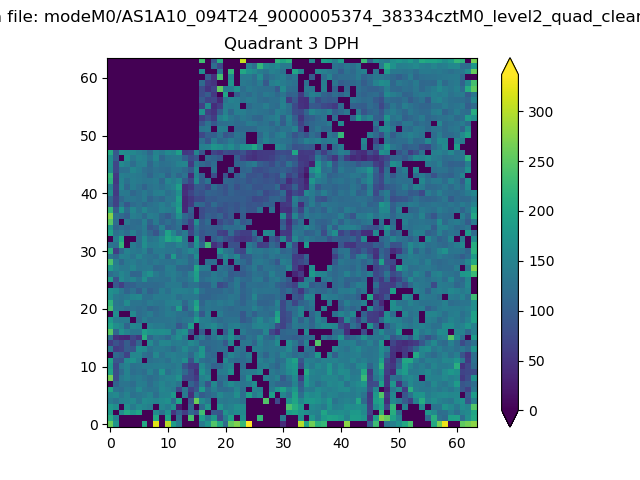 |
 |
Quadrant C |
| Plot type | Count rate plots | Images |
|---|---|---|
| Comparison with Poisson distribution Blue bars denote a histogram of data divided into 1 sec bins. Red curve is a Poisson curve with rate = median count rate of data. |
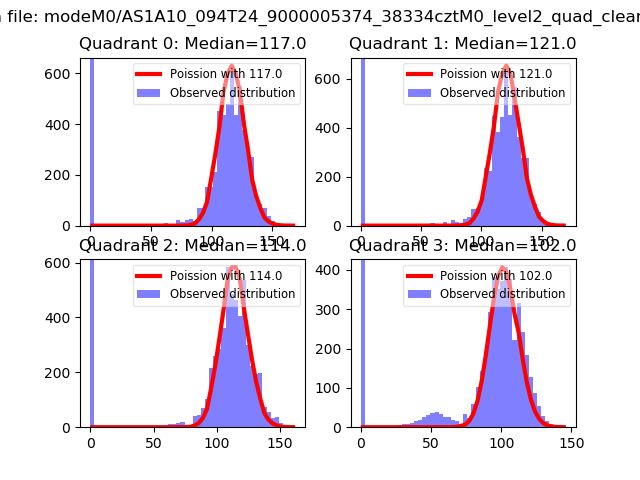 |
 |
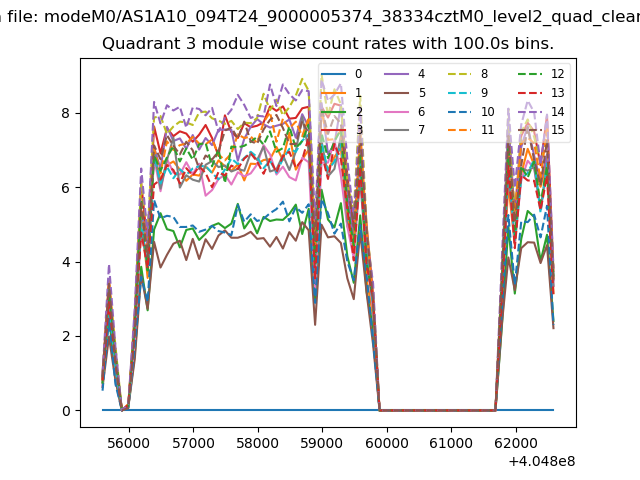
| Quadrant-wise count rates Data is divided into 100 sec bins |
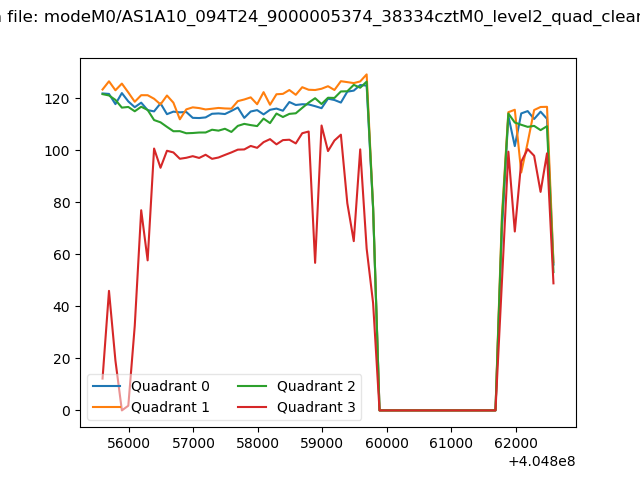 |
|
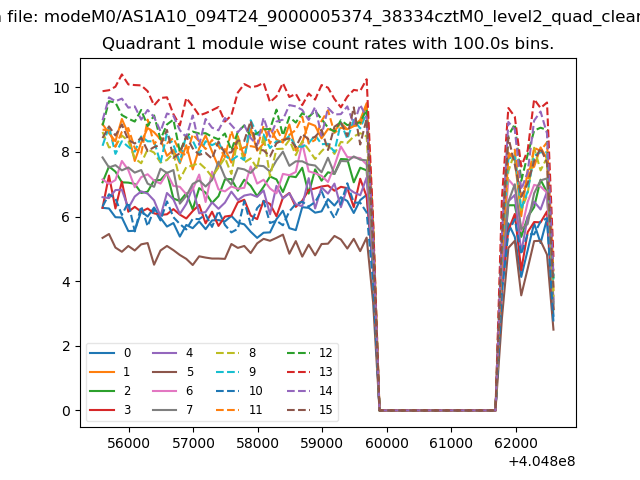
| Module-wise count rates for Quadrant A Data is divided into 100 sec bins |
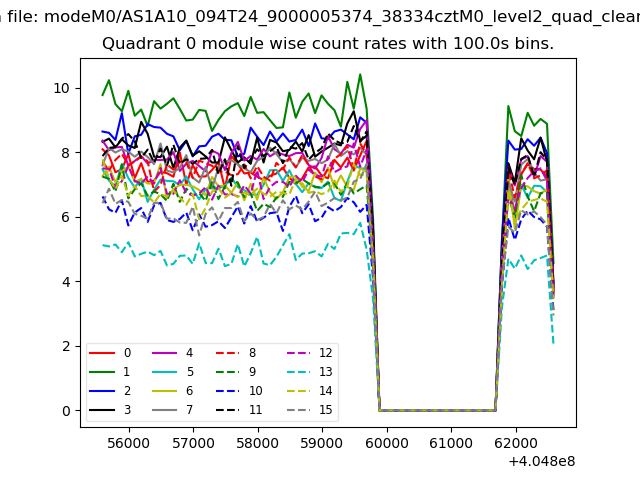 |
 |
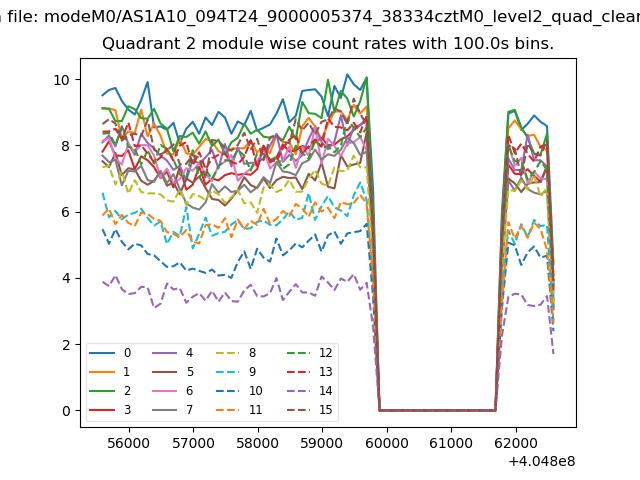
| Module-wise count rates for Quadrant B Data is divided into 100 sec bins |
 |
 |
| Module-wise count rates for Quadrant C Data is divided into 100 sec bins |
 |
 |
| Module-wise count rates for Quadrant D Data is divided into 100 sec bins |
 |
 |
| Parameter | Plot |
|---|---|
| CZT HV Monitor | 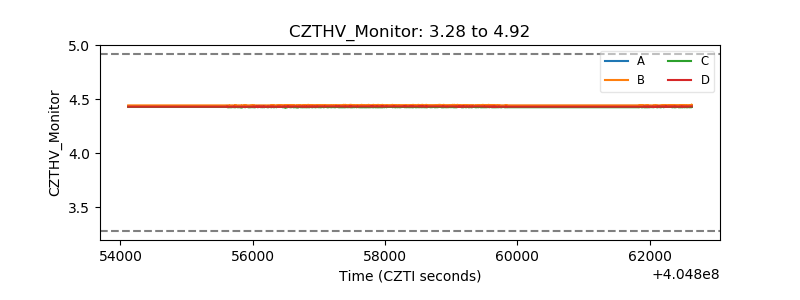 |
| D_VDD | 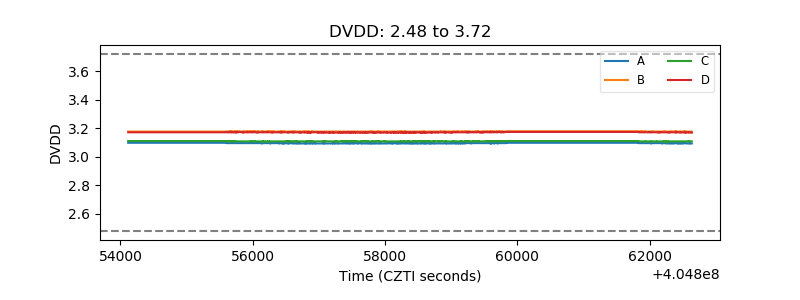 |
| Temperature 1 | 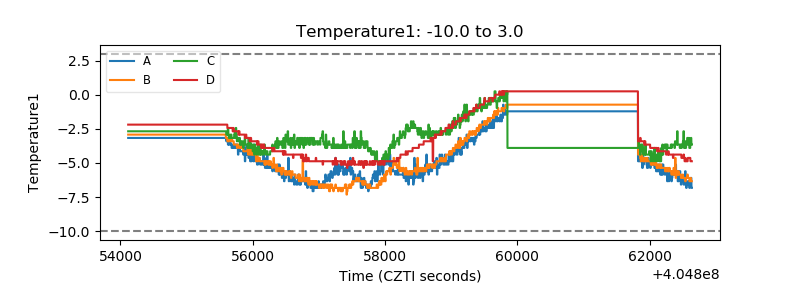 |
| Veto HV Monitor | 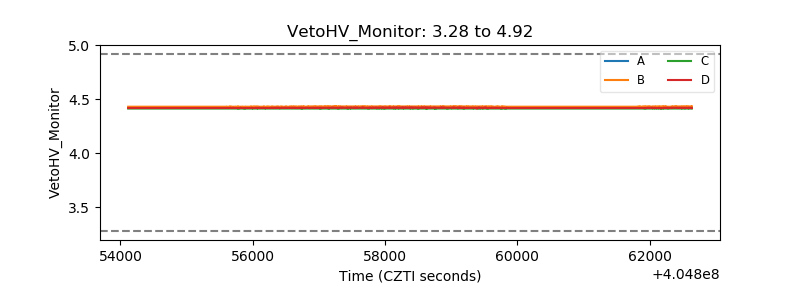 |
| Veto LLD | 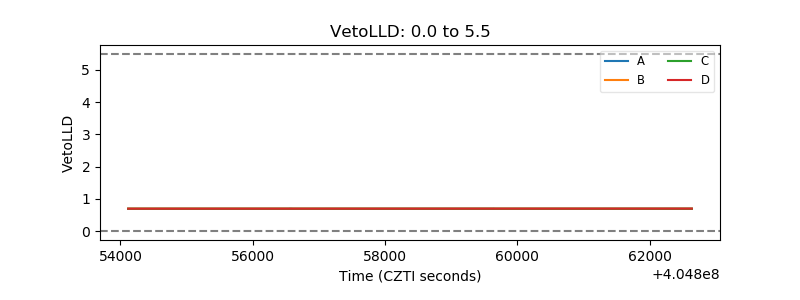 |
| Alpha Counter | 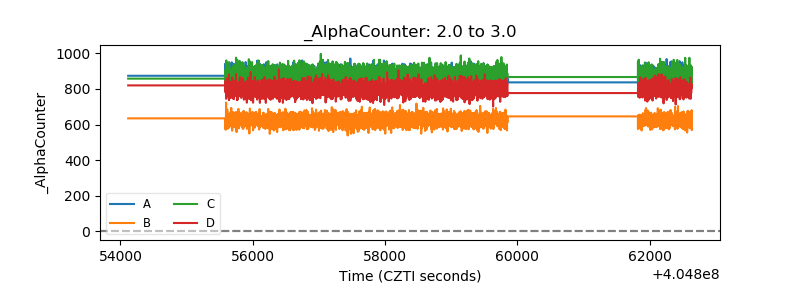 |
| _CPM_Rate | 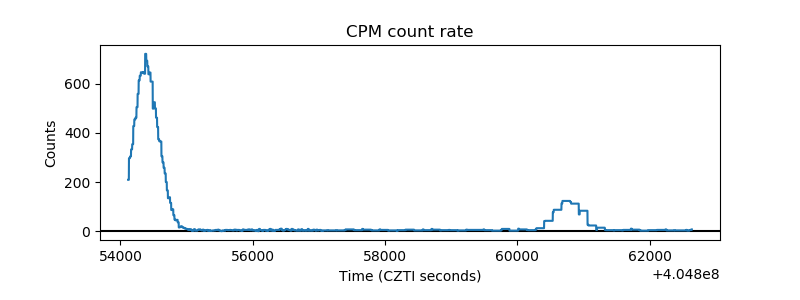 |
| CZT Counter | 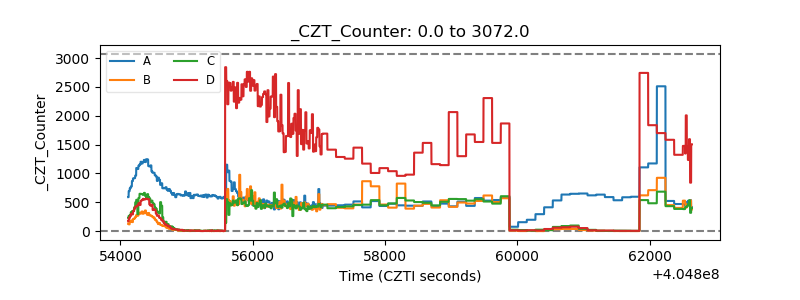 |
| +2.5 Volts monitor | 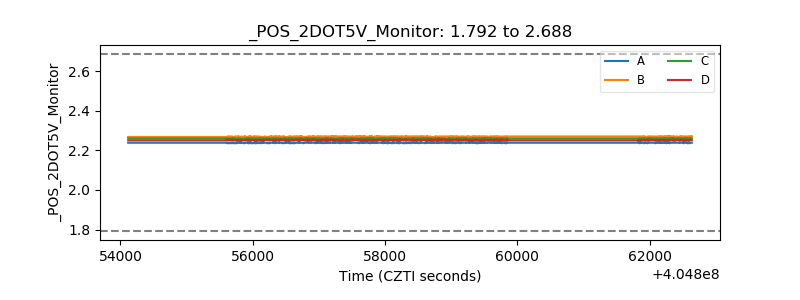 |
| +5 Volts monitor | 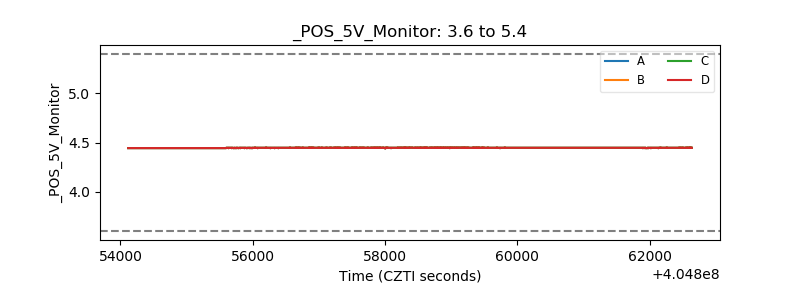 |
| _ROLL_ROT | 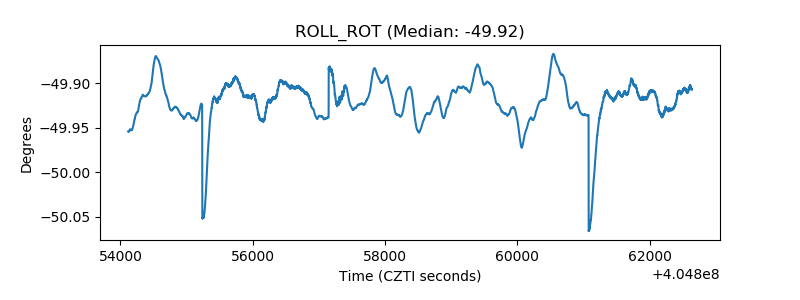 |
| _Roll_DEC | 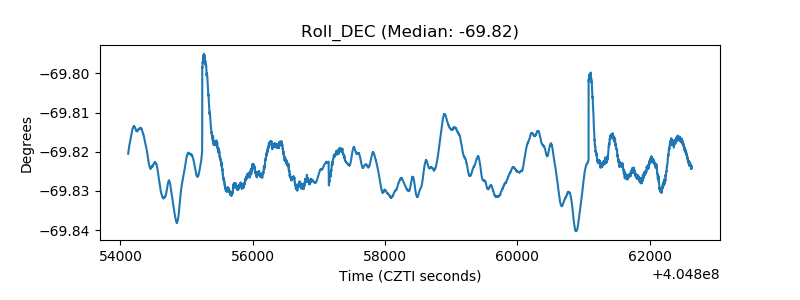 |
| _Roll_RA | 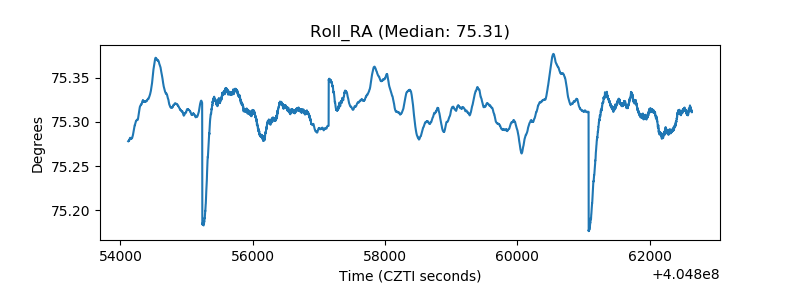 |
| Veto Counter | 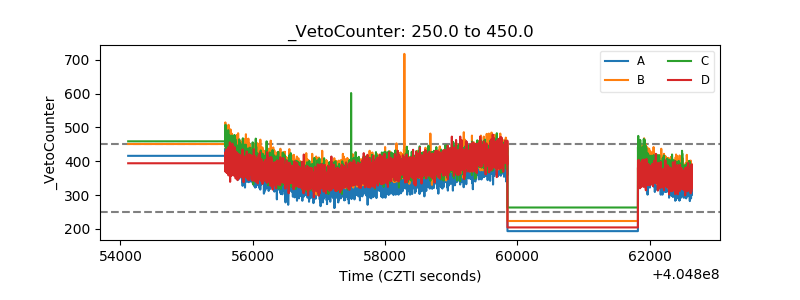 |