| Param | Original file | Final file |
|---|---|---|
| Filename | modeM0/AS1A10_094T24_9000005374_38335cztM0_level2.fits | modeM0/AS1A10_094T24_9000005374_38335cztM0_level2_quad_clean.evt |
| Size (bytes) | 457,099,200 | 93,018,240 |
| Size | 435.9 MB | 88.7 MB |
| Events in quadrant A | 3,084,288 | 634,943 |
| Events in quadrant B | 3,180,212 | 646,883 |
| Events in quadrant C | 2,774,250 | 620,295 |
| Events in quadrant D | 7,442,872 | 518,699 |
| Mode SS | |||
|---|---|---|---|
| Quadrant | BADHDUFLAG | Total packets | Discarded packets |
| A | 0 | 116 | 0 |
| B | 0 | 116 | 0 |
| C | 0 | 116 | 0 |
| D | 0 | 116 | 0 |
| Mode M0 | |||
|---|---|---|---|
| Quadrant | BADHDUFLAG | Total packets | Discarded packets |
| A | 0 | 12816 | 3 |
| B | 0 | 13290 | 2 |
| C | 0 | 11868 | 2 |
| D | 0 | 26046 | 2 |
| Mode M9 | |||
|---|---|---|---|
| Quadrant | BADHDUFLAG | Total packets | Discarded packets |
| A | 0 | 24 | 0 |
| B | 0 | 24 | 0 |
| C | 0 | 24 | 0 |
| D | 0 | 25 | 0 |
| Quadrant | Total seconds | Saturated seconds | Saturation percentage |
|---|---|---|---|
| A | 5654 | 48 | 0.848956% |
| B | 5654 | 86 | 1.521047% |
| C | 5654 | 41 | 0.725150% |
| D | 5654 | 685 | 12.115317% |
Noise dominated data is calculated using 1-second bins in cleaned event files. If a bin has >2000 counts, and if more than 50% of those come from <1% of pixels, then it is considered to be noise-dominated and hence unusable.
| Quadrant | # 1 sec bins | Bins with >0 counts | Bins with >2000 counts | High rate bins dominated by noise | Noise dominated (total time) | Noise dominated (detector-on time) | Marked lightcurve |
|---|---|---|---|---|---|---|---|
| A | 7326 | 5655 | 38 | 38 | 0.52% | 0.67% | 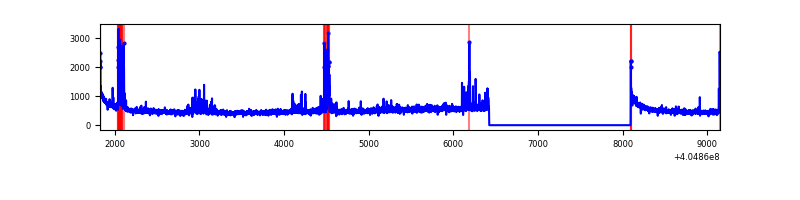 |
| B | 7326 | 5655 | 37 | 37 | 0.51% | 0.65% | 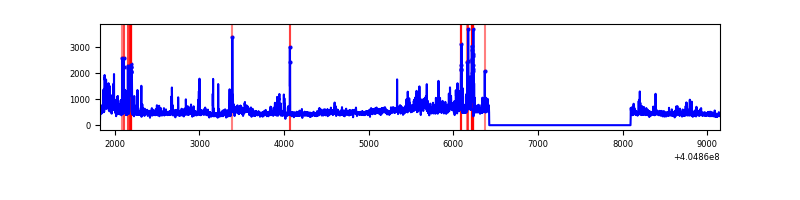 |
| C | 7326 | 5655 | 32 | 32 | 0.44% | 0.57% | 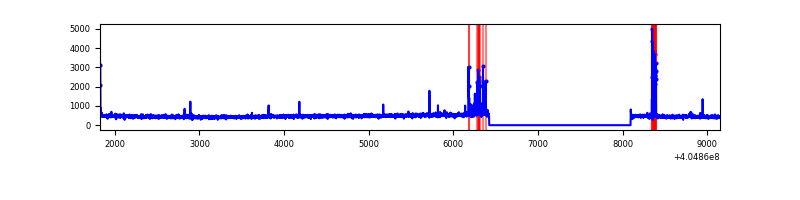 |
| D | 7326 | 5655 | 595 | 595 | 8.12% | 10.52% | 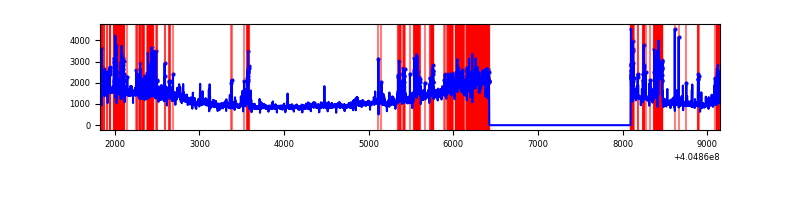 |
Top three noisy pixels from each quadrant. If the there are fewer than three noisy pixels in the level2.evt file, extra rows are filled as -1
| Pixel properties | Quadrant properties | ||||||
|---|---|---|---|---|---|---|---|
| Quadrant | DetID | PixID | Counts | Sigma | Mean | Median | Sigma |
| A | 10 | 83 | 408169 | 3290.28 | 613 | 601 | 123.9 |
| A | 13 | 248 | 206699 | 1663.82 | 613 | 601 | 123.9 |
| A | 12 | 189 | 58529 | 467.65 | 613 | 601 | 123.9 |
| B | 0 | 183 | 375209 | 3209.49 | 613 | 596 | 116.7 |
| B | 0 | 155 | 118356 | 1008.91 | 613 | 596 | 116.7 |
| B | 0 | 229 | 104528 | 890.43 | 613 | 596 | 116.7 |
| C | 15 | 214 | 239140 | 1725.52 | 603 | 606 | 138.2 |
| C | 14 | 254 | 87339 | 627.42 | 603 | 606 | 138.2 |
| C | 3 | 9 | 66619 | 477.53 | 603 | 606 | 138.2 |
| D | 10 | 203 | 3608858 | 25639.19 | 577 | 561 | 140.7 |
| D | 12 | 235 | 412503 | 2927.1 | 577 | 561 | 140.7 |
| D | 2 | 16 | 362063 | 2568.7 | 577 | 561 | 140.7 |
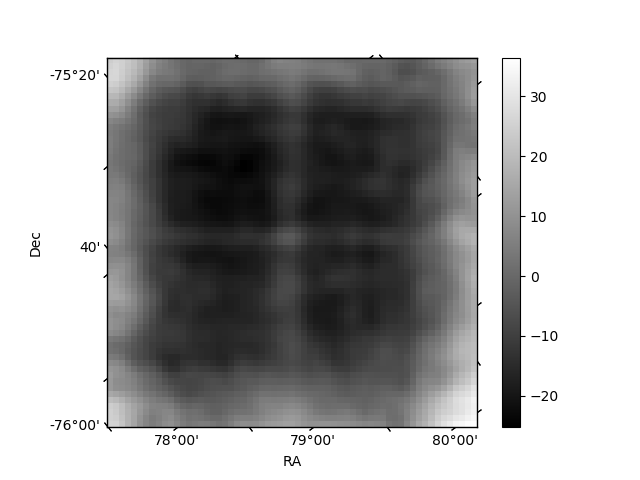
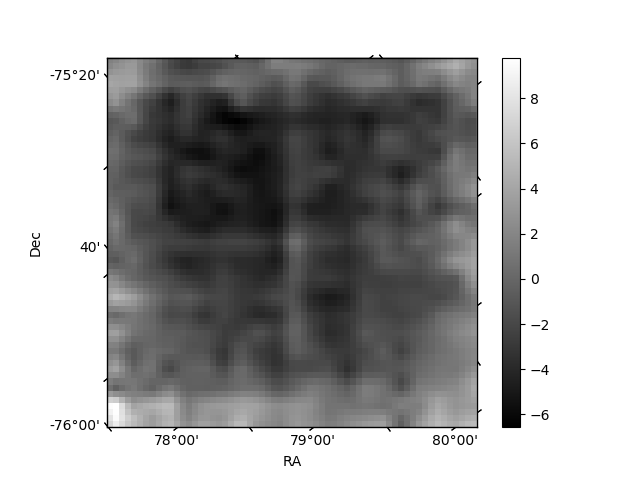
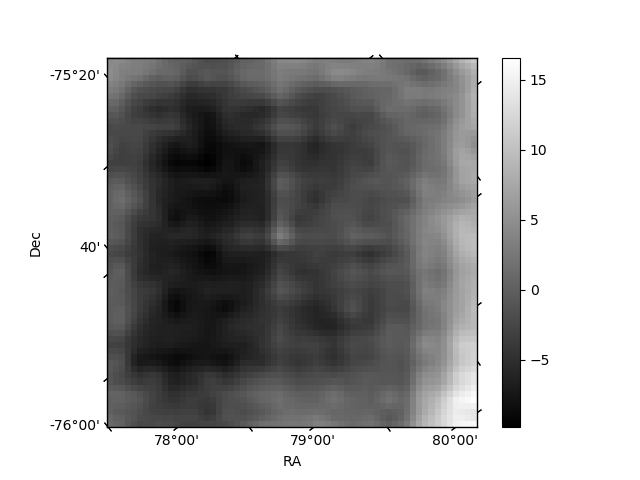
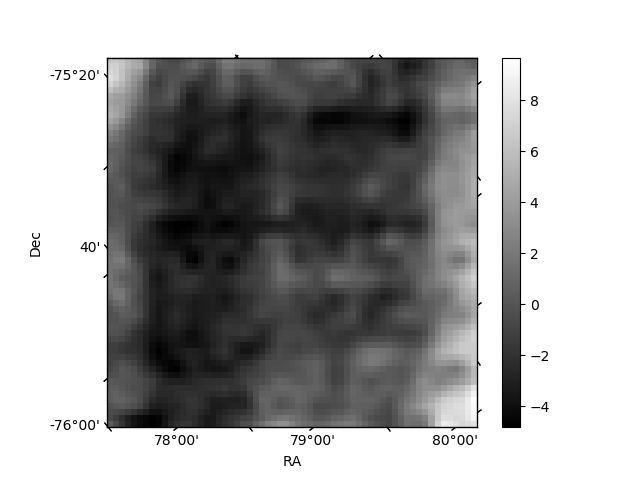
Histogram calculated using DETX and DETY for each event in the final _common_clean file
| Quadrant A | 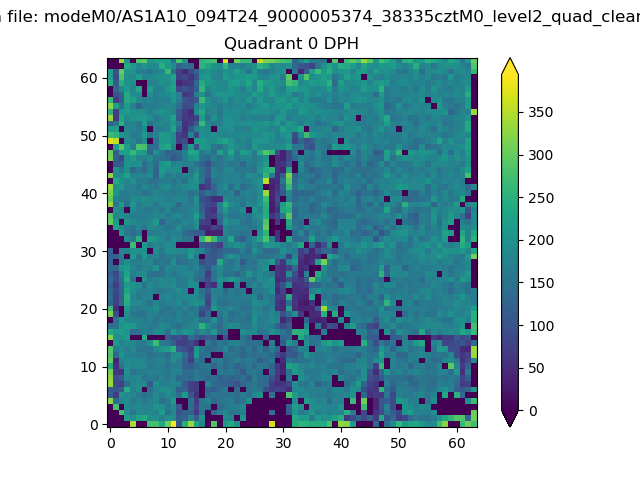 |
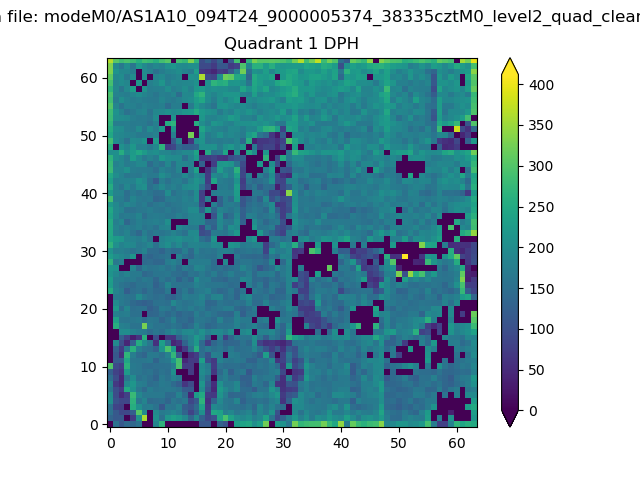 |
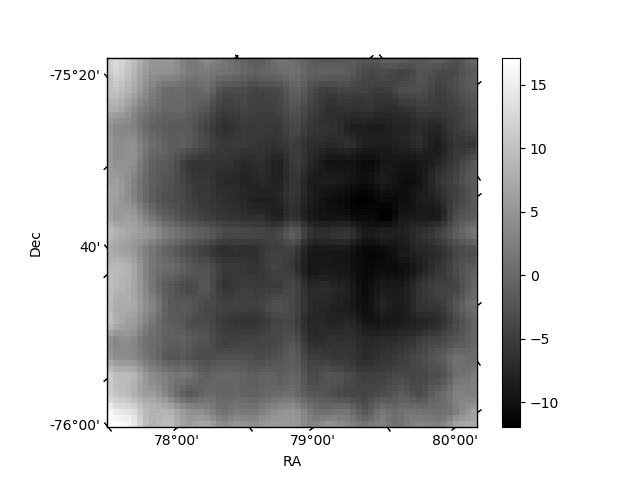
Quadrant B |
|---|---|---|---|
| Quadrant D | 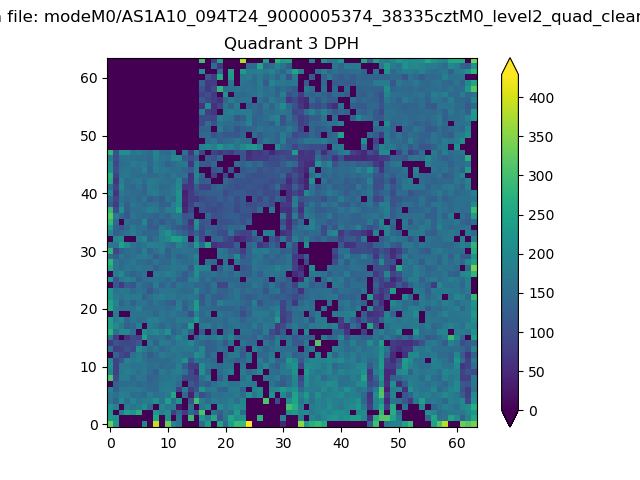 |
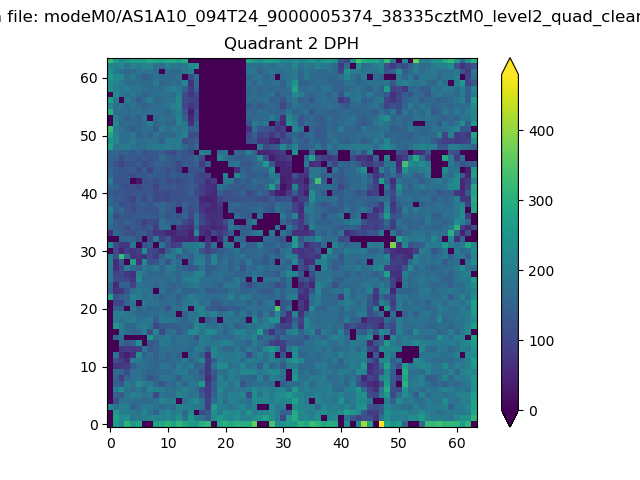 |
Quadrant C |
| Plot type | Count rate plots | Images |
|---|---|---|
| Comparison with Poisson distribution Blue bars denote a histogram of data divided into 1 sec bins. Red curve is a Poisson curve with rate = median count rate of data. |
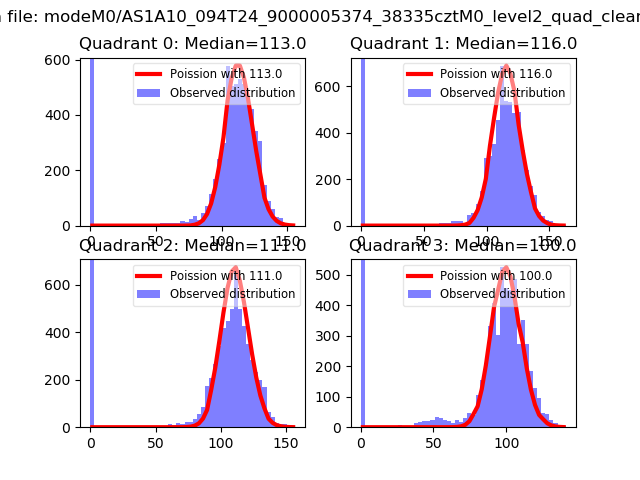 |
 |
| Quadrant-wise count rates Data is divided into 100 sec bins |
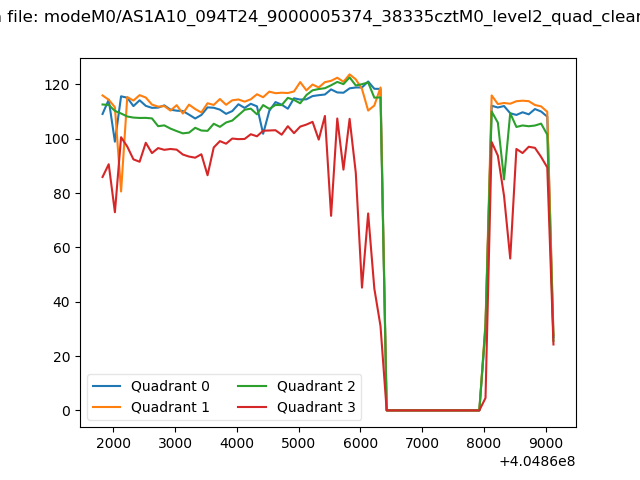 |
|
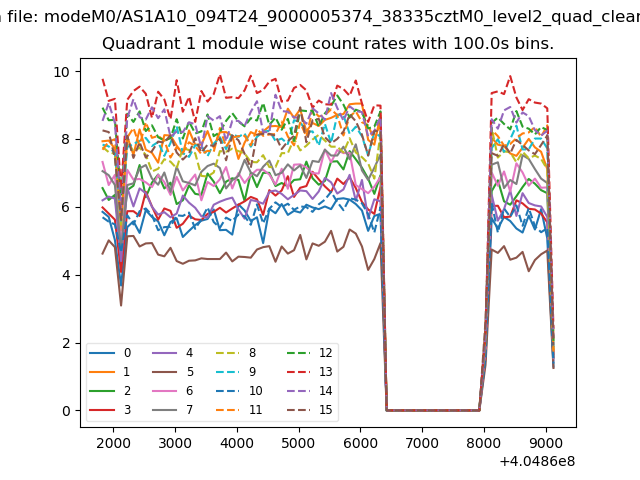
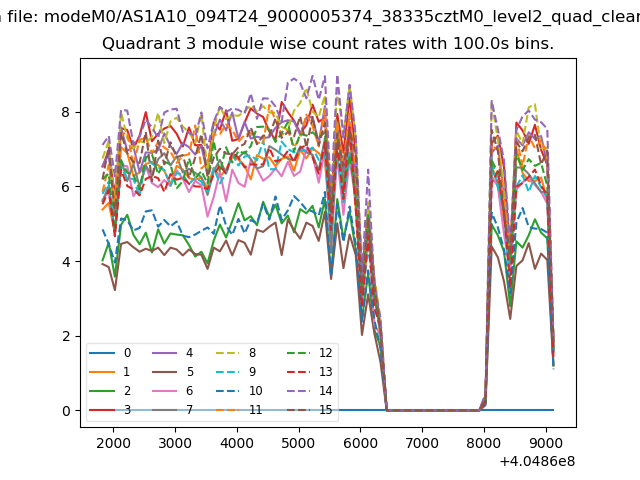
| Module-wise count rates for Quadrant A Data is divided into 100 sec bins |
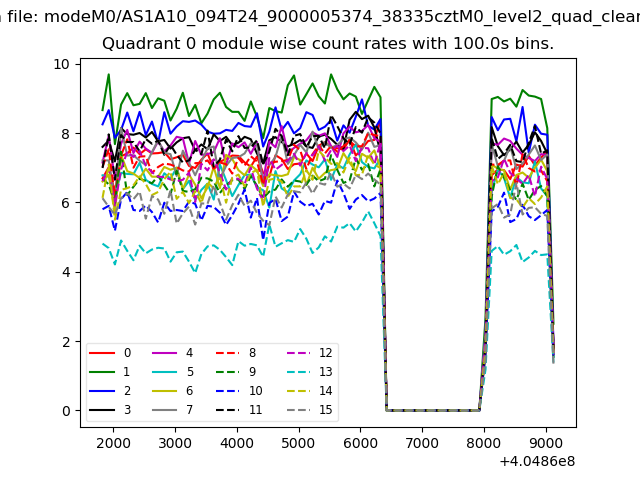 |
 |
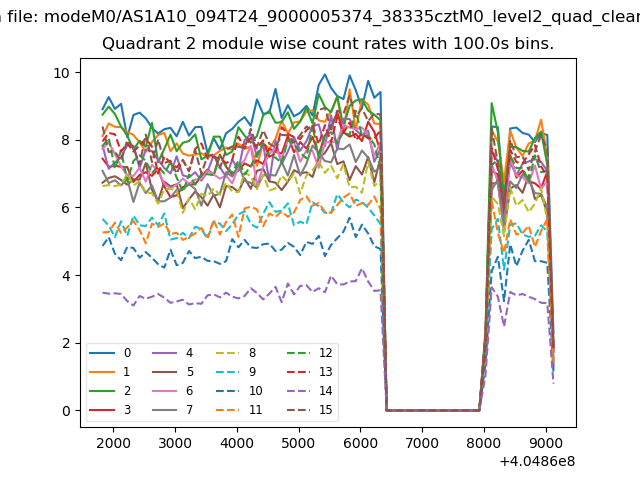
| Module-wise count rates for Quadrant B Data is divided into 100 sec bins |
 |
 |
| Module-wise count rates for Quadrant C Data is divided into 100 sec bins |
 |
 |
| Module-wise count rates for Quadrant D Data is divided into 100 sec bins |
 |
 |
| Parameter | Plot |
|---|---|
| CZT HV Monitor | 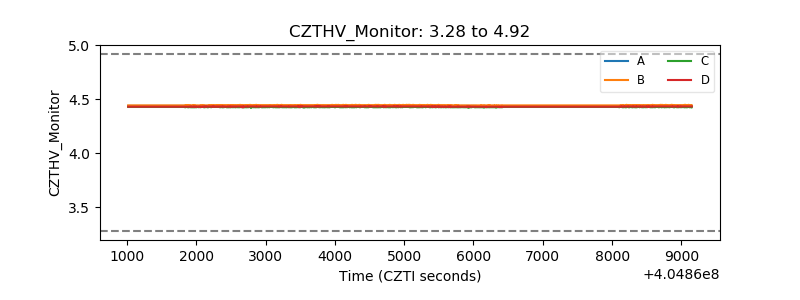 |
| D_VDD | 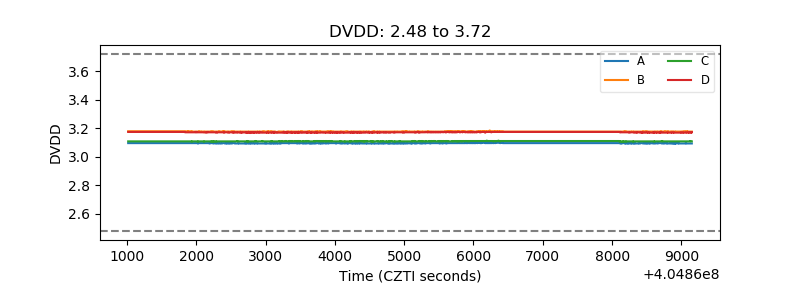 |
| Temperature 1 | 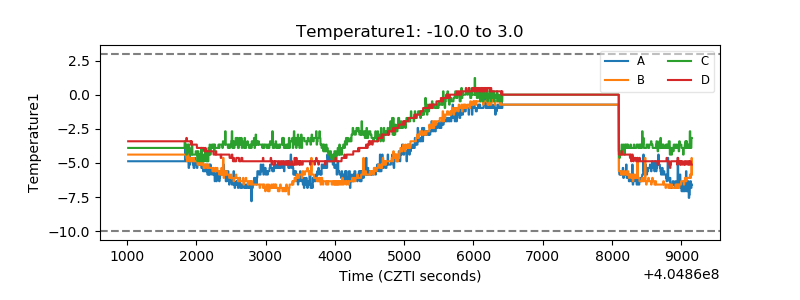 |
| Veto HV Monitor | 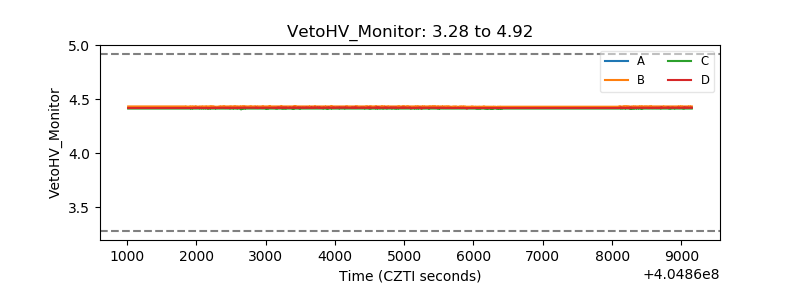 |
| Veto LLD | 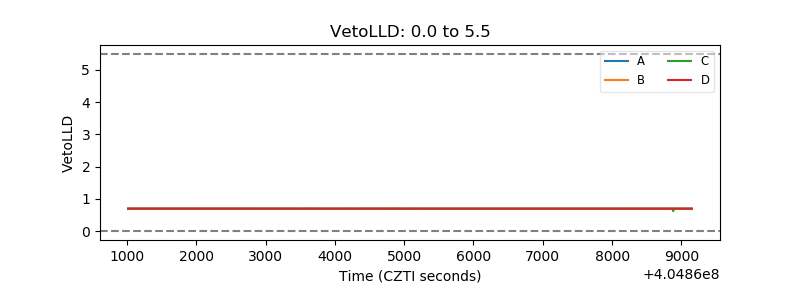 |
| Alpha Counter | 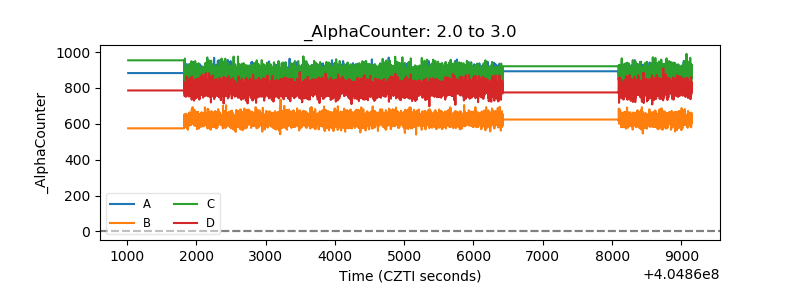 |
| _CPM_Rate | 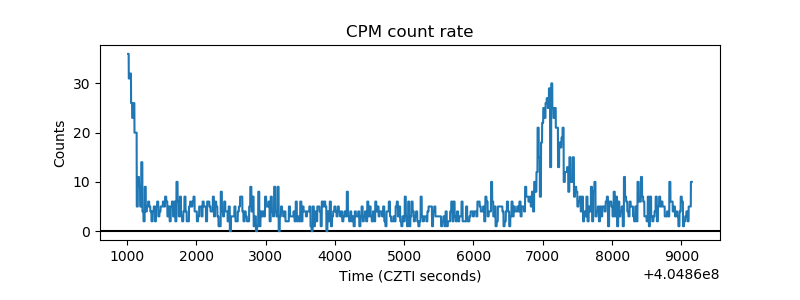 |
| CZT Counter | 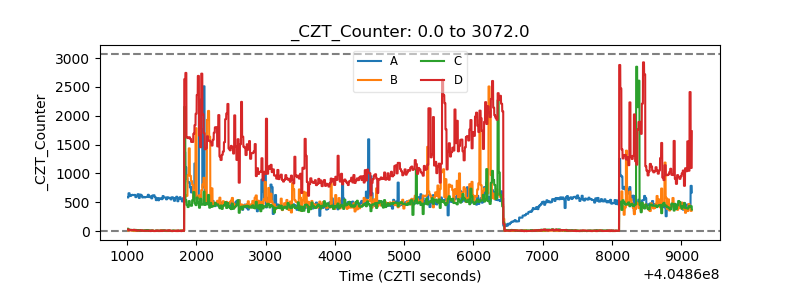 |
| +2.5 Volts monitor | 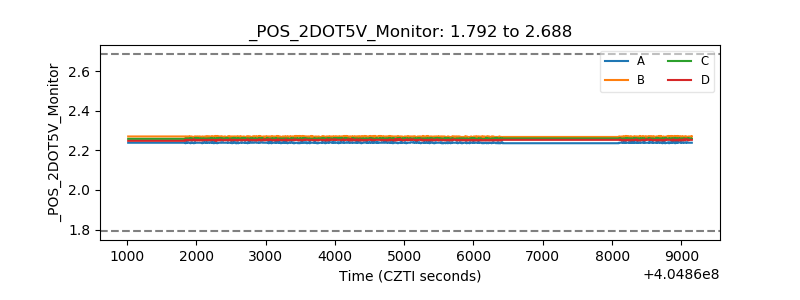 |
| +5 Volts monitor | 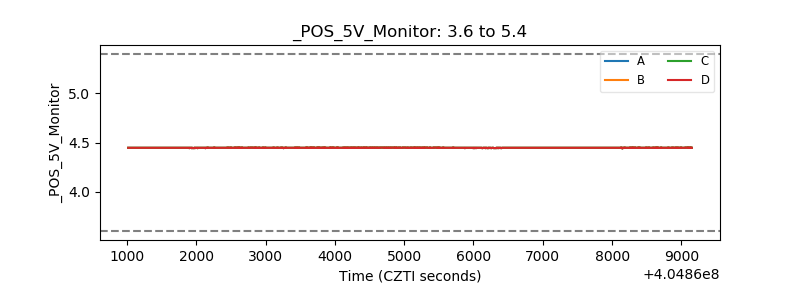 |
| _ROLL_ROT | 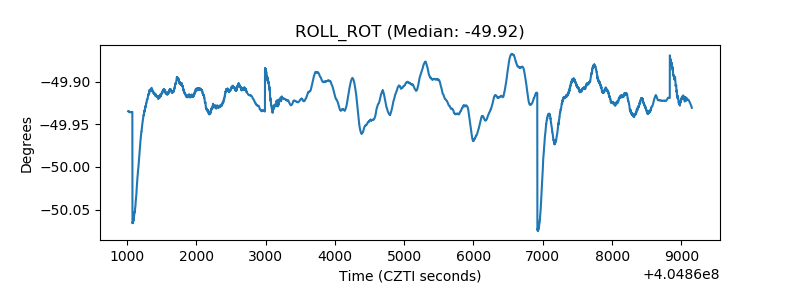 |
| _Roll_DEC | 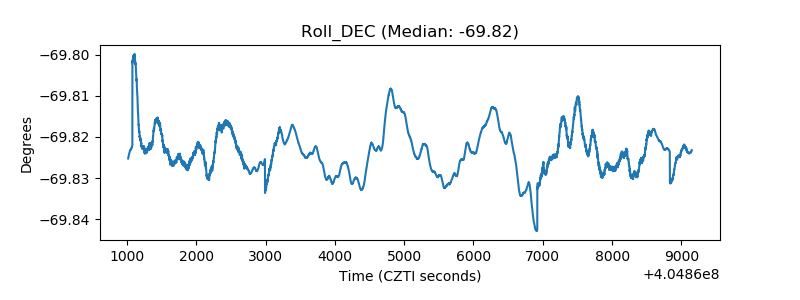 |
| _Roll_RA | 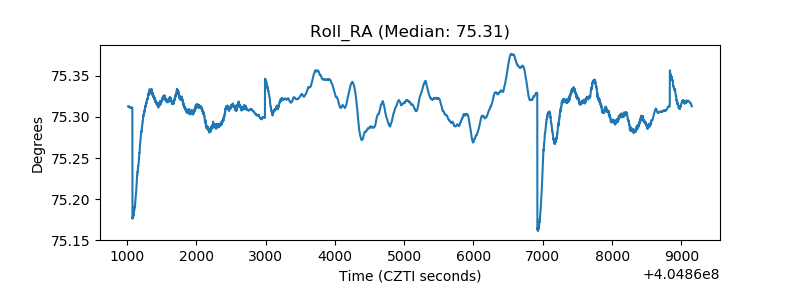 |
| Veto Counter | 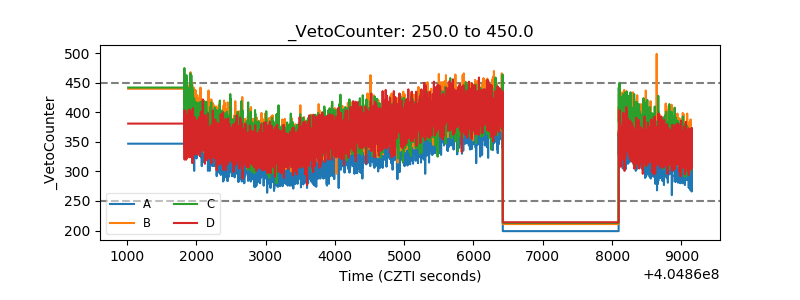 |