| Param | Original file | Final file |
|---|---|---|
| Filename | modeM0/AS1A10_094T24_9000005374_38336cztM0_level2.fits | modeM0/AS1A10_094T24_9000005374_38336cztM0_level2_quad_clean.evt |
| Size (bytes) | 508,982,400 | 93,568,320 |
| Size | 485.4 MB | 89.2 MB |
| Events in quadrant A | 3,330,746 | 648,349 |
| Events in quadrant B | 3,109,842 | 669,017 |
| Events in quadrant C | 2,926,640 | 639,743 |
| Events in quadrant D | 9,018,215 | 465,634 |
| Mode SS | |||
|---|---|---|---|
| Quadrant | BADHDUFLAG | Total packets | Discarded packets |
| A | 0 | 120 | 0 |
| B | 0 | 120 | 0 |
| C | 0 | 120 | 0 |
| D | 0 | 120 | 0 |
| Mode M0 | |||
|---|---|---|---|
| Quadrant | BADHDUFLAG | Total packets | Discarded packets |
| A | 0 | 13680 | 3 |
| B | 0 | 13364 | 2 |
| C | 0 | 12390 | 2 |
| D | 0 | 30898 | 2 |
| Mode M9 | |||
|---|---|---|---|
| Quadrant | BADHDUFLAG | Total packets | Discarded packets |
| A | 0 | 27 | 0 |
| B | 0 | 27 | 0 |
| C | 0 | 27 | 0 |
| D | 0 | 28 | 0 |
| Quadrant | Total seconds | Saturated seconds | Saturation percentage |
|---|---|---|---|
| A | 5871 | 87 | 1.481860% |
| B | 5871 | 42 | 0.715381% |
| C | 5871 | 43 | 0.732414% |
| D | 5871 | 1436 | 24.459206% |
Noise dominated data is calculated using 1-second bins in cleaned event files. If a bin has >2000 counts, and if more than 50% of those come from <1% of pixels, then it is considered to be noise-dominated and hence unusable.
| Quadrant | # 1 sec bins | Bins with >0 counts | Bins with >2000 counts | High rate bins dominated by noise | Noise dominated (total time) | Noise dominated (detector-on time) | Marked lightcurve |
|---|---|---|---|---|---|---|---|
| A | 7244 | 5872 | 46 | 46 | 0.64% | 0.78% | 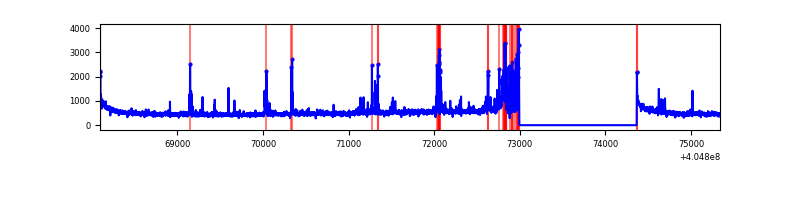 |
| B | 7244 | 5872 | 16 | 16 | 0.22% | 0.27% | 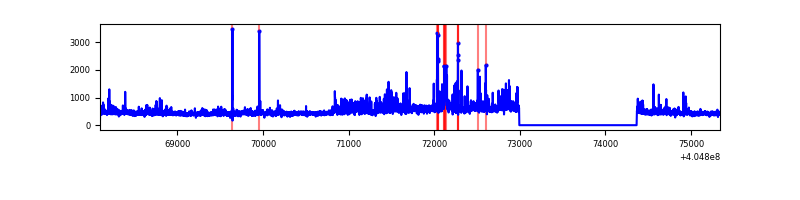 |
| C | 7244 | 5872 | 33 | 33 | 0.46% | 0.56% | 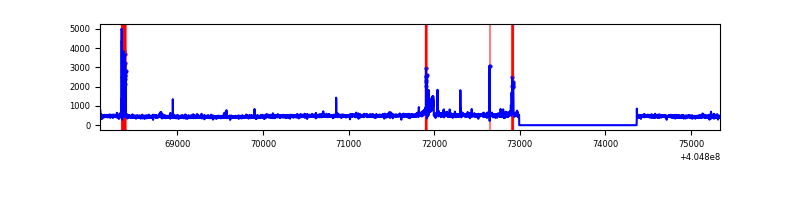 |
| D | 7244 | 5872 | 1322 | 1322 | 18.25% | 22.51% | 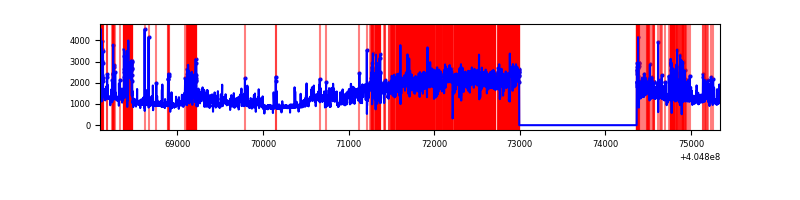 |
Top three noisy pixels from each quadrant. If the there are fewer than three noisy pixels in the level2.evt file, extra rows are filled as -1
| Pixel properties | Quadrant properties | ||||||
|---|---|---|---|---|---|---|---|
| Quadrant | DetID | PixID | Counts | Sigma | Mean | Median | Sigma |
| A | 10 | 83 | 424255 | 3265.66 | 641 | 628 | 129.7 |
| A | 13 | 248 | 281927 | 2168.48 | 641 | 628 | 129.7 |
| A | 9 | 143 | 62834 | 479.53 | 641 | 628 | 129.7 |
| B | 0 | 155 | 158552 | 1283.69 | 642 | 625 | 123.0 |
| B | 0 | 183 | 149954 | 1213.8 | 642 | 625 | 123.0 |
| B | 0 | 229 | 126685 | 1024.66 | 642 | 625 | 123.0 |
| C | 15 | 214 | 248664 | 1696.13 | 633 | 637 | 146.2 |
| C | 3 | 9 | 146079 | 994.6 | 633 | 637 | 146.2 |
| C | 10 | 20 | 30693 | 205.54 | 633 | 637 | 146.2 |
| D | 10 | 203 | 4358627 | 29907.99 | 592 | 577 | 145.7 |
| D | 2 | 16 | 1676497 | 11501.34 | 592 | 577 | 145.7 |
| D | 12 | 227 | 302746 | 2073.7 | 592 | 577 | 145.7 |
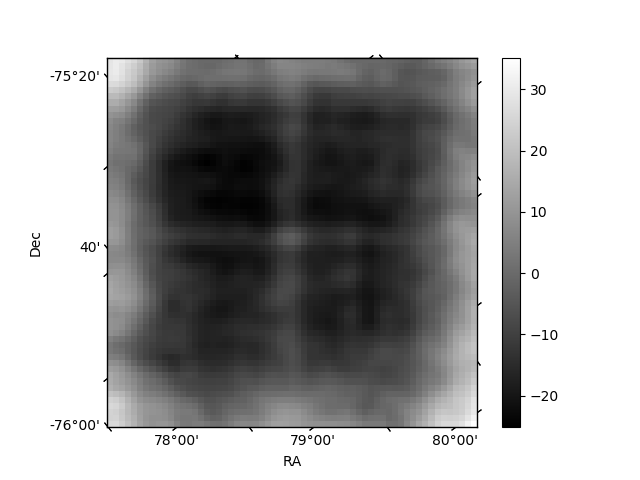
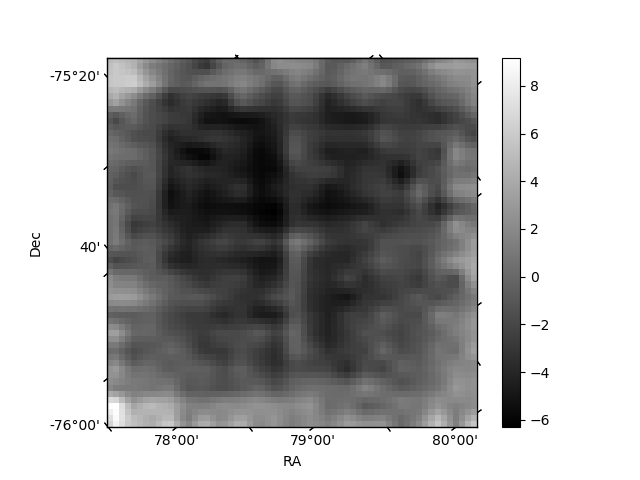
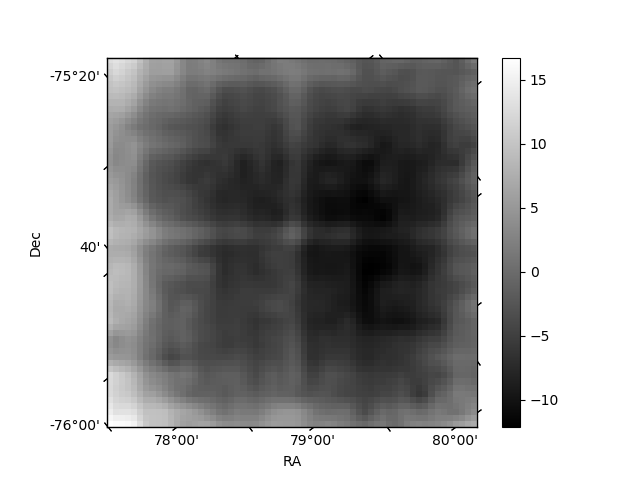
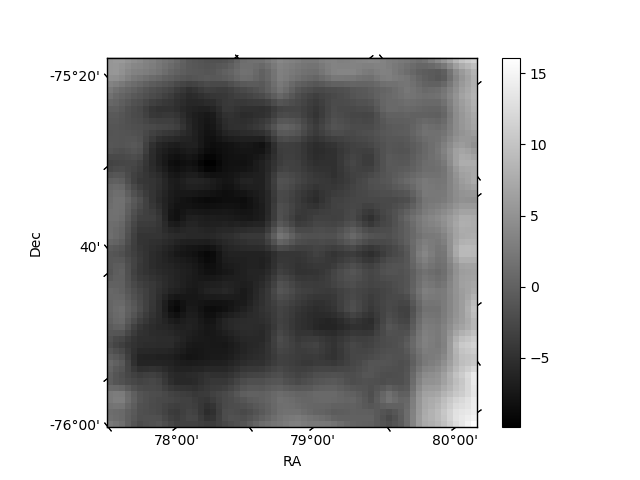
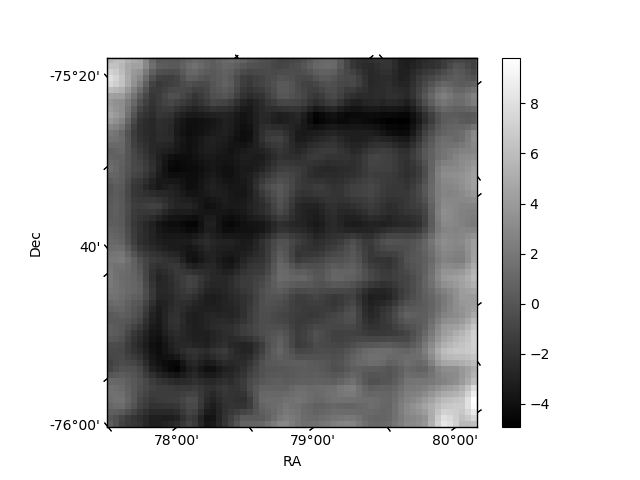
Histogram calculated using DETX and DETY for each event in the final _common_clean file
| Quadrant A | 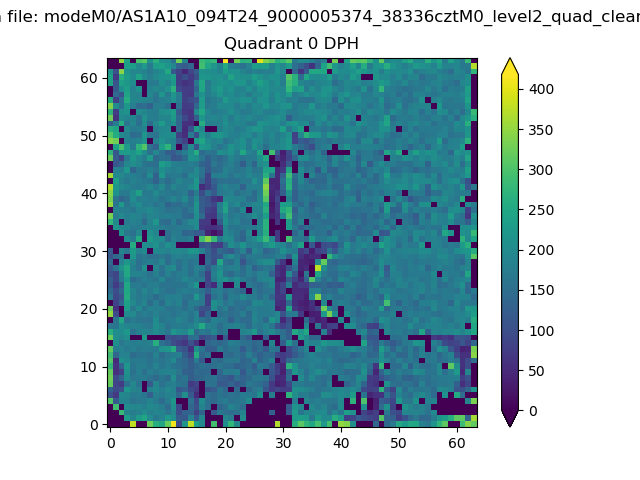 |
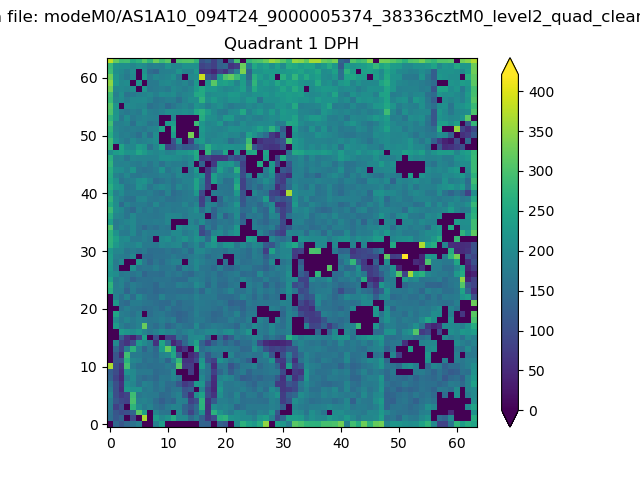 |
Quadrant B |
|---|---|---|---|
| Quadrant D | 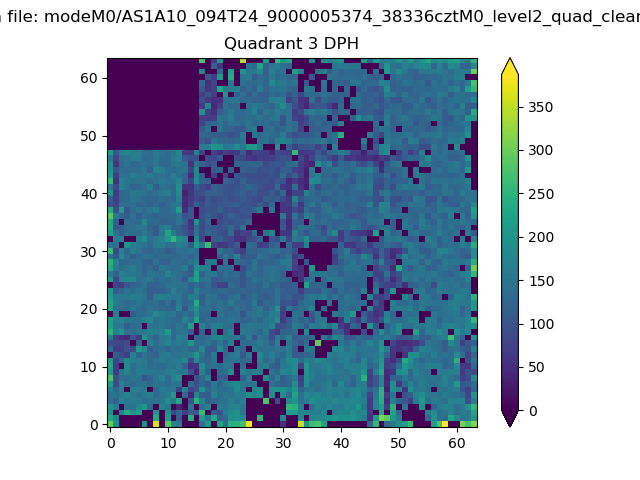 |
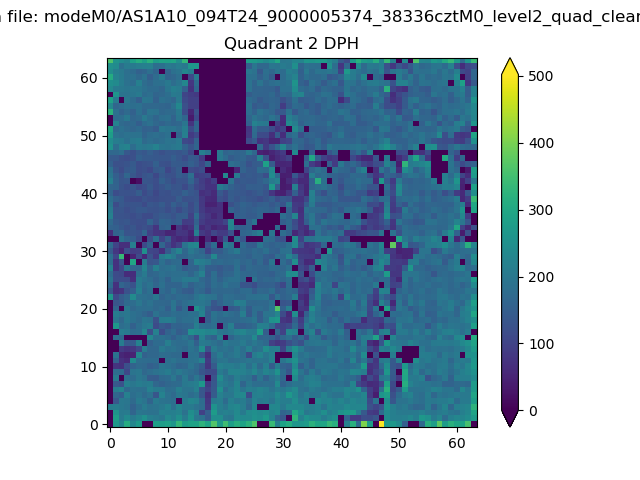 |
Quadrant C |
| Plot type | Count rate plots | Images |
|---|---|---|
| Comparison with Poisson distribution Blue bars denote a histogram of data divided into 1 sec bins. Red curve is a Poisson curve with rate = median count rate of data. |
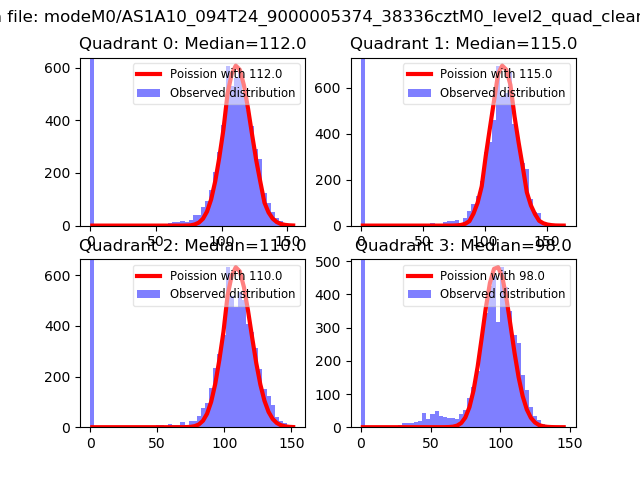 |
 |
| Quadrant-wise count rates Data is divided into 100 sec bins |
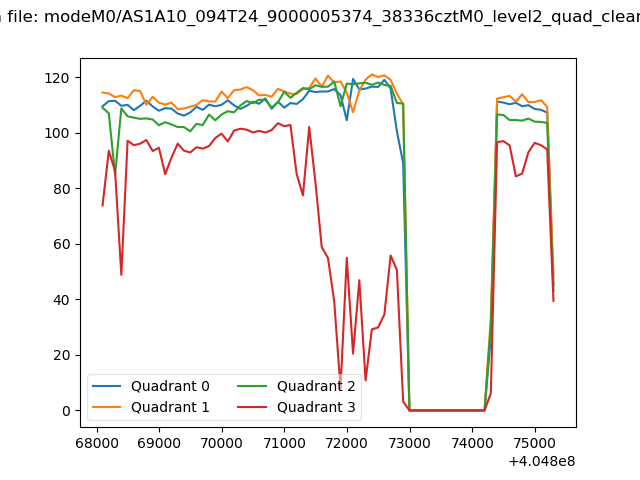 |
|
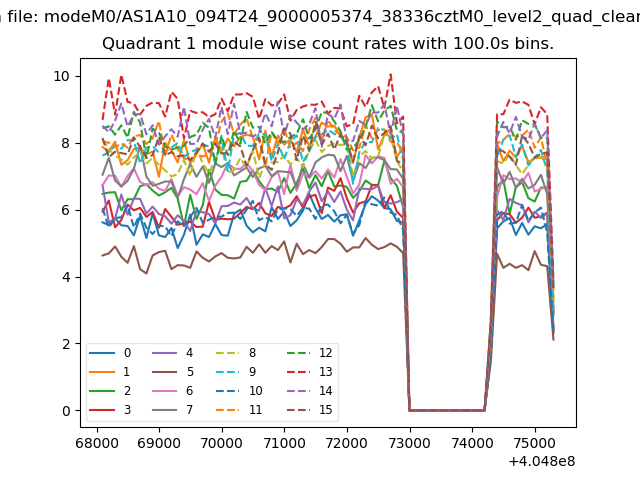
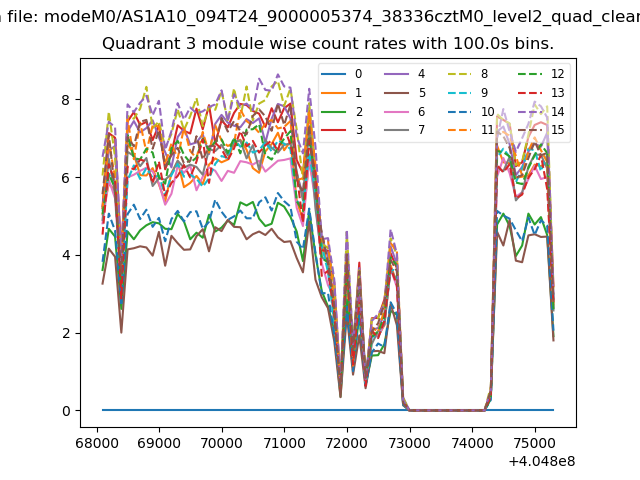
| Module-wise count rates for Quadrant A Data is divided into 100 sec bins |
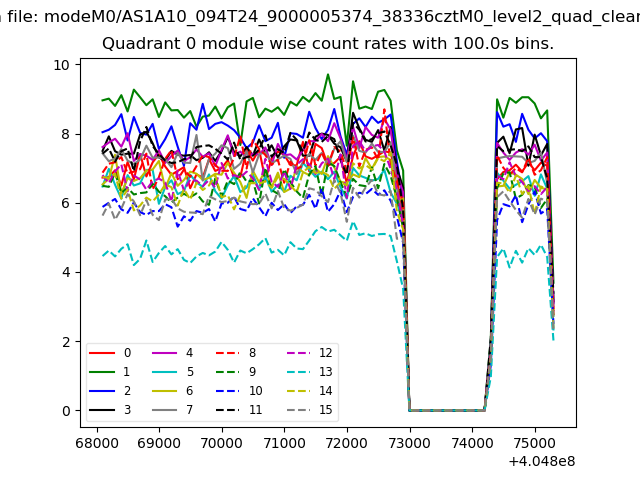 |
 |
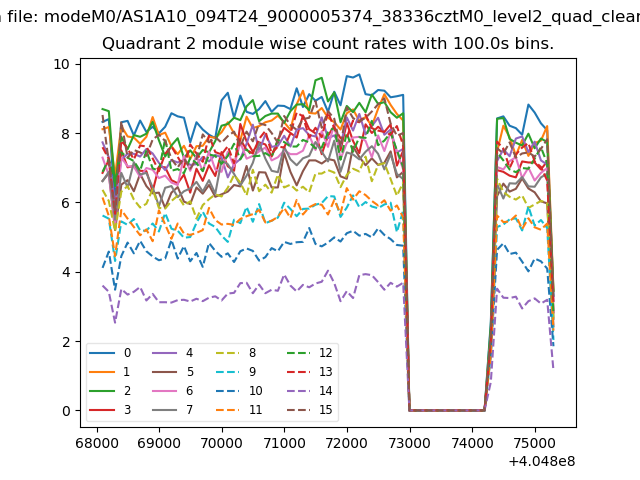
| Module-wise count rates for Quadrant B Data is divided into 100 sec bins |
 |
 |
| Module-wise count rates for Quadrant C Data is divided into 100 sec bins |
 |
 |
| Module-wise count rates for Quadrant D Data is divided into 100 sec bins |
 |
 |
| Parameter | Plot |
|---|---|
| CZT HV Monitor | 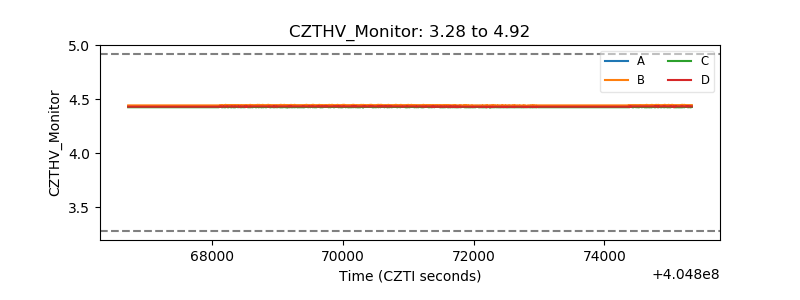 |
| D_VDD | 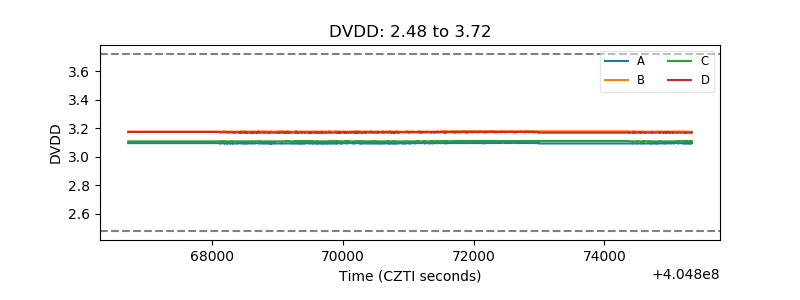 |
| Temperature 1 | 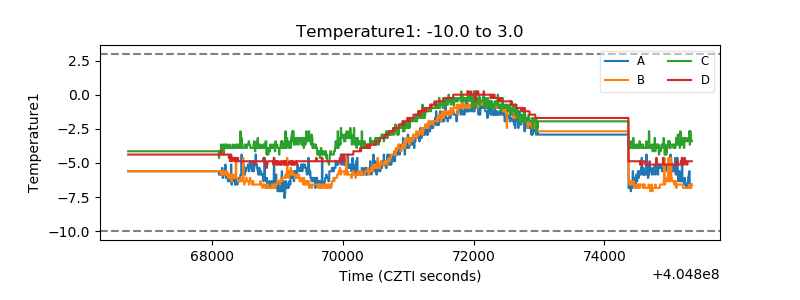 |
| Veto HV Monitor | 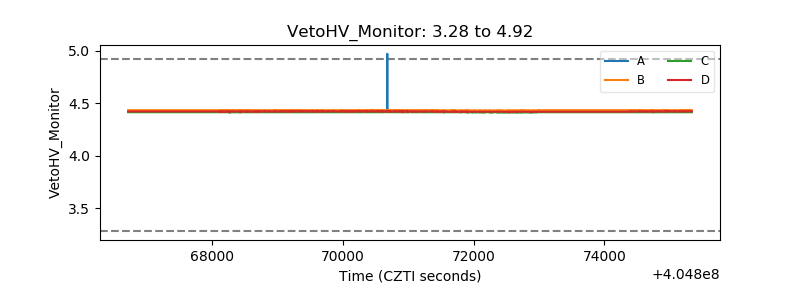 |
| Veto LLD | 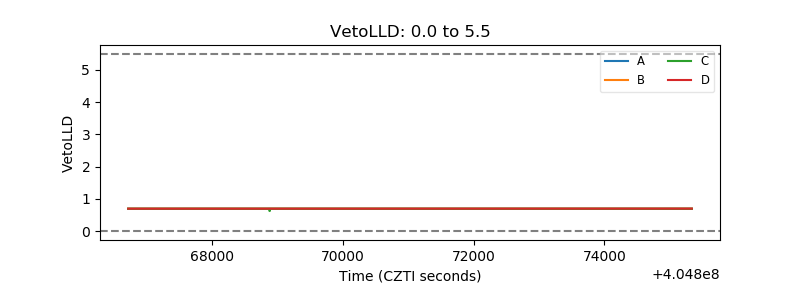 |
| Alpha Counter | 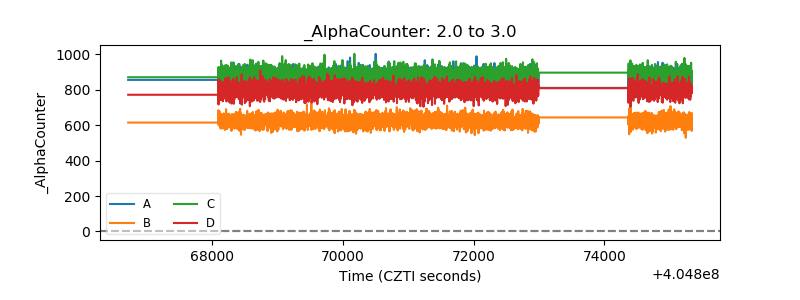 |
| _CPM_Rate | 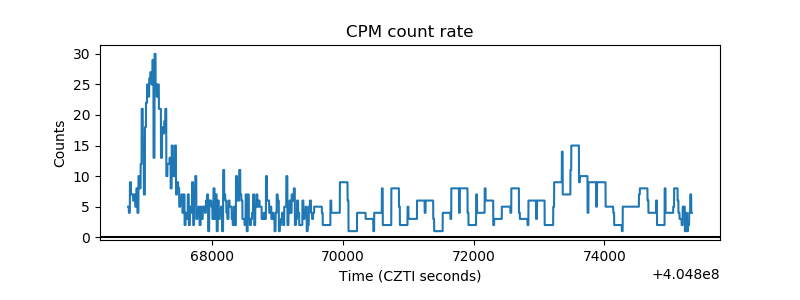 |
| CZT Counter | 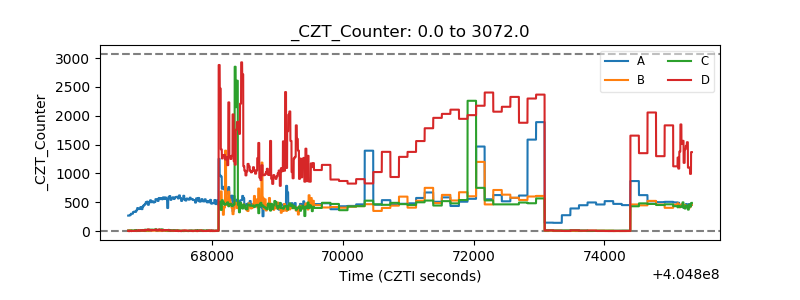 |
| +2.5 Volts monitor | 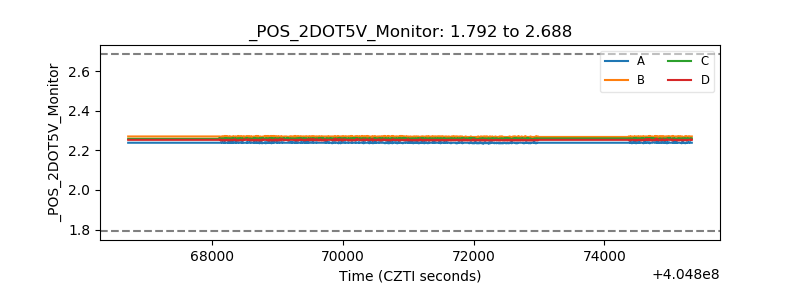 |
| +5 Volts monitor | 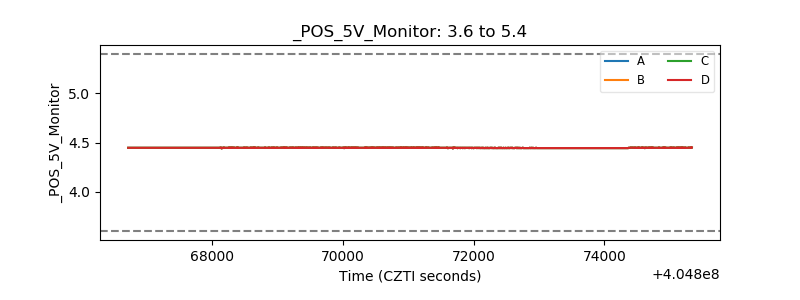 |
| _ROLL_ROT |  |
| _Roll_DEC | 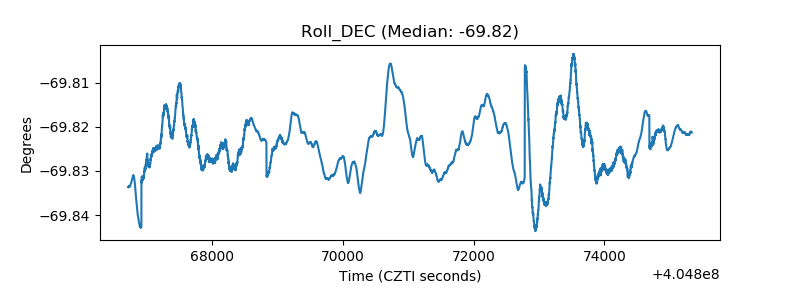 |
| _Roll_RA | 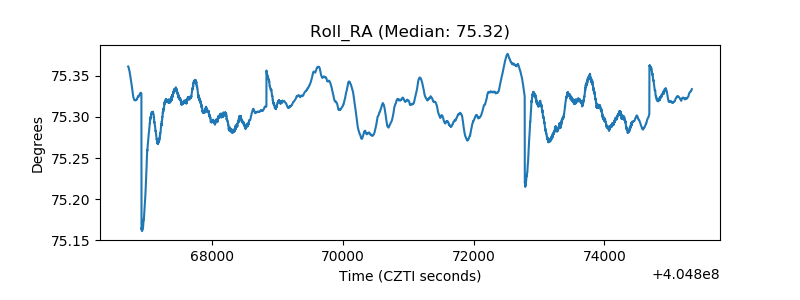 |
| Veto Counter | 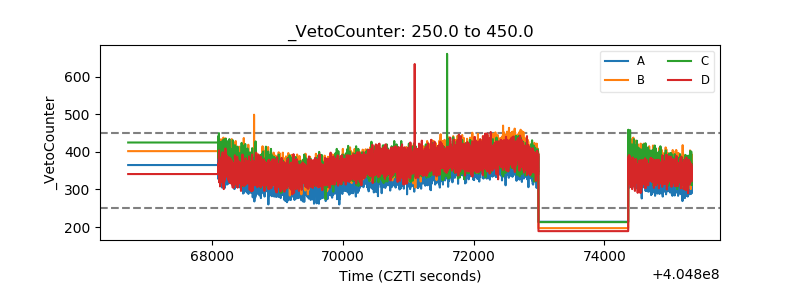 |