| Param | Original file | Final file |
|---|---|---|
| Filename | modeM0/AS1A10_094T24_9000005374_38337cztM0_level2.fits | modeM0/AS1A10_094T24_9000005374_38337cztM0_level2_quad_clean.evt |
| Size (bytes) | 507,358,080 | 96,062,400 |
| Size | 483.9 MB | 91.6 MB |
| Events in quadrant A | 3,251,291 | 657,972 |
| Events in quadrant B | 3,051,569 | 679,382 |
| Events in quadrant C | 2,895,798 | 652,069 |
| Events in quadrant D | 9,118,164 | 501,186 |
| Mode SS | |||
|---|---|---|---|
| Quadrant | BADHDUFLAG | Total packets | Discarded packets |
| A | 0 | 122 | 0 |
| B | 0 | 122 | 0 |
| C | 0 | 122 | 0 |
| D | 0 | 122 | 0 |
| Mode M0 | |||
|---|---|---|---|
| Quadrant | BADHDUFLAG | Total packets | Discarded packets |
| A | 0 | 13290 | 3 |
| B | 0 | 13177 | 2 |
| C | 0 | 12285 | 2 |
| D | 0 | 31185 | 2 |
| Mode M9 | |||
|---|---|---|---|
| Quadrant | BADHDUFLAG | Total packets | Discarded packets |
| A | 0 | 13 | 0 |
| B | 0 | 13 | 0 |
| C | 0 | 13 | 0 |
| D | 0 | 14 | 0 |
| Quadrant | Total seconds | Saturated seconds | Saturation percentage |
|---|---|---|---|
| A | 5981 | 60 | 1.003177% |
| B | 5981 | 31 | 0.518308% |
| C | 5981 | 13 | 0.217355% |
| D | 5981 | 1231 | 20.581843% |
Noise dominated data is calculated using 1-second bins in cleaned event files. If a bin has >2000 counts, and if more than 50% of those come from <1% of pixels, then it is considered to be noise-dominated and hence unusable.
| Quadrant | # 1 sec bins | Bins with >0 counts | Bins with >2000 counts | High rate bins dominated by noise | Noise dominated (total time) | Noise dominated (detector-on time) | Marked lightcurve |
|---|---|---|---|---|---|---|---|
| A | 7264 | 5982 | 44 | 44 | 0.61% | 0.74% | 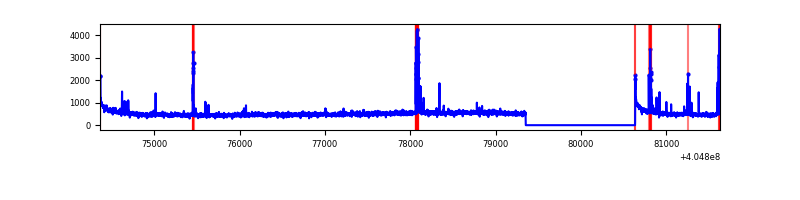 |
| B | 7264 | 5982 | 12 | 12 | 0.17% | 0.20% | 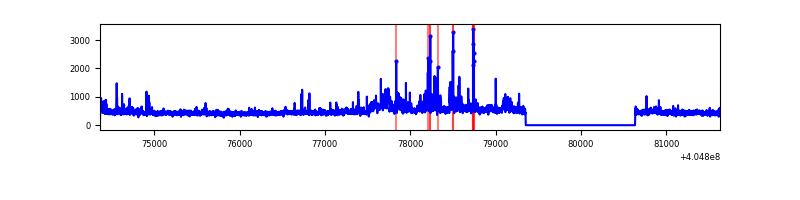 |
| C | 7264 | 5982 | 6 | 6 | 0.08% | 0.10% | 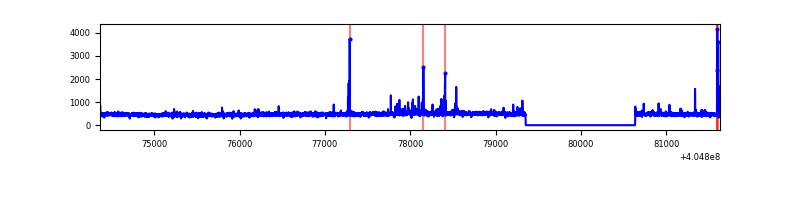 |
| D | 7264 | 5982 | 1241 | 1241 | 17.08% | 20.75% | 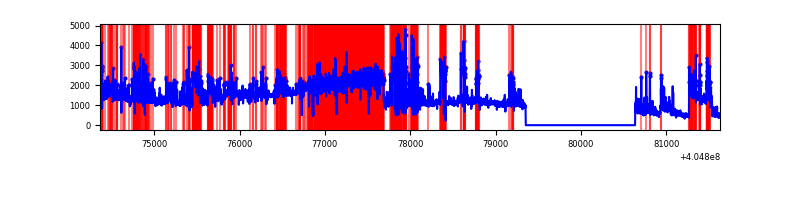 |
Top three noisy pixels from each quadrant. If the there are fewer than three noisy pixels in the level2.evt file, extra rows are filled as -1
| Pixel properties | Quadrant properties | ||||||
|---|---|---|---|---|---|---|---|
| Quadrant | DetID | PixID | Counts | Sigma | Mean | Median | Sigma |
| A | 10 | 83 | 429539 | 3222.94 | 654 | 640 | 133.1 |
| A | 13 | 248 | 213301 | 1598.03 | 654 | 640 | 133.1 |
| A | 12 | 189 | 35056 | 258.62 | 654 | 640 | 133.1 |
| B | 0 | 183 | 160903 | 1268.74 | 658 | 638 | 126.3 |
| B | 0 | 229 | 77459 | 608.15 | 658 | 638 | 126.3 |
| B | 0 | 186 | 76474 | 600.36 | 658 | 638 | 126.3 |
| C | 15 | 214 | 254923 | 1671.08 | 650 | 655 | 152.2 |
| C | 14 | 254 | 47805 | 309.88 | 650 | 655 | 152.2 |
| C | 1 | 23 | 39851 | 257.6 | 650 | 655 | 152.2 |
| D | 10 | 203 | 4547180 | 31037.02 | 601 | 582 | 146.5 |
| D | 2 | 16 | 875437 | 5972.13 | 601 | 582 | 146.5 |
| D | 12 | 227 | 777225 | 5301.7 | 601 | 582 | 146.5 |
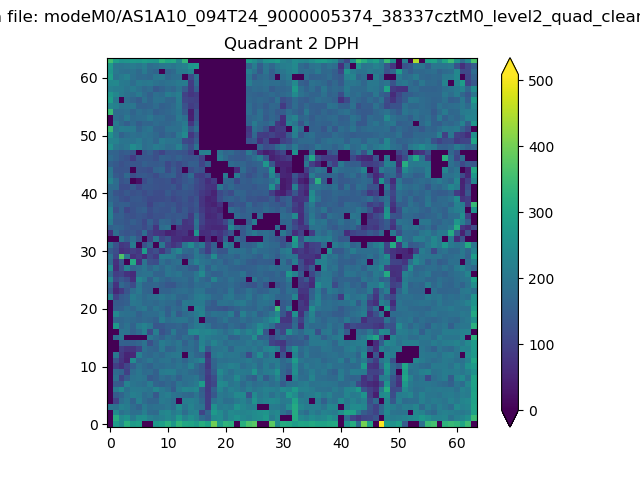
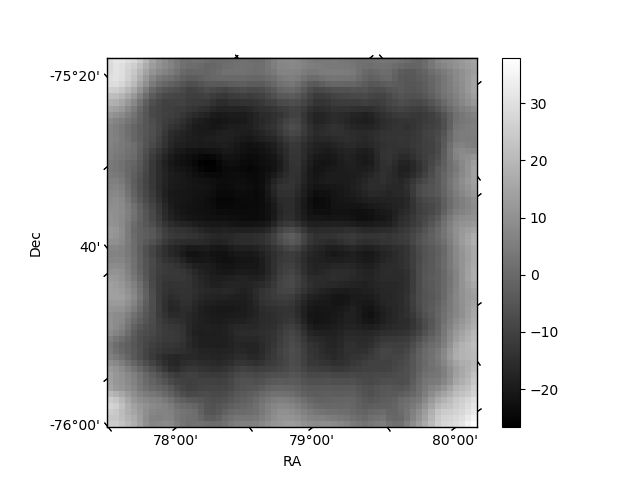
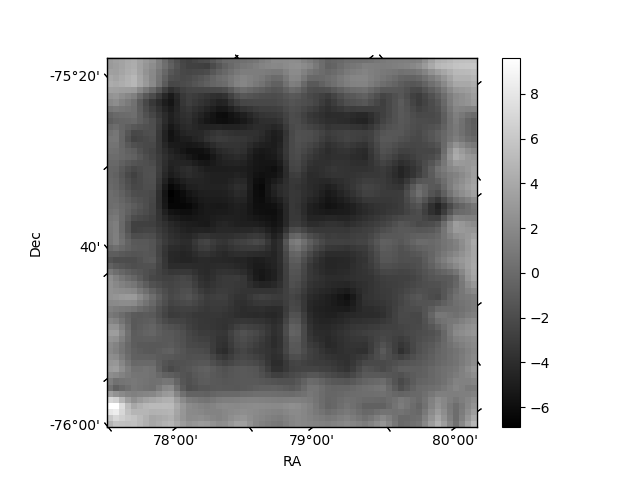
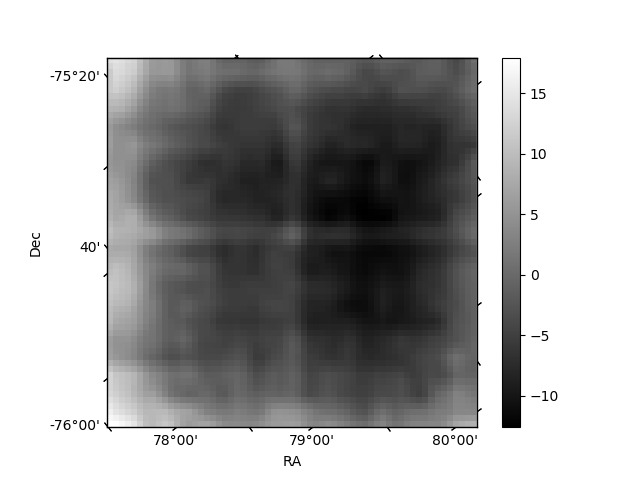
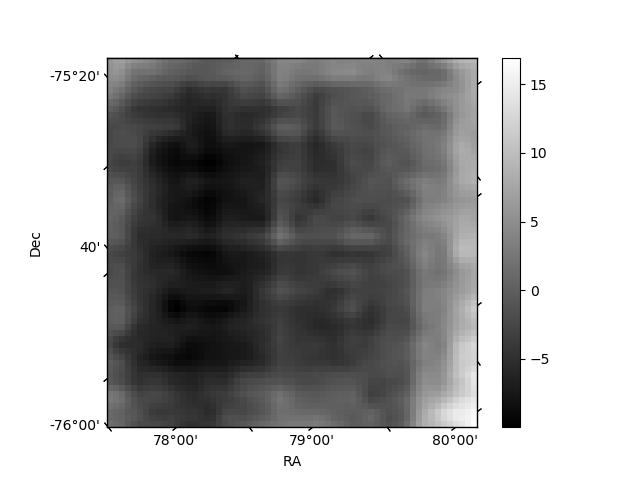
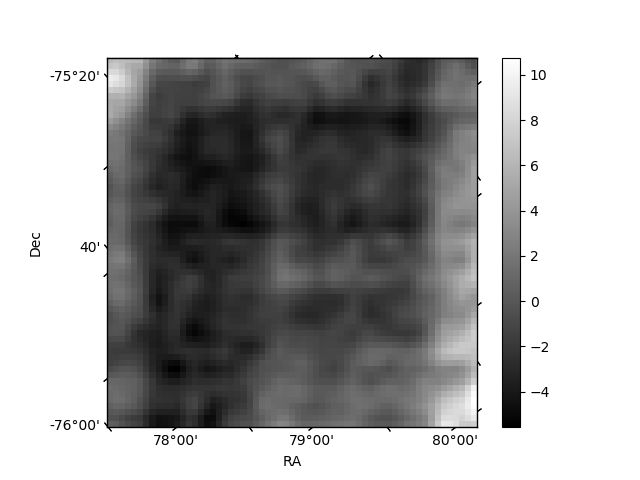
Histogram calculated using DETX and DETY for each event in the final _common_clean file
| Quadrant A | 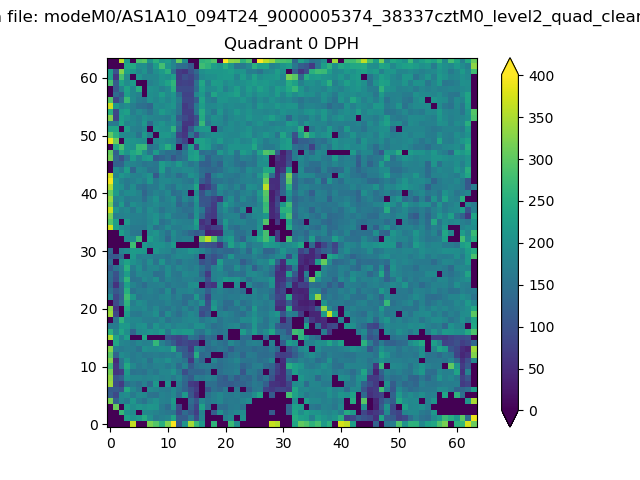 |
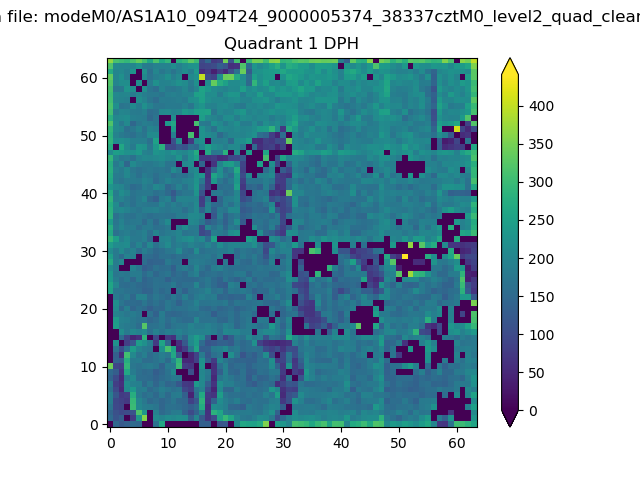 |
Quadrant B |
|---|---|---|---|
| Quadrant D | 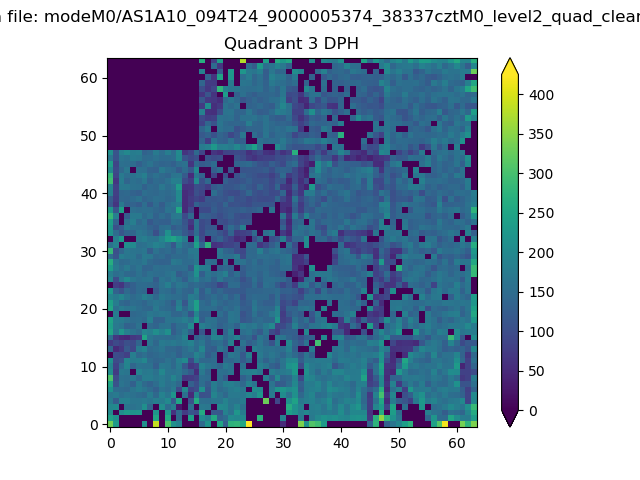 |
 |
Quadrant C |
| Plot type | Count rate plots | Images |
|---|---|---|
| Comparison with Poisson distribution Blue bars denote a histogram of data divided into 1 sec bins. Red curve is a Poisson curve with rate = median count rate of data. |
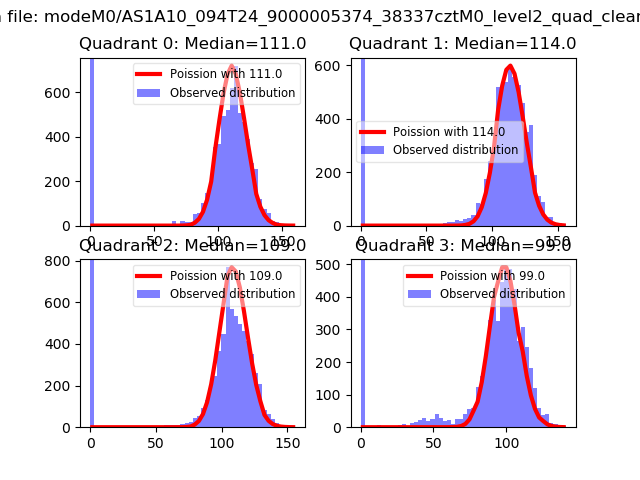 |
 |
| Quadrant-wise count rates Data is divided into 100 sec bins |
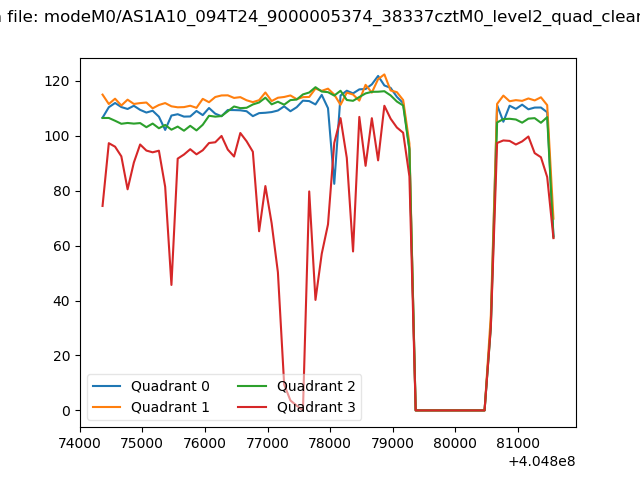 |
|
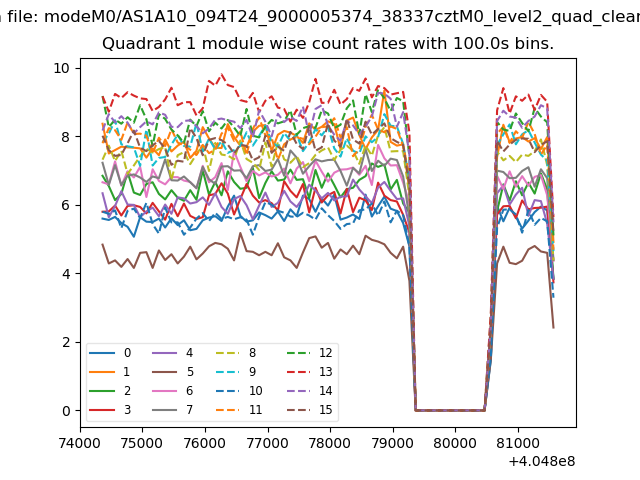
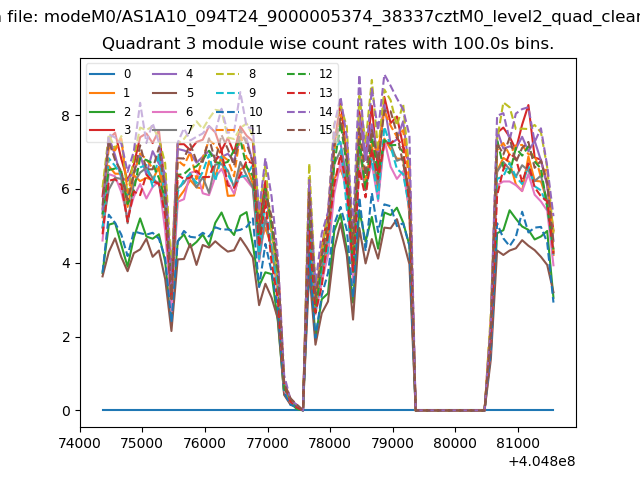
| Module-wise count rates for Quadrant A Data is divided into 100 sec bins |
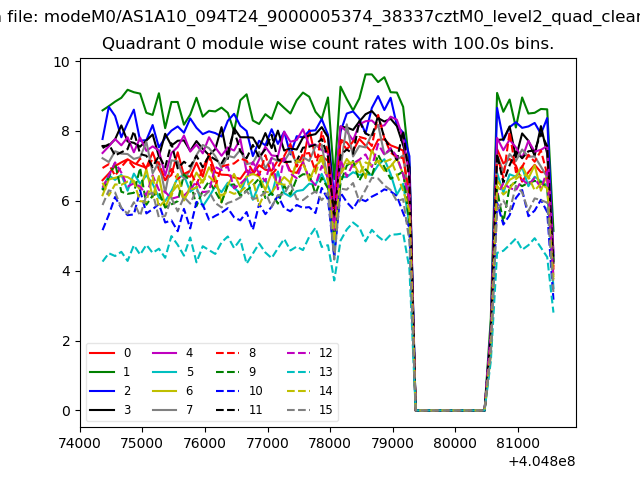 |
 |
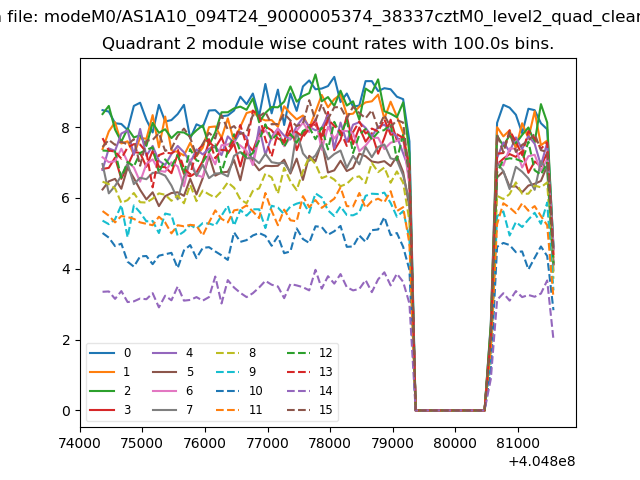
| Module-wise count rates for Quadrant B Data is divided into 100 sec bins |
 |
 |
| Module-wise count rates for Quadrant C Data is divided into 100 sec bins |
 |
 |
| Module-wise count rates for Quadrant D Data is divided into 100 sec bins |
 |
 |
| Parameter | Plot |
|---|---|
| CZT HV Monitor | 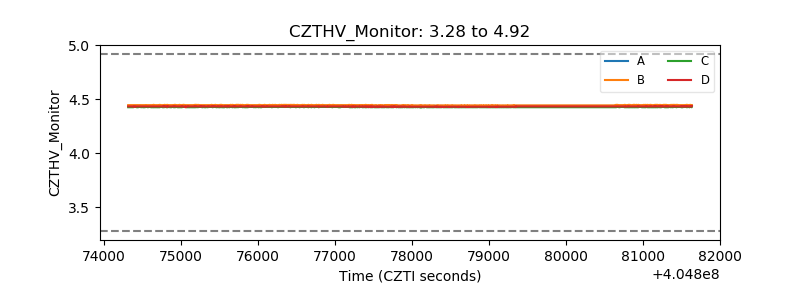 |
| D_VDD | 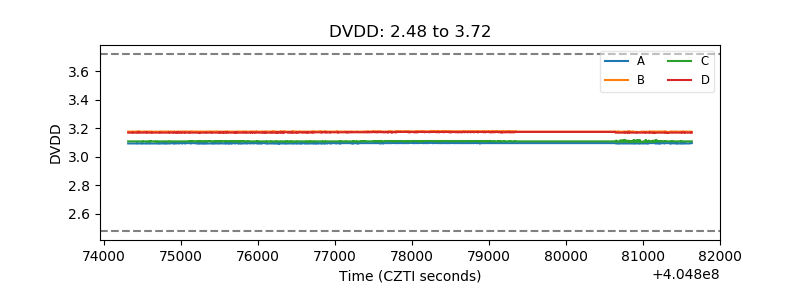 |
| Temperature 1 | 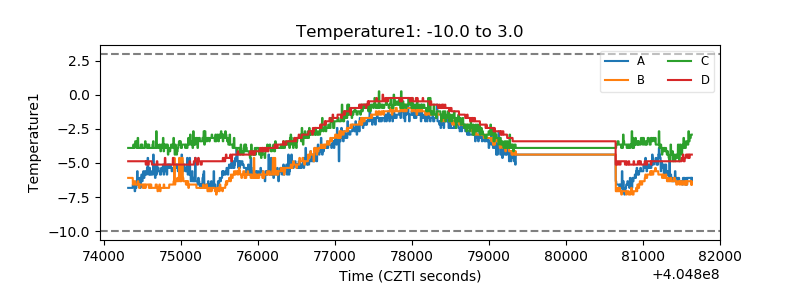 |
| Veto HV Monitor | 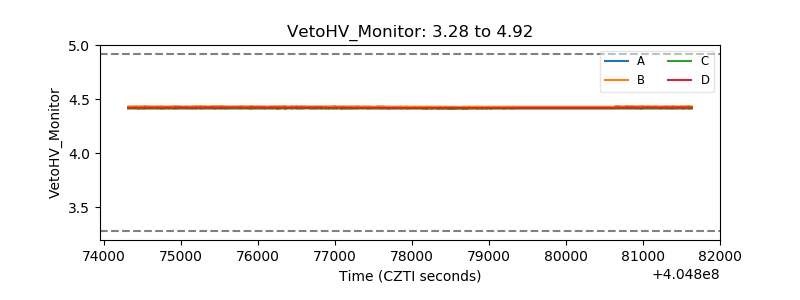 |
| Veto LLD | 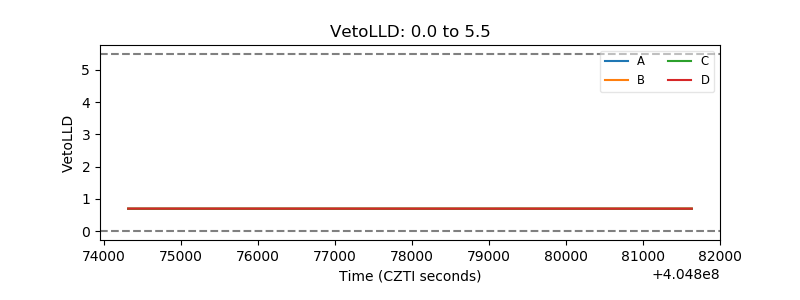 |
| Alpha Counter | 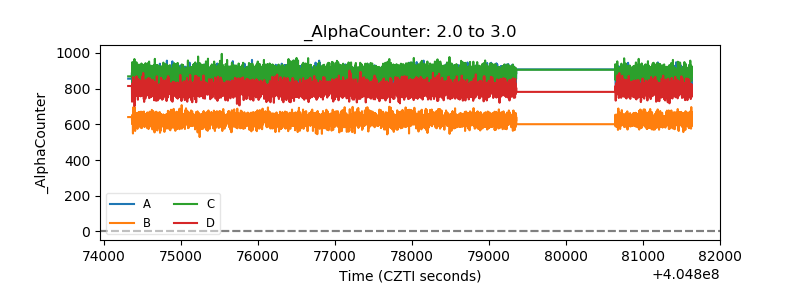 |
| _CPM_Rate | 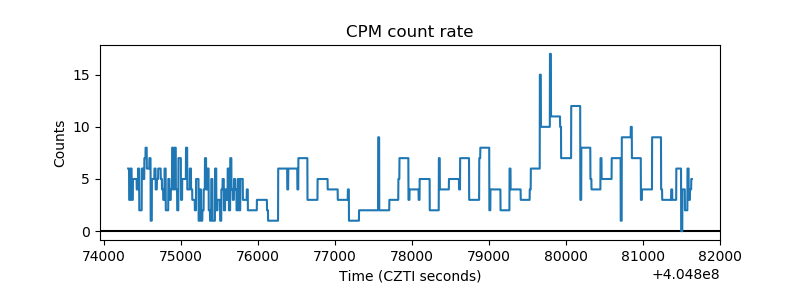 |
| CZT Counter | 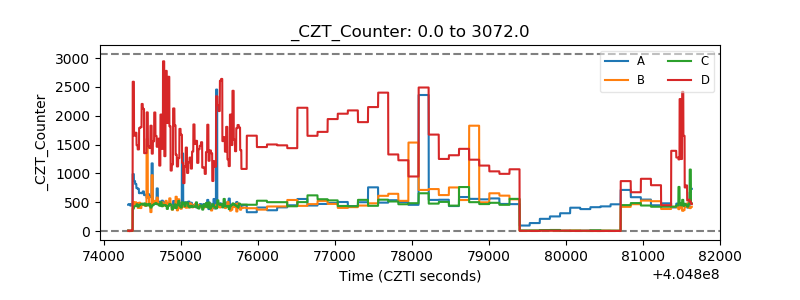 |
| +2.5 Volts monitor | 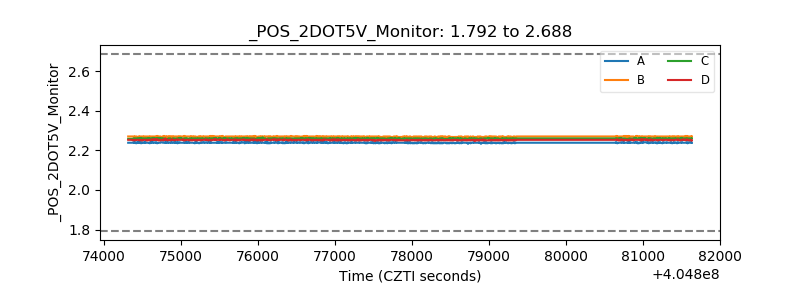 |
| +5 Volts monitor | 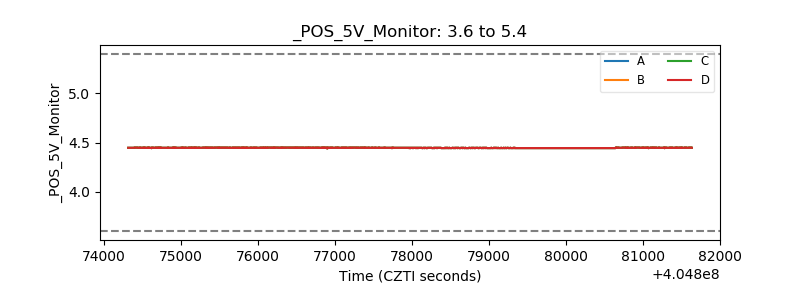 |
| _ROLL_ROT | 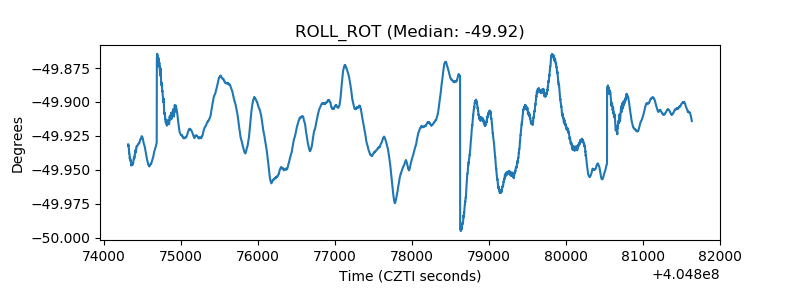 |
| _Roll_DEC | 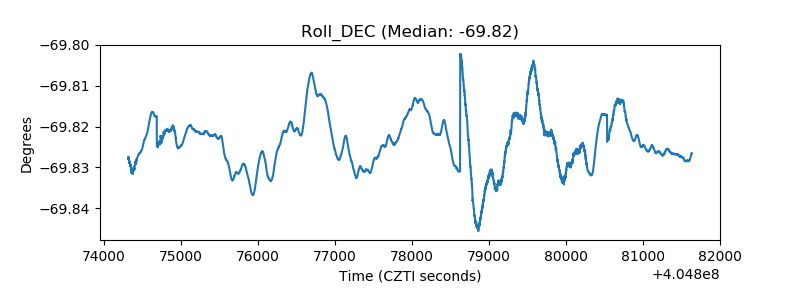 |
| _Roll_RA | 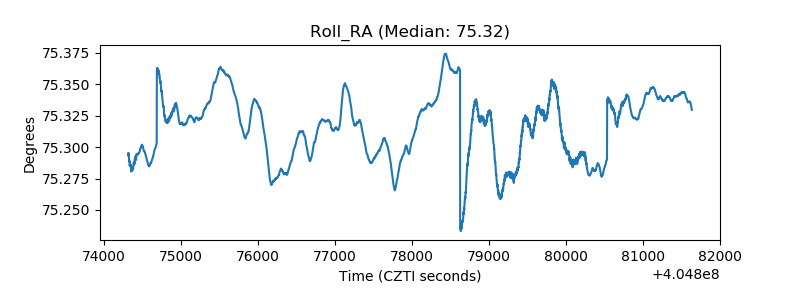 |
| Veto Counter | 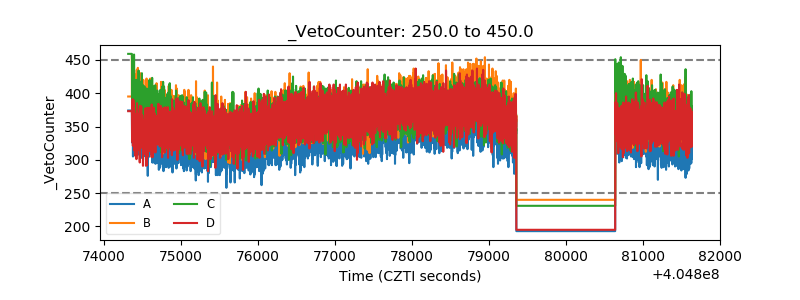 |