| Param | Original file | Final file |
|---|---|---|
| Filename | modeM0/AS1A10_094T24_9000005374_38341cztM0_level2.fits | modeM0/AS1A10_094T24_9000005374_38341cztM0_level2_quad_clean.evt |
| Size (bytes) | 745,364,160 | 158,941,440 |
| Size | 710.8 MB | 151.6 MB |
| Events in quadrant A | 5,528,739 | 1,090,731 |
| Events in quadrant B | 5,297,152 | 1,117,109 |
| Events in quadrant C | 4,745,978 | 1,092,745 |
| Events in quadrant D | 11,246,033 | 820,289 |
| Mode SS | |||
|---|---|---|---|
| Quadrant | BADHDUFLAG | Total packets | Discarded packets |
| A | 0 | 206 | 0 |
| B | 0 | 206 | 0 |
| C | 0 | 206 | 0 |
| D | 0 | 206 | 0 |
| Mode M0 | |||
|---|---|---|---|
| Quadrant | BADHDUFLAG | Total packets | Discarded packets |
| A | 0 | 22433 | 2 |
| B | 0 | 22351 | 2 |
| C | 0 | 20222 | 2 |
| D | 0 | 40281 | 2 |
| Mode M9 | |||
|---|---|---|---|
| Quadrant | BADHDUFLAG | Total packets | Discarded packets |
| A | 0 | 40 | 0 |
| B | 0 | 39 | 0 |
| C | 0 | 39 | 0 |
| D | 0 | 39 | 0 |
| Quadrant | Total seconds | Saturated seconds | Saturation percentage |
|---|---|---|---|
| A | 9973 | 96 | 0.962599% |
| B | 9973 | 113 | 1.133059% |
| C | 9973 | 17 | 0.170460% |
| D | 9973 | 1993 | 19.983957% |
Noise dominated data is calculated using 1-second bins in cleaned event files. If a bin has >2000 counts, and if more than 50% of those come from <1% of pixels, then it is considered to be noise-dominated and hence unusable.
| Quadrant | # 1 sec bins | Bins with >0 counts | Bins with >2000 counts | High rate bins dominated by noise | Noise dominated (total time) | Noise dominated (detector-on time) | Marked lightcurve |
|---|---|---|---|---|---|---|---|
| A | 12569 | 9975 | 66 | 66 | 0.53% | 0.66% | 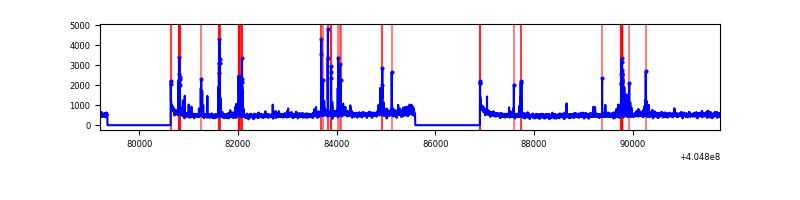 |
| B | 12569 | 9975 | 72 | 72 | 0.57% | 0.72% | 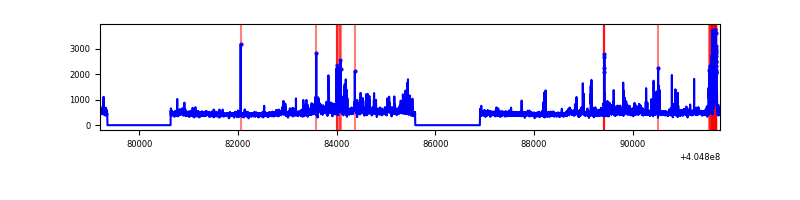 |
| C | 12569 | 9975 | 6 | 6 | 0.05% | 0.06% | 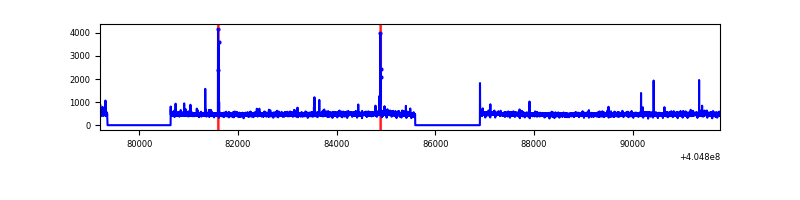 |
| D | 12569 | 9975 | 1941 | 1941 | 15.44% | 19.46% | 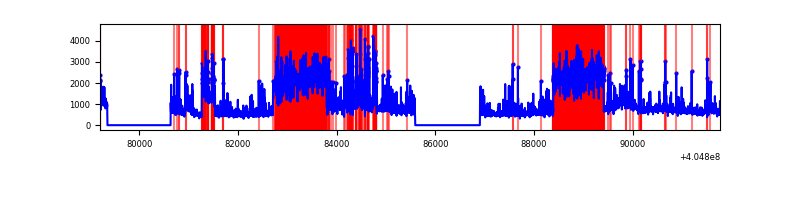 |
Top three noisy pixels from each quadrant. If the there are fewer than three noisy pixels in the level2.evt file, extra rows are filled as -1
| Pixel properties | Quadrant properties | ||||||
|---|---|---|---|---|---|---|---|
| Quadrant | DetID | PixID | Counts | Sigma | Mean | Median | Sigma |
| A | 10 | 83 | 646007 | 2895.68 | 1104 | 1081 | 222.7 |
| A | 13 | 248 | 348923 | 1561.79 | 1104 | 1081 | 222.7 |
| A | 12 | 189 | 175698 | 784.02 | 1104 | 1081 | 222.7 |
| B | 0 | 183 | 303780 | 1435.05 | 1102 | 1072 | 210.9 |
| B | 5 | 184 | 236122 | 1114.3 | 1102 | 1072 | 210.9 |
| B | 0 | 229 | 129306 | 607.92 | 1102 | 1072 | 210.9 |
| C | 15 | 214 | 419370 | 1655.66 | 1086 | 1092 | 252.6 |
| C | 1 | 23 | 43823 | 169.14 | 1086 | 1092 | 252.6 |
| C | 14 | 254 | 34179 | 130.97 | 1086 | 1092 | 252.6 |
| D | 10 | 203 | 5313063 | 20887.36 | 1031 | 1002 | 254.3 |
| D | 12 | 227 | 370147 | 1451.5 | 1031 | 1002 | 254.3 |
| D | 7 | 223 | 298147 | 1168.39 | 1031 | 1002 | 254.3 |
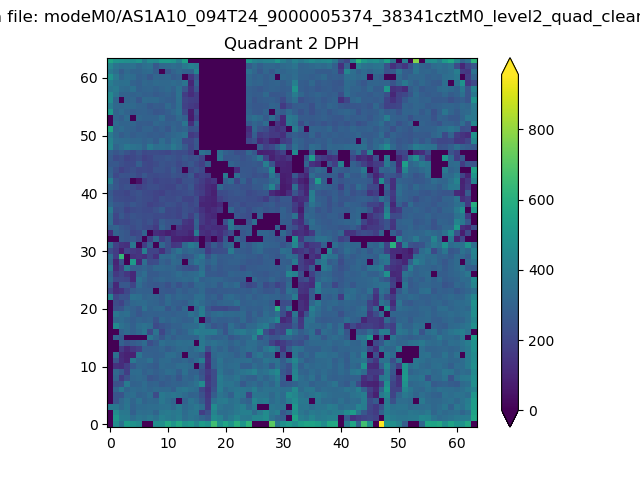
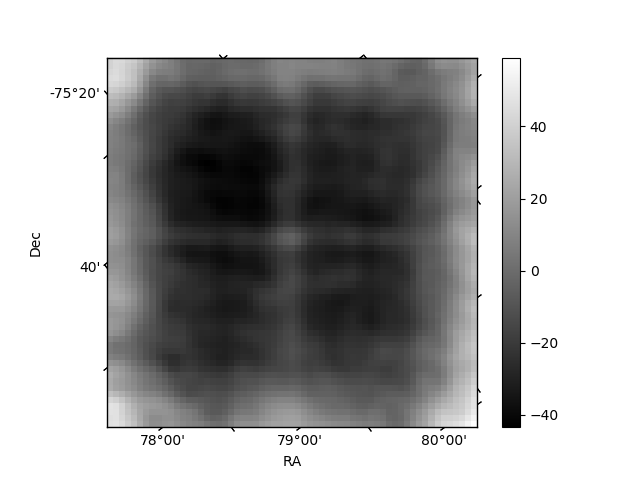
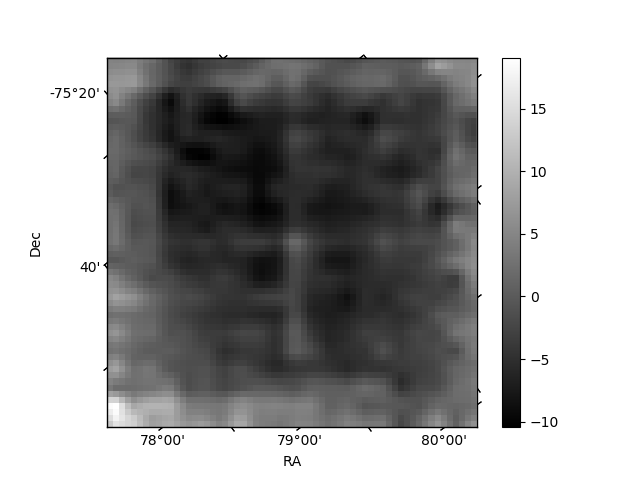
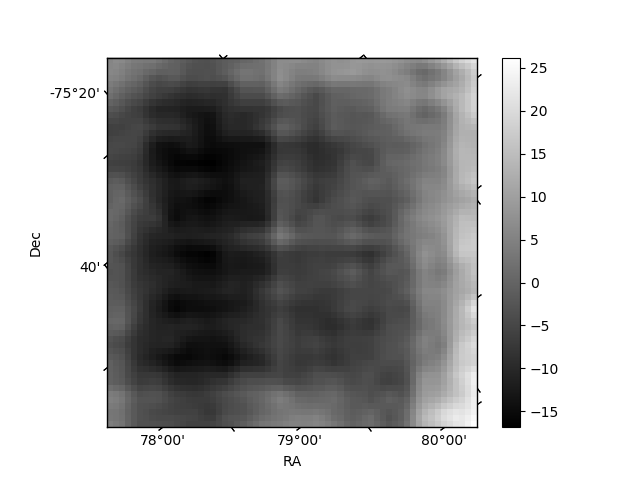
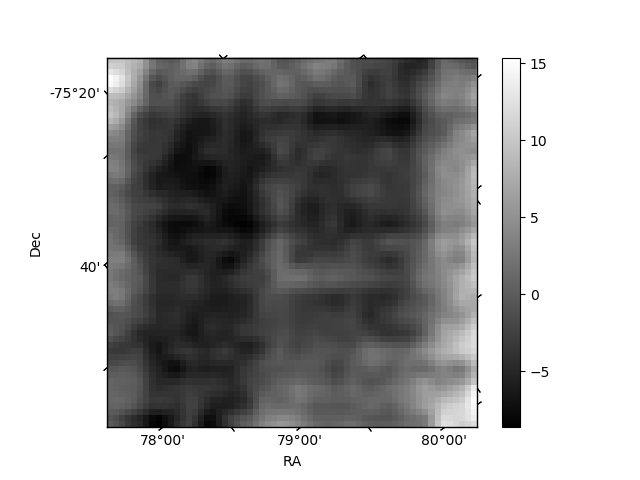
Histogram calculated using DETX and DETY for each event in the final _common_clean file
| Quadrant A | 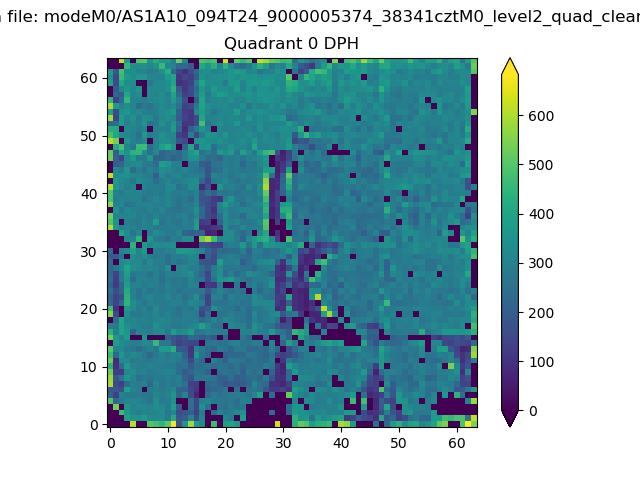 |
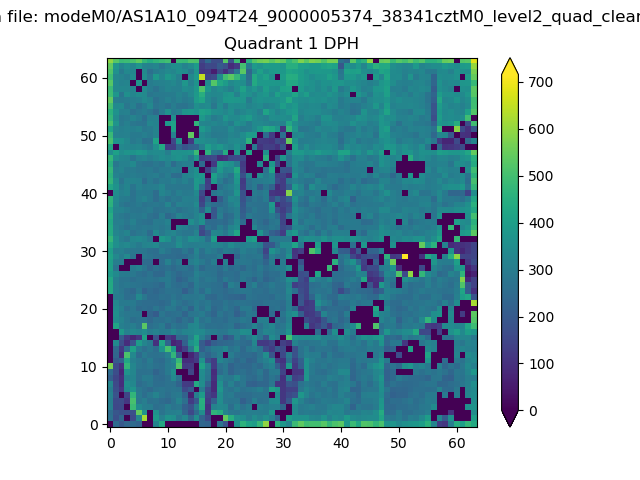 |
Quadrant B |
|---|---|---|---|
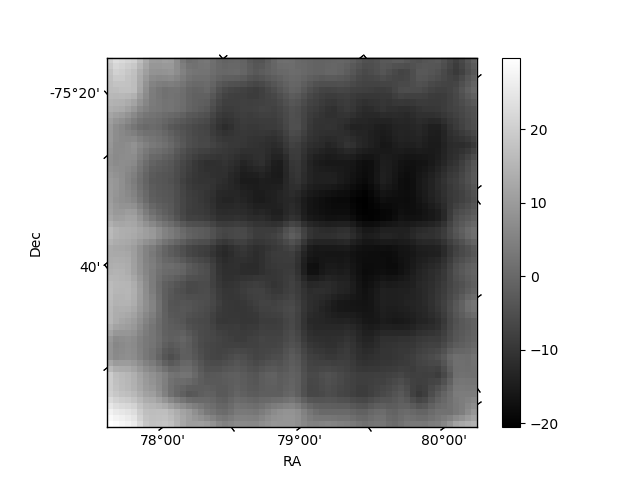
| Quadrant D | 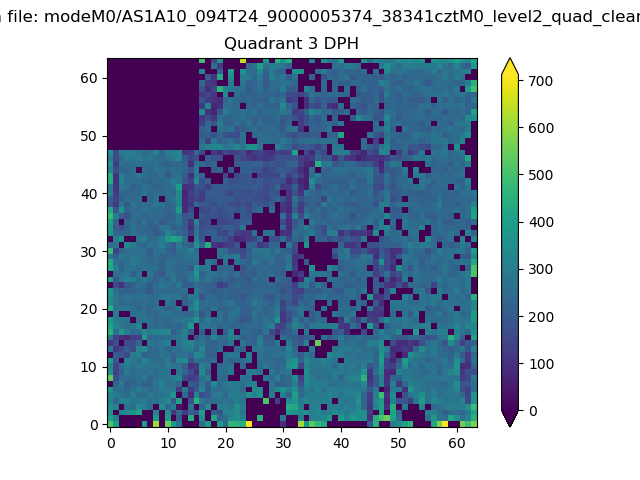 |
 |
Quadrant C |
| Plot type | Count rate plots | Images |
|---|---|---|
| Comparison with Poisson distribution Blue bars denote a histogram of data divided into 1 sec bins. Red curve is a Poisson curve with rate = median count rate of data. |
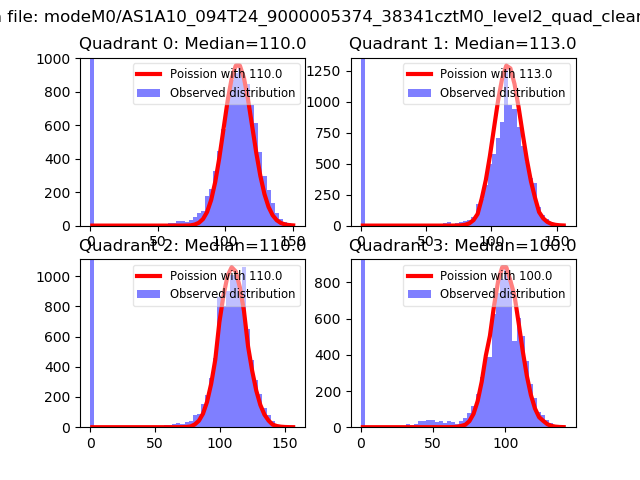 |
 |
| Quadrant-wise count rates Data is divided into 100 sec bins |
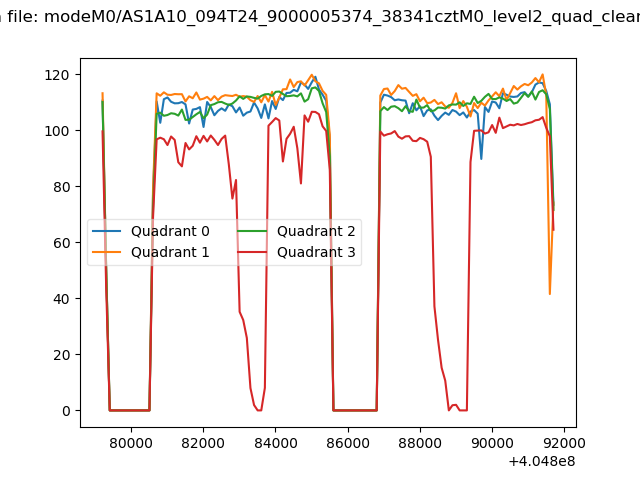 |
|
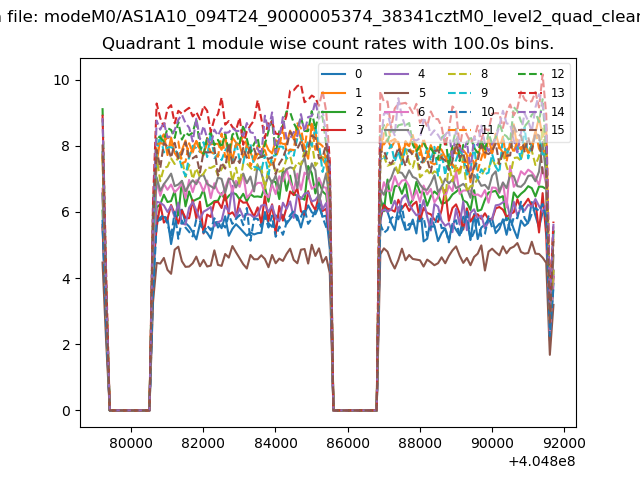
| Module-wise count rates for Quadrant A Data is divided into 100 sec bins |
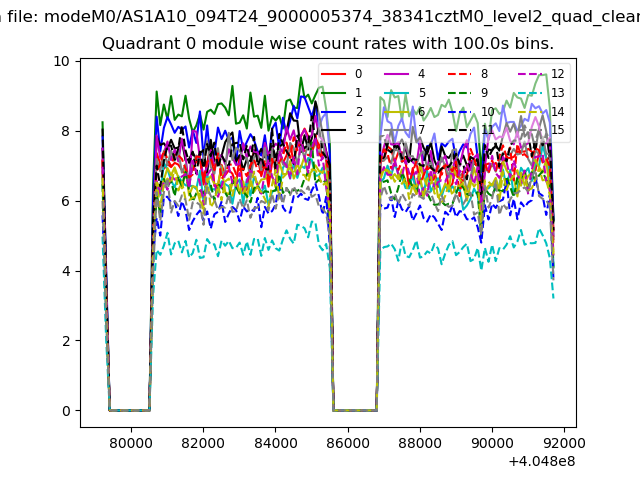 |
 |
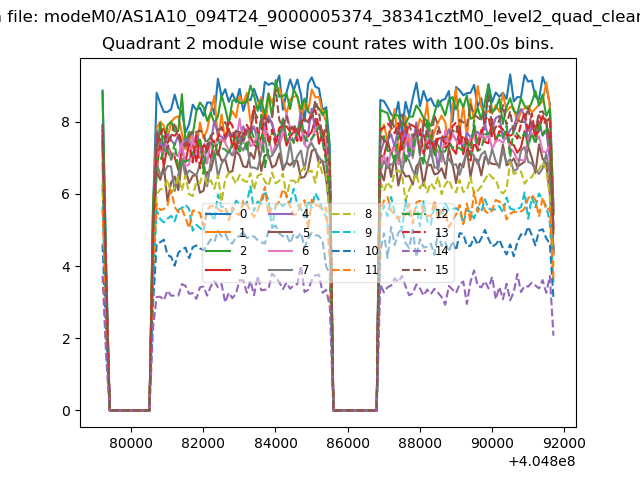
| Module-wise count rates for Quadrant B Data is divided into 100 sec bins |
 |
 |
| Module-wise count rates for Quadrant C Data is divided into 100 sec bins |
 |
 |
| Module-wise count rates for Quadrant D Data is divided into 100 sec bins |
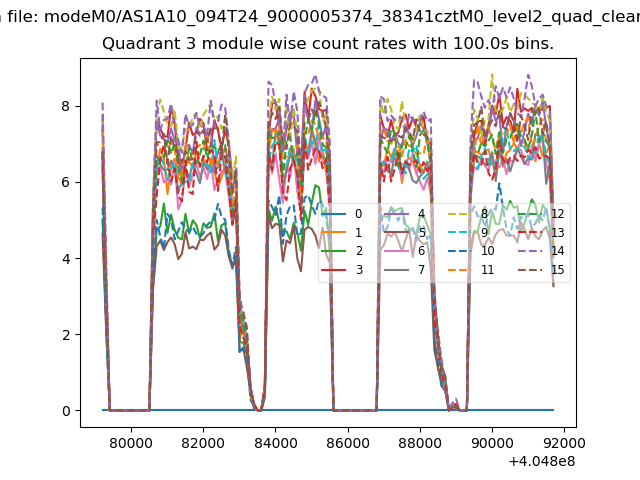 |
 |
| Parameter | Plot |
|---|---|
| CZT HV Monitor | 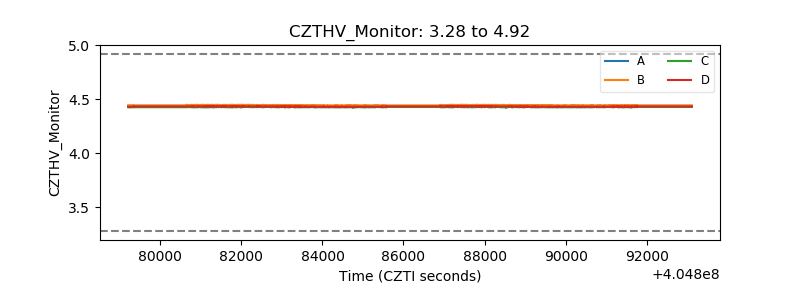 |
| D_VDD | 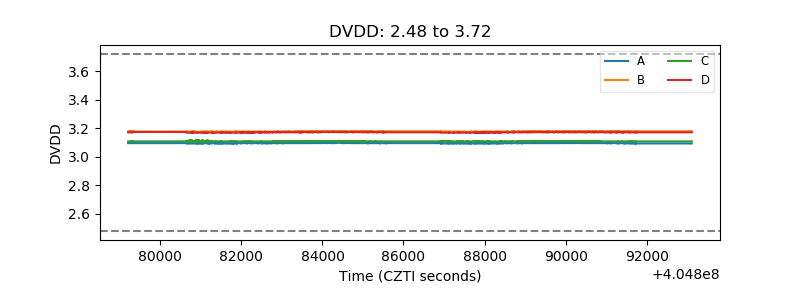 |
| Temperature 1 | 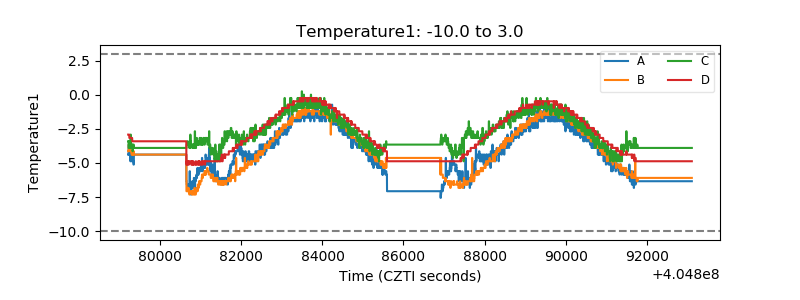 |
| Veto HV Monitor | 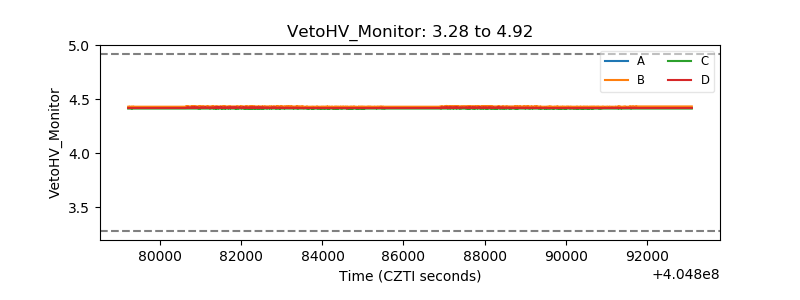 |
| Veto LLD | 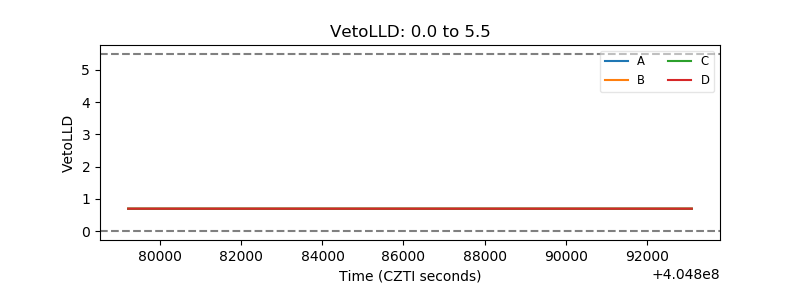 |
| Alpha Counter | 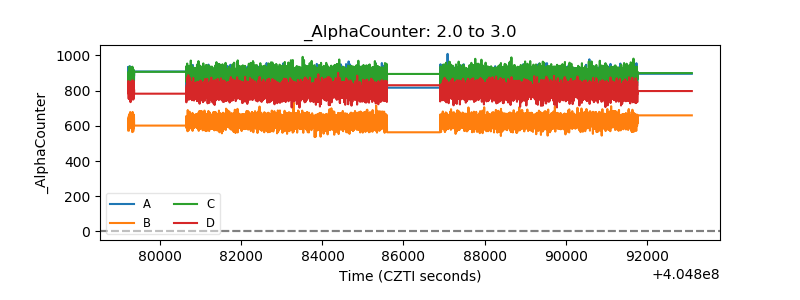 |
| _CPM_Rate | 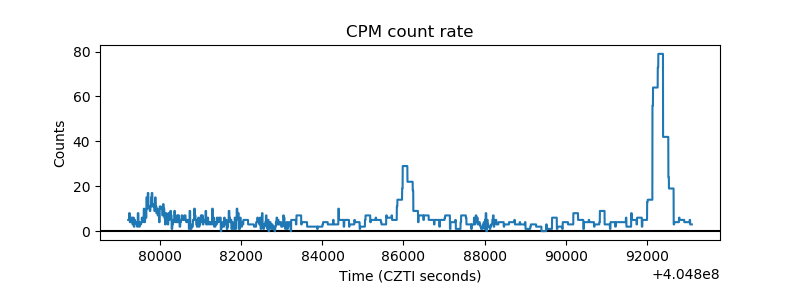 |
| CZT Counter | 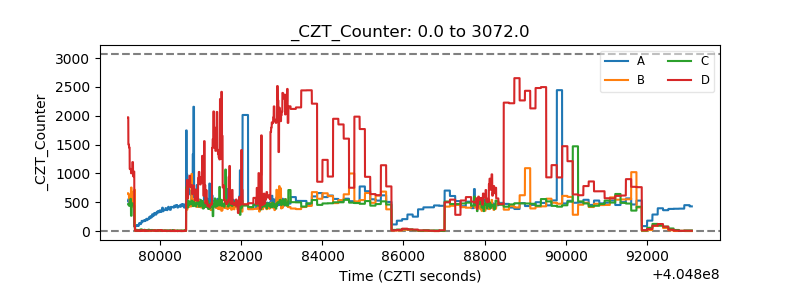 |
| +2.5 Volts monitor | 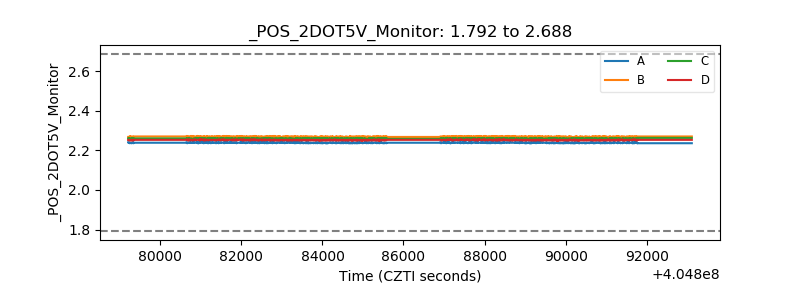 |
| +5 Volts monitor | 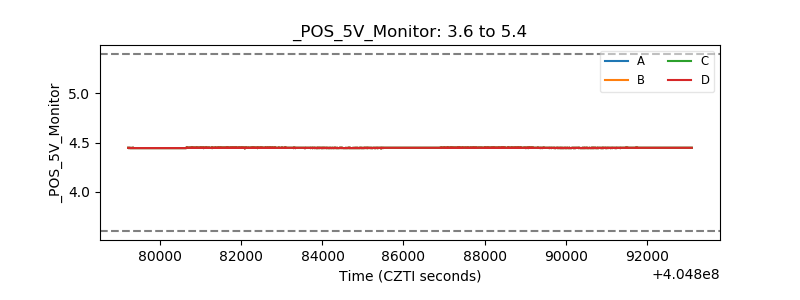 |
| _ROLL_ROT | 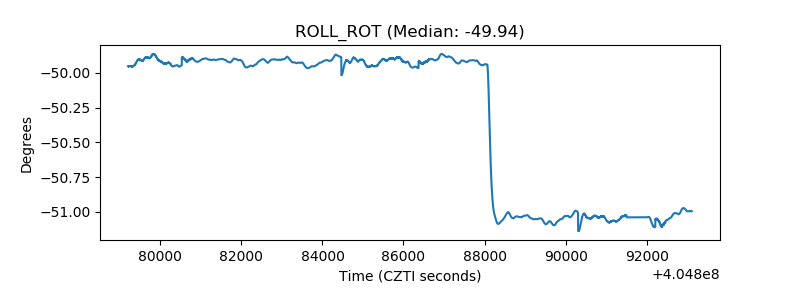 |
| _Roll_DEC | 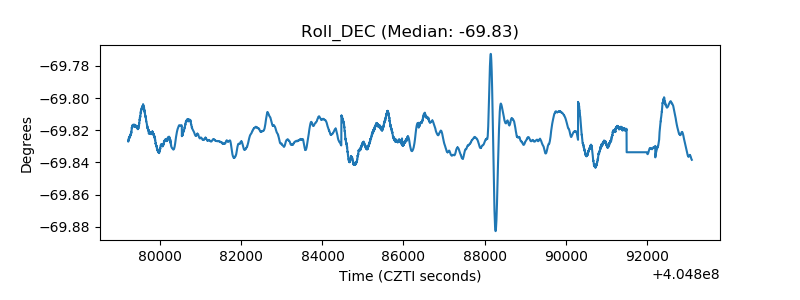 |
| _Roll_RA | 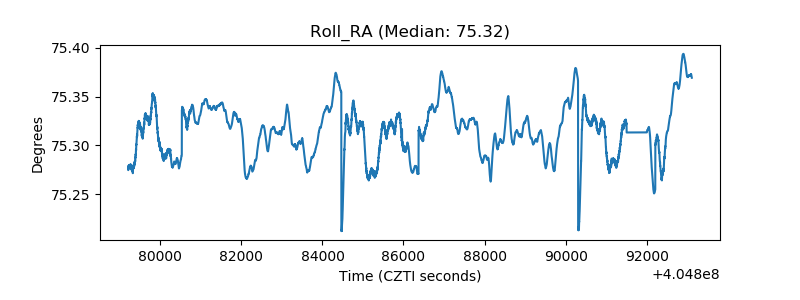 |
| Veto Counter | 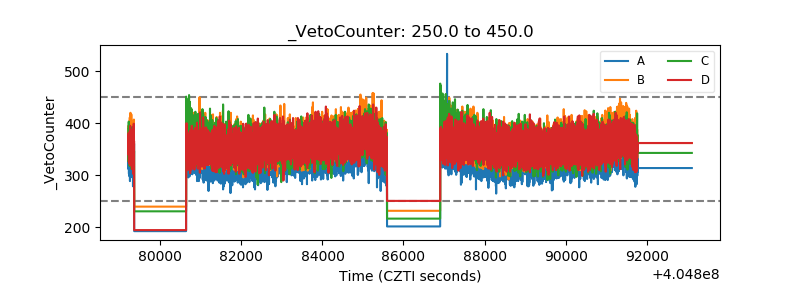 |