| Param | Original file | Final file |
|---|---|---|
| Filename | modeM0/AS1A10_094T24_9000005374_38343cztM0_level2.fits | modeM0/AS1A10_094T24_9000005374_38343cztM0_level2_quad_clean.evt |
| Size (bytes) | 1,091,067,840 | 249,436,800 |
| Size | 1.0 GB | 237.9 MB |
| Events in quadrant A | 8,325,729 | 1,680,206 |
| Events in quadrant B | 8,220,344 | 1,722,352 |
| Events in quadrant C | 7,283,461 | 1,692,180 |
| Events in quadrant D | 15,394,109 | 1,417,533 |
| Mode SS | |||
|---|---|---|---|
| Quadrant | BADHDUFLAG | Total packets | Discarded packets |
| A | 0 | 310 | 0 |
| B | 0 | 310 | 0 |
| C | 0 | 310 | 0 |
| D | 0 | 310 | 0 |
| Mode M0 | |||
|---|---|---|---|
| Quadrant | BADHDUFLAG | Total packets | Discarded packets |
| A | 0 | 33711 | 5 |
| B | 0 | 34294 | 4 |
| C | 0 | 30995 | 4 |
| D | 0 | 56388 | 4 |
| Mode M9 | |||
|---|---|---|---|
| Quadrant | BADHDUFLAG | Total packets | Discarded packets |
| A | 0 | 51 | 0 |
| B | 0 | 51 | 0 |
| C | 0 | 51 | 0 |
| D | 0 | 52 | 0 |
| Quadrant | Total seconds | Saturated seconds | Saturation percentage |
|---|---|---|---|
| A | 15060 | 173 | 1.148738% |
| B | 15060 | 178 | 1.181939% |
| C | 15060 | 26 | 0.172643% |
| D | 15060 | 1464 | 9.721116% |
Noise dominated data is calculated using 1-second bins in cleaned event files. If a bin has >2000 counts, and if more than 50% of those come from <1% of pixels, then it is considered to be noise-dominated and hence unusable.
| Quadrant | # 1 sec bins | Bins with >0 counts | Bins with >2000 counts | High rate bins dominated by noise | Noise dominated (total time) | Noise dominated (detector-on time) | Marked lightcurve |
|---|---|---|---|---|---|---|---|
| A | 19988 | 15063 | 107 | 107 | 0.54% | 0.71% | 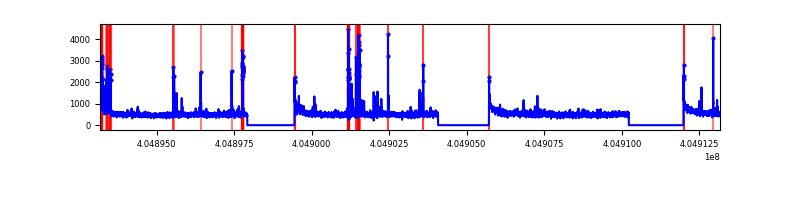 |
| B | 19988 | 15063 | 113 | 113 | 0.57% | 0.75% | 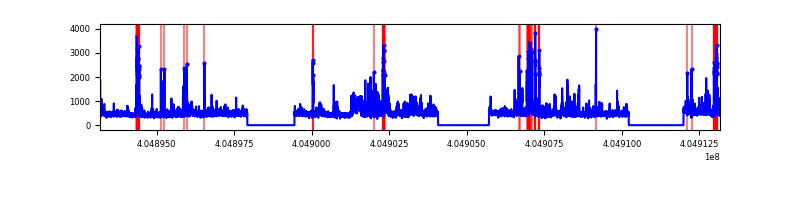 |
| C | 19988 | 15063 | 12 | 12 | 0.06% | 0.08% | 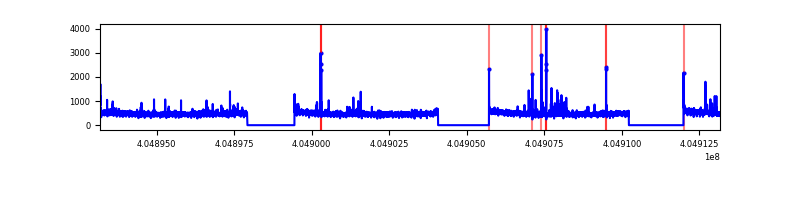 |
| D | 19988 | 15063 | 1492 | 1492 | 7.46% | 9.91% | 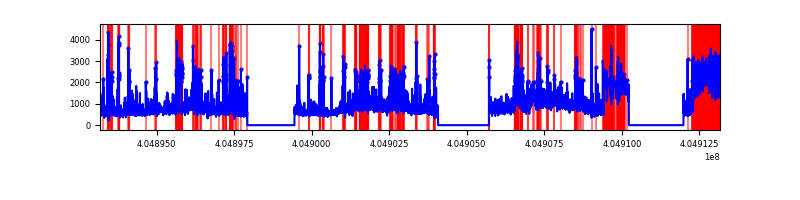 |
Top three noisy pixels from each quadrant. If the there are fewer than three noisy pixels in the level2.evt file, extra rows are filled as -1
| Pixel properties | Quadrant properties | ||||||
|---|---|---|---|---|---|---|---|
| Quadrant | DetID | PixID | Counts | Sigma | Mean | Median | Sigma |
| A | 10 | 83 | 1062532 | 3176.64 | 1676 | 1644 | 334.0 |
| A | 13 | 248 | 512023 | 1528.24 | 1676 | 1644 | 334.0 |
| A | 12 | 189 | 142196 | 420.86 | 1676 | 1644 | 334.0 |
| B | 0 | 183 | 627278 | 1994.77 | 1670 | 1626 | 313.6 |
| B | 0 | 229 | 232692 | 736.71 | 1670 | 1626 | 313.6 |
| B | 0 | 186 | 150527 | 474.74 | 1670 | 1626 | 313.6 |
| C | 15 | 214 | 638774 | 1682.41 | 1645 | 1652 | 378.7 |
| C | 14 | 254 | 101659 | 264.08 | 1645 | 1652 | 378.7 |
| C | 1 | 23 | 50868 | 129.96 | 1645 | 1652 | 378.7 |
| D | 10 | 203 | 5276333 | 13620.23 | 1596 | 1553 | 387.3 |
| D | 12 | 235 | 1380300 | 3560.12 | 1596 | 1553 | 387.3 |
| D | 2 | 250 | 638915 | 1645.76 | 1596 | 1553 | 387.3 |
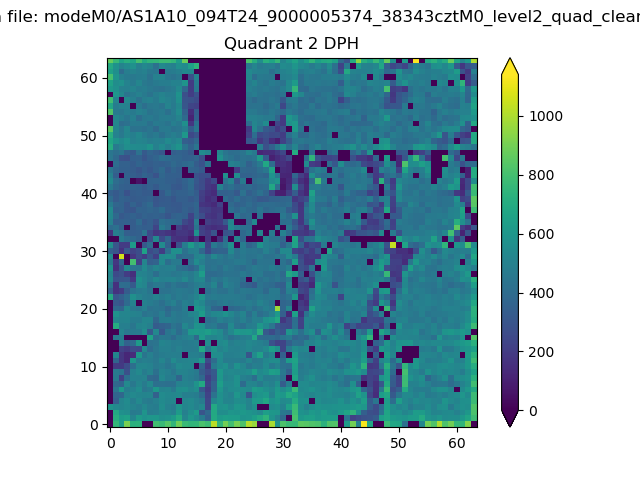
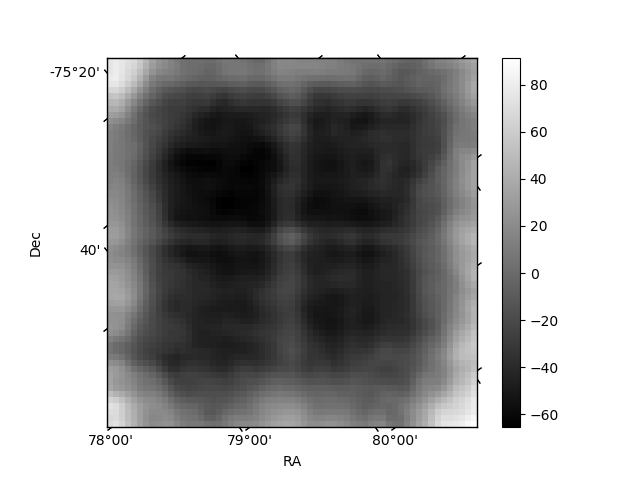
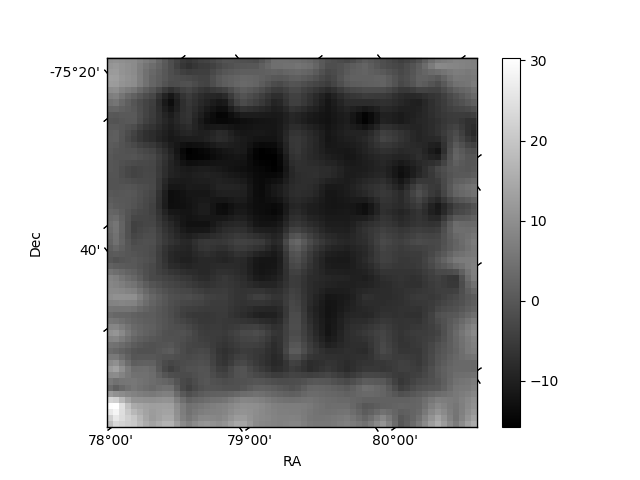
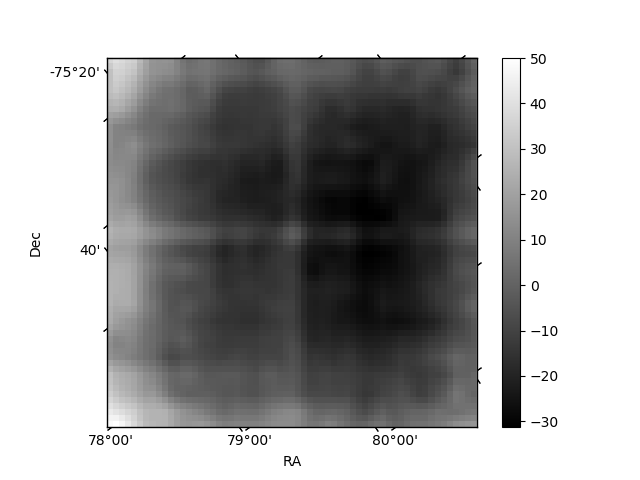
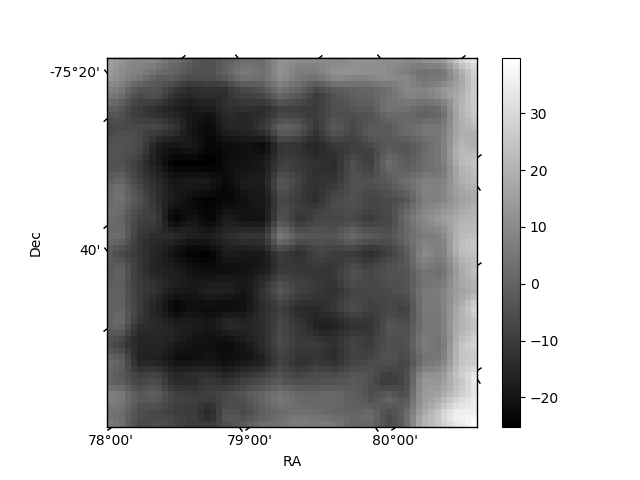
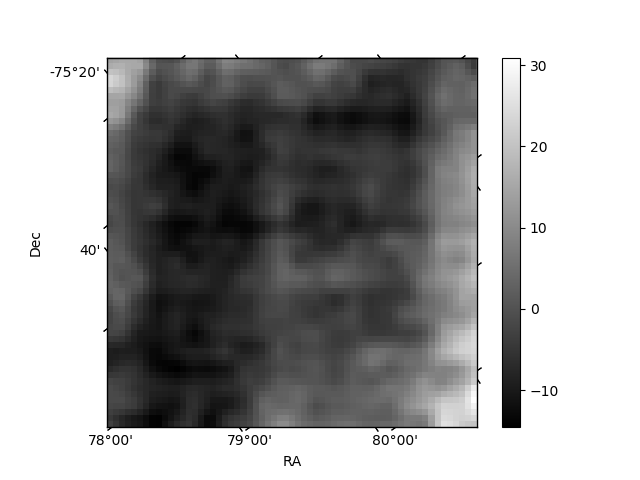
Histogram calculated using DETX and DETY for each event in the final _common_clean file
| Quadrant A | 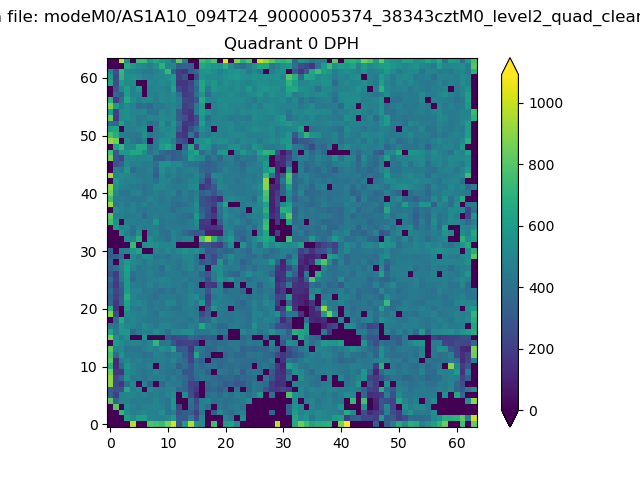 |
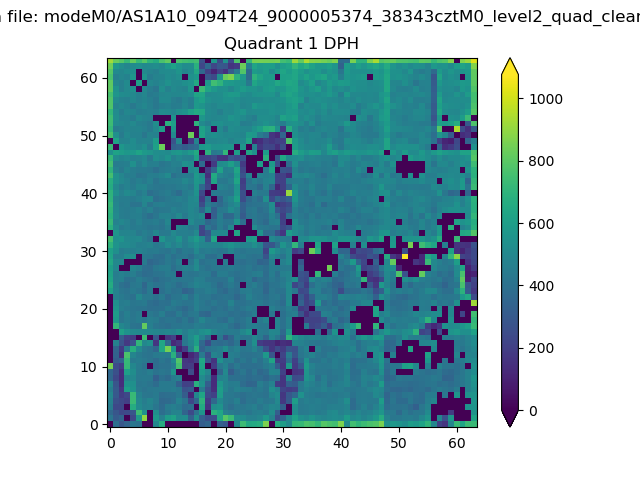 |
Quadrant B |
|---|---|---|---|
| Quadrant D | 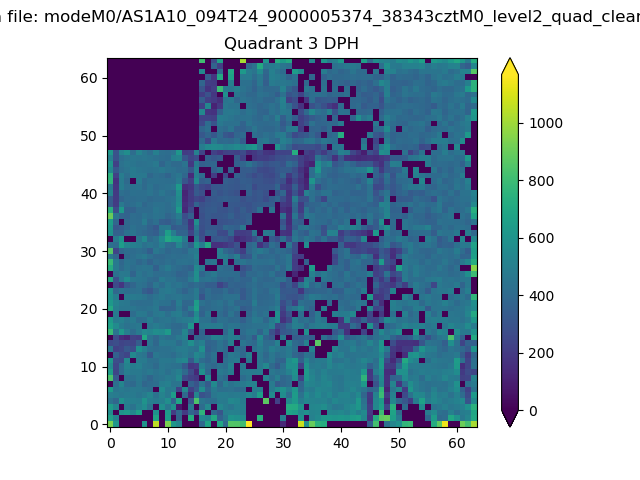 |
 |
Quadrant C |
| Plot type | Count rate plots | Images |
|---|---|---|
| Comparison with Poisson distribution Blue bars denote a histogram of data divided into 1 sec bins. Red curve is a Poisson curve with rate = median count rate of data. |
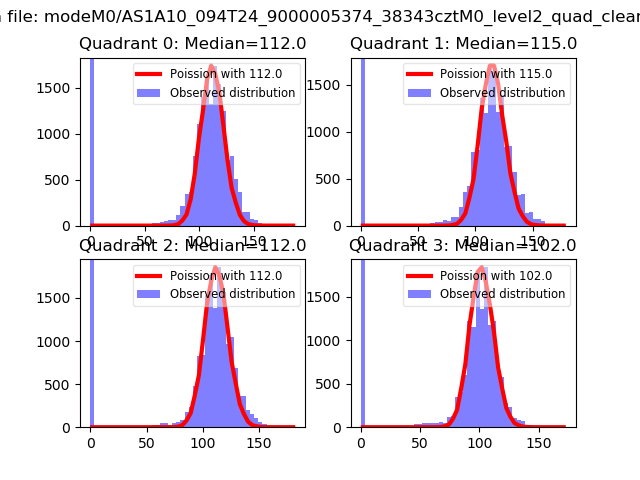 |
 |
| Quadrant-wise count rates Data is divided into 100 sec bins |
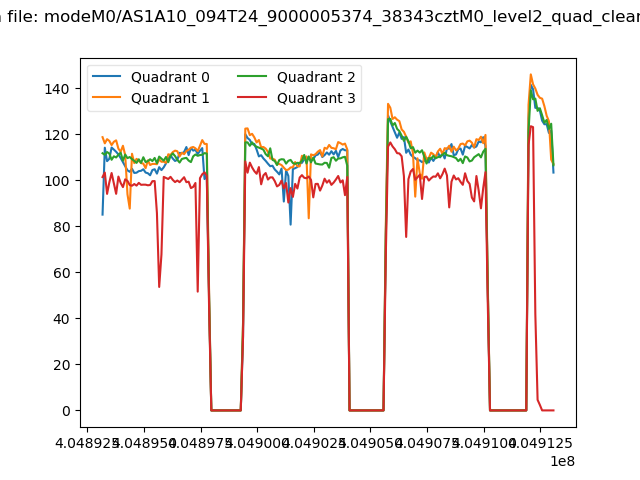 |
|
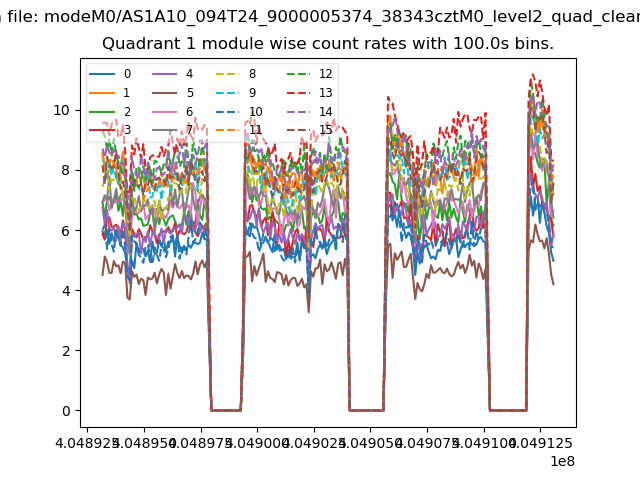
| Module-wise count rates for Quadrant A Data is divided into 100 sec bins |
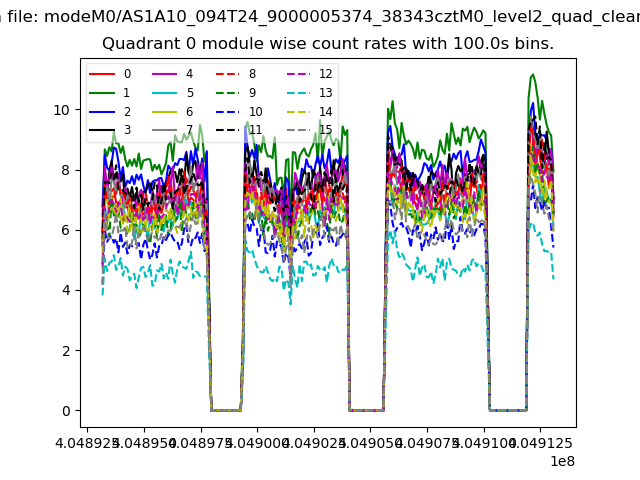 |
 |
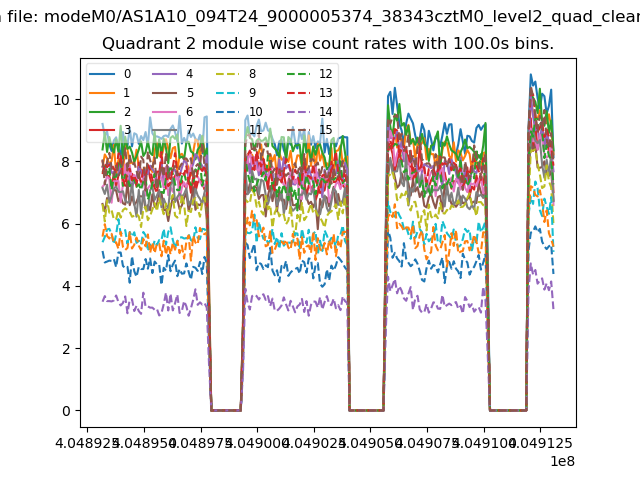
| Module-wise count rates for Quadrant B Data is divided into 100 sec bins |
 |
 |
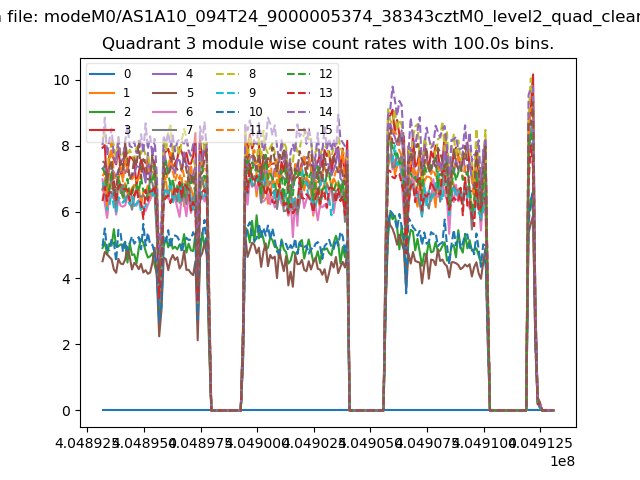
| Module-wise count rates for Quadrant C Data is divided into 100 sec bins |
 |
 |
| Module-wise count rates for Quadrant D Data is divided into 100 sec bins |
 |
 |
| Parameter | Plot |
|---|---|
| CZT HV Monitor | 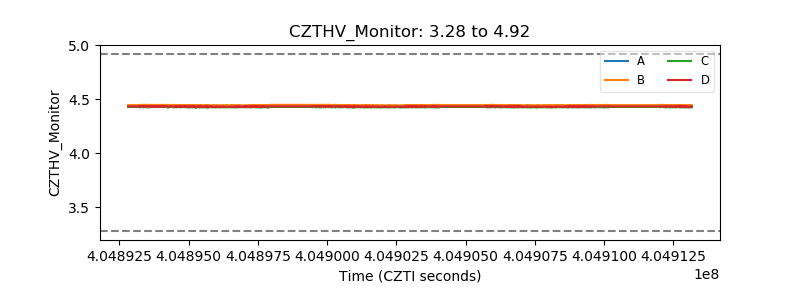 |
| D_VDD | 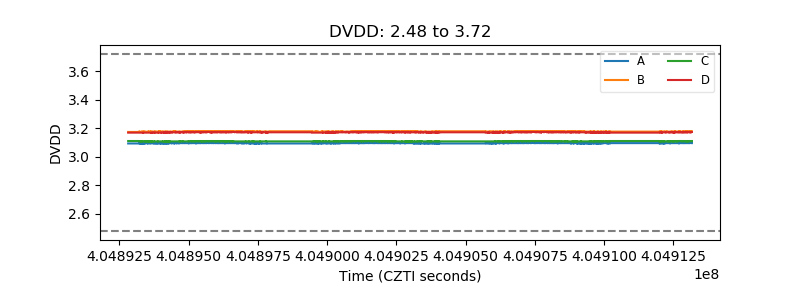 |
| Temperature 1 | 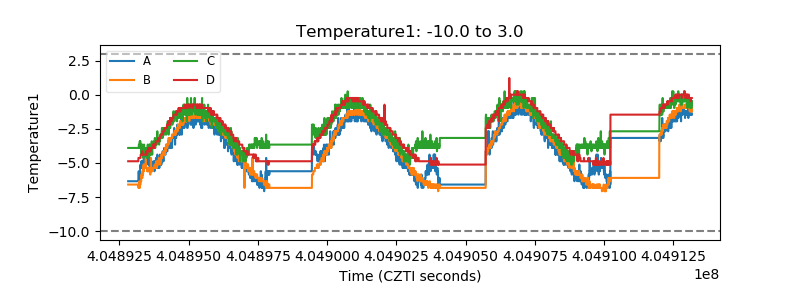 |
| Veto HV Monitor | 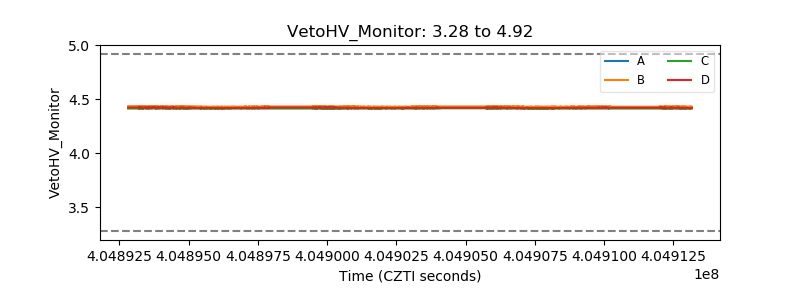 |
| Veto LLD | 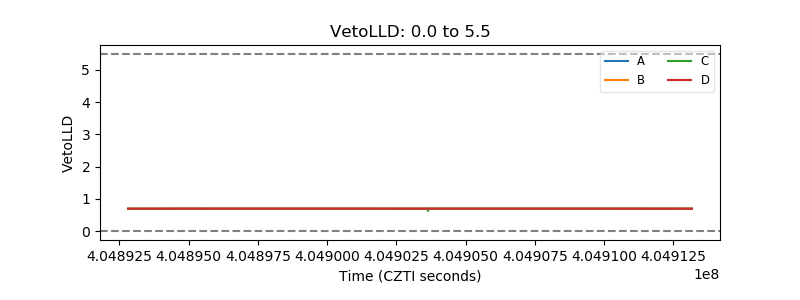 |
| Alpha Counter | 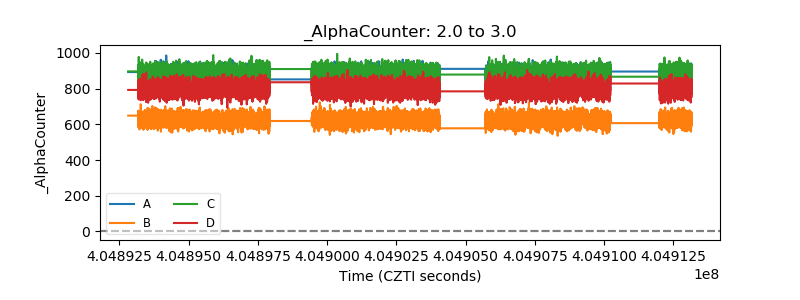 |
| _CPM_Rate | 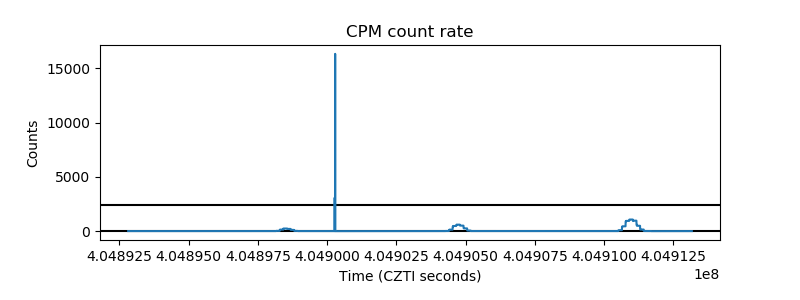 |
| CZT Counter | 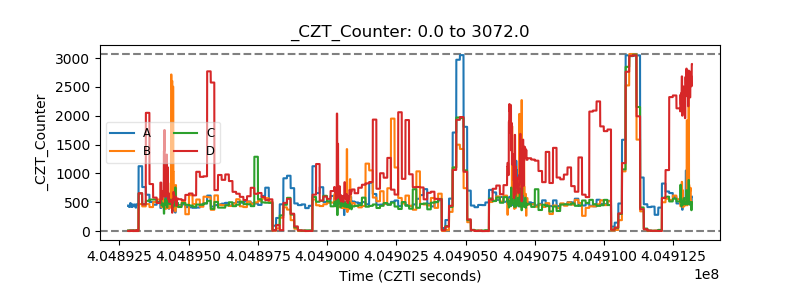 |
| +2.5 Volts monitor | 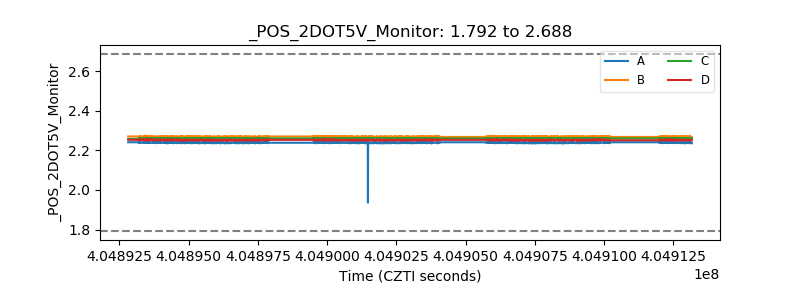 |
| +5 Volts monitor | 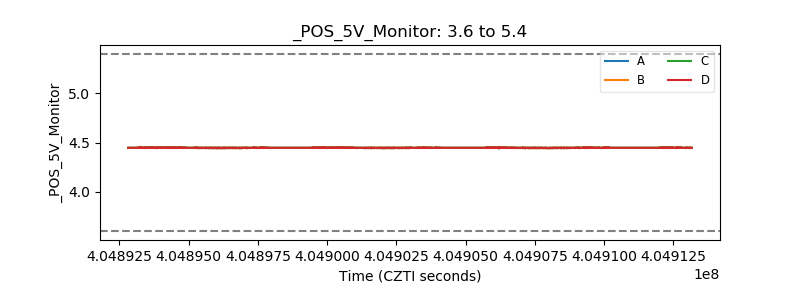 |
| _ROLL_ROT | 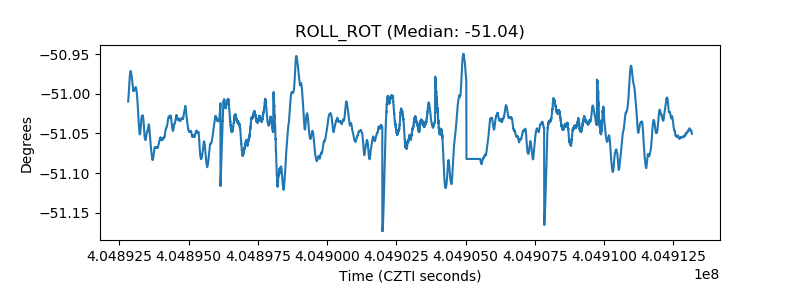 |
| _Roll_DEC | 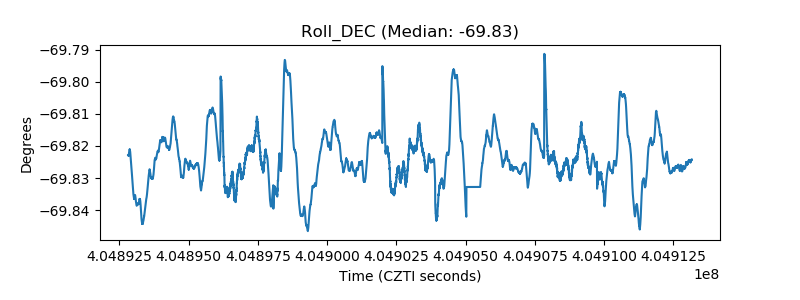 |
| _Roll_RA | 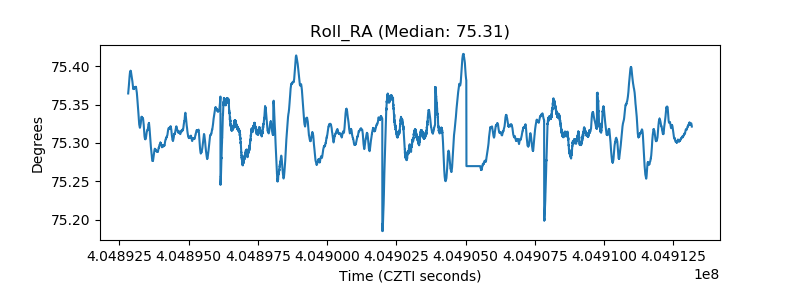 |
| Veto Counter | 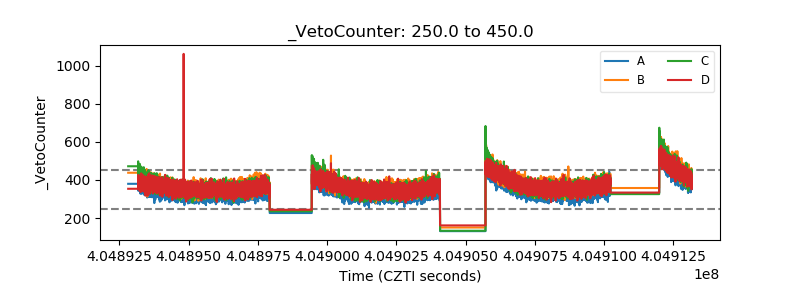 |