| Param | Original file | Final file |
|---|---|---|
| Filename | modeM0/AS1A10_094T24_9000005374_38344cztM0_level2.fits | modeM0/AS1A10_094T24_9000005374_38344cztM0_level2_quad_clean.evt |
| Size (bytes) | 406,869,120 | 84,833,280 |
| Size | 388.0 MB | 80.9 MB |
| Events in quadrant A | 2,812,734 | 614,350 |
| Events in quadrant B | 2,763,119 | 629,742 |
| Events in quadrant C | 2,458,029 | 604,528 |
| Events in quadrant D | 6,639,861 | 371,610 |
| Mode SS | |||
|---|---|---|---|
| Quadrant | BADHDUFLAG | Total packets | Discarded packets |
| A | 0 | 102 | 0 |
| B | 0 | 102 | 0 |
| C | 0 | 102 | 0 |
| D | 0 | 102 | 0 |
| Mode M0 | |||
|---|---|---|---|
| Quadrant | BADHDUFLAG | Total packets | Discarded packets |
| A | 0 | 11301 | 2 |
| B | 0 | 11440 | 1 |
| C | 0 | 10358 | 1 |
| D | 0 | 23129 | 1 |
| Mode M9 | |||
|---|---|---|---|
| Quadrant | BADHDUFLAG | Total packets | Discarded packets |
| A | 0 | 19 | 0 |
| B | 0 | 19 | 0 |
| C | 0 | 19 | 0 |
| D | 0 | 19 | 0 |
| Quadrant | Total seconds | Saturated seconds | Saturation percentage |
|---|---|---|---|
| A | 4970 | 52 | 1.046278% |
| B | 4970 | 43 | 0.865191% |
| C | 4970 | 6 | 0.120724% |
| D | 4970 | 1680 | 33.802817% |
Noise dominated data is calculated using 1-second bins in cleaned event files. If a bin has >2000 counts, and if more than 50% of those come from <1% of pixels, then it is considered to be noise-dominated and hence unusable.
| Quadrant | # 1 sec bins | Bins with >0 counts | Bins with >2000 counts | High rate bins dominated by noise | Noise dominated (total time) | Noise dominated (detector-on time) | Marked lightcurve |
|---|---|---|---|---|---|---|---|
| A | 6883 | 4971 | 41 | 41 | 0.60% | 0.82% | 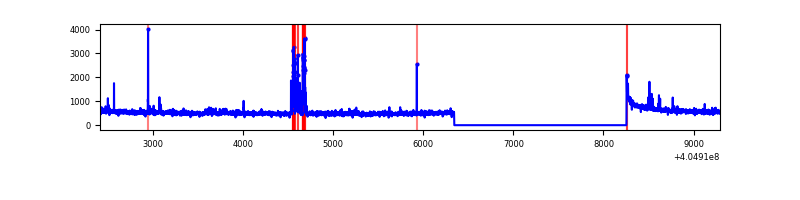 |
| B | 6883 | 4971 | 27 | 27 | 0.39% | 0.54% | 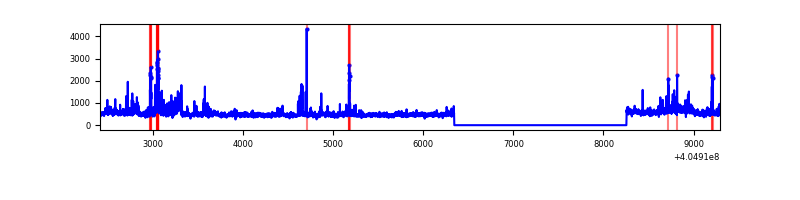 |
| C | 6883 | 4971 | 2 | 2 | 0.03% | 0.04% | 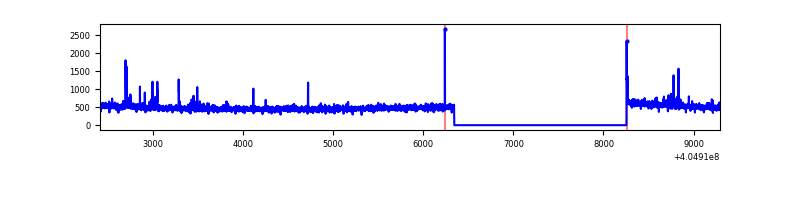 |
| D | 6883 | 4971 | 1567 | 1567 | 22.77% | 31.52% | 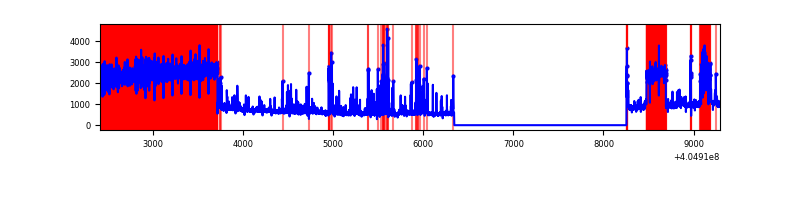 |
Top three noisy pixels from each quadrant. If the there are fewer than three noisy pixels in the level2.evt file, extra rows are filled as -1
| Pixel properties | Quadrant properties | ||||||
|---|---|---|---|---|---|---|---|
| Quadrant | DetID | PixID | Counts | Sigma | Mean | Median | Sigma |
| A | 10 | 83 | 343839 | 2987.37 | 577 | 565 | 114.9 |
| A | 13 | 248 | 172780 | 1498.71 | 577 | 565 | 114.9 |
| A | 12 | 189 | 44227 | 379.97 | 577 | 565 | 114.9 |
| B | 0 | 186 | 103363 | 952.78 | 575 | 561 | 107.9 |
| B | 0 | 183 | 100653 | 927.66 | 575 | 561 | 107.9 |
| B | 0 | 155 | 79849 | 734.85 | 575 | 561 | 107.9 |
| C | 15 | 214 | 210601 | 1640.43 | 557 | 560 | 128.0 |
| C | 14 | 254 | 48205 | 372.11 | 557 | 560 | 128.0 |
| C | 0 | 10 | 9572 | 70.38 | 557 | 560 | 128.0 |
| D | 10 | 203 | 3894004 | 32557.31 | 488 | 473 | 119.6 |
| D | 12 | 227 | 242963 | 2027.68 | 488 | 473 | 119.6 |
| D | 2 | 16 | 200627 | 1673.67 | 488 | 473 | 119.6 |
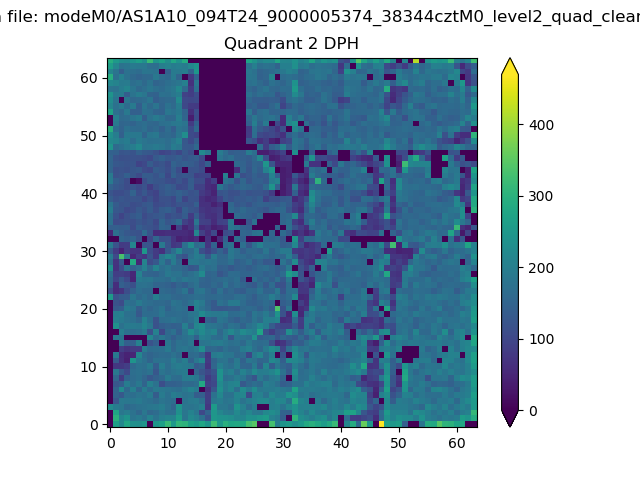
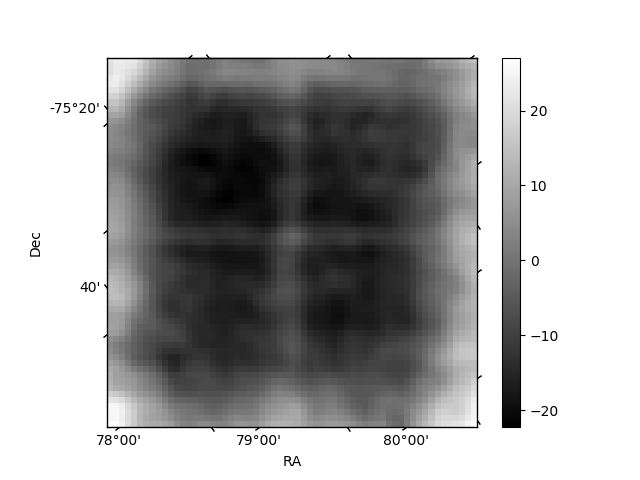
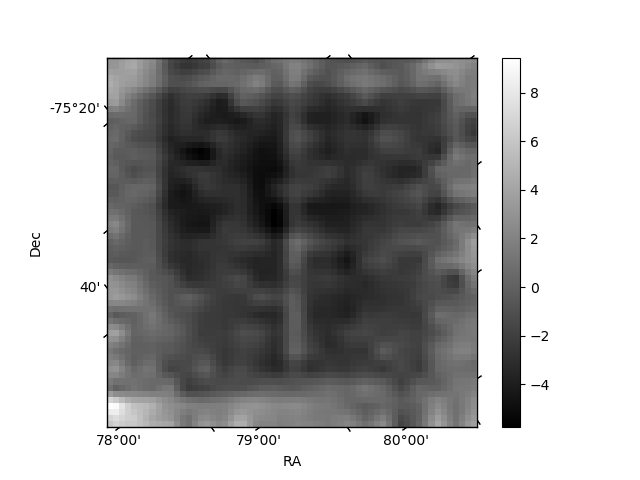
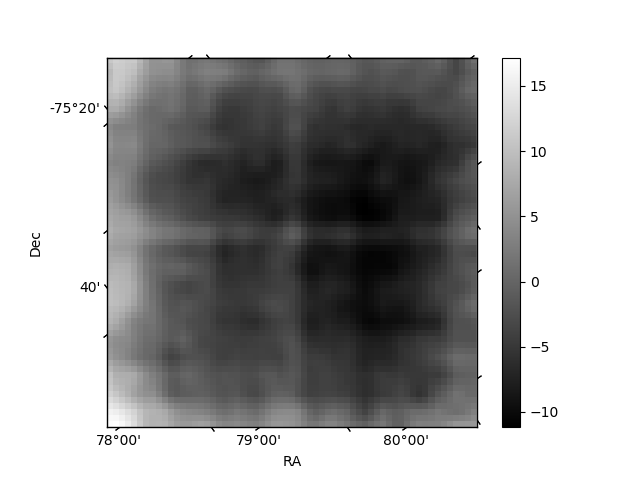
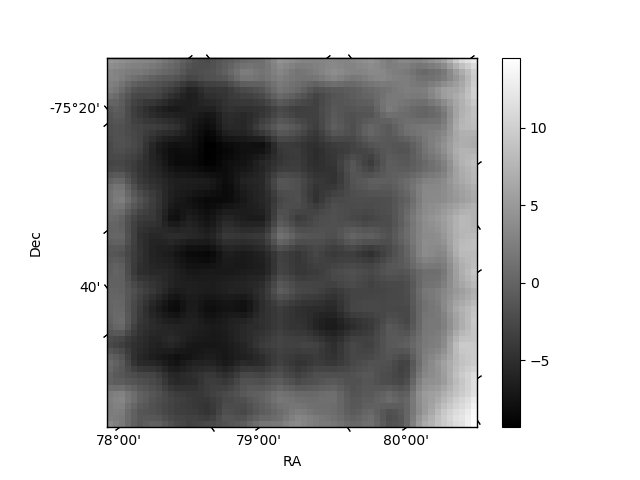
Histogram calculated using DETX and DETY for each event in the final _common_clean file
| Quadrant A | 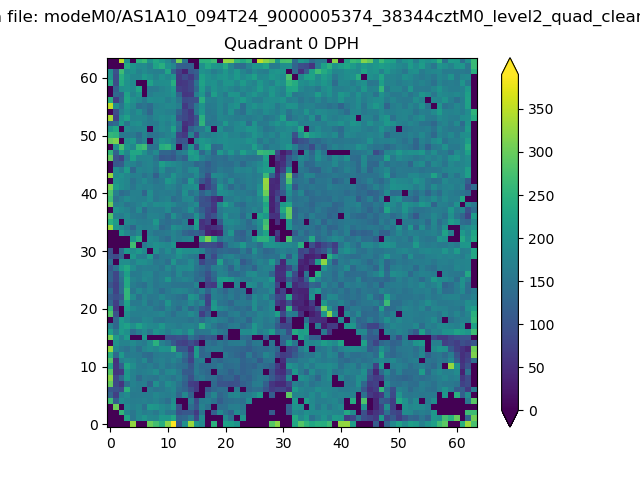 |
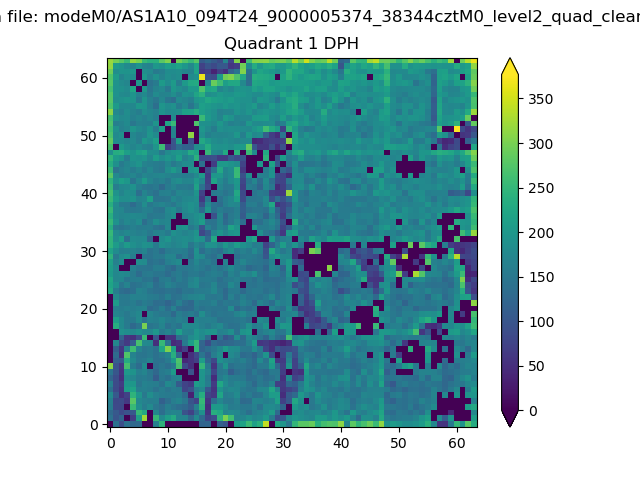 |
Quadrant B |
|---|---|---|---|
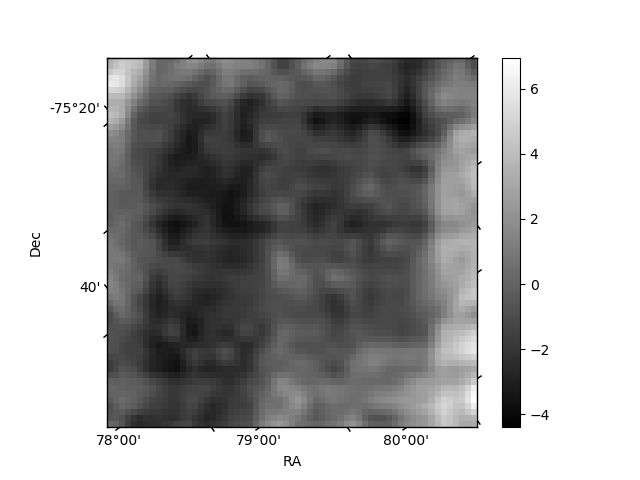
| Quadrant D | 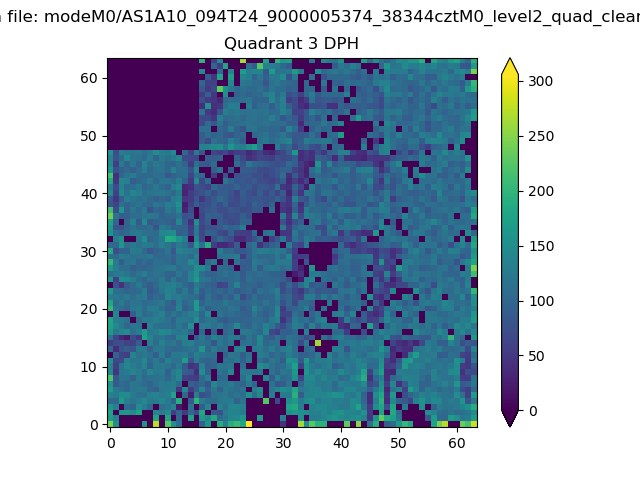 |
 |
Quadrant C |
| Plot type | Count rate plots | Images |
|---|---|---|
| Comparison with Poisson distribution Blue bars denote a histogram of data divided into 1 sec bins. Red curve is a Poisson curve with rate = median count rate of data. |
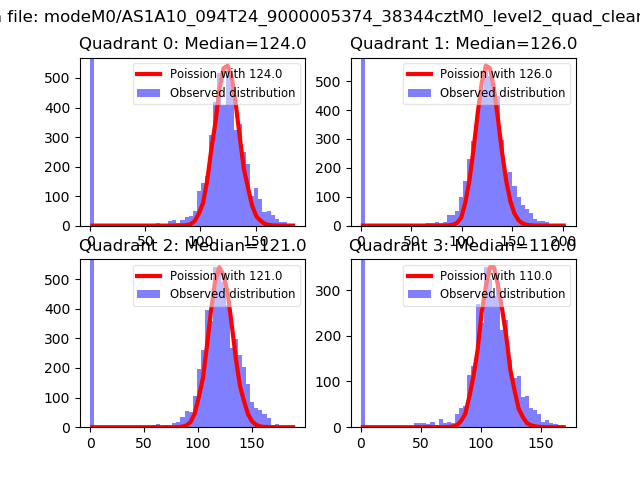 |
 |
| Quadrant-wise count rates Data is divided into 100 sec bins |
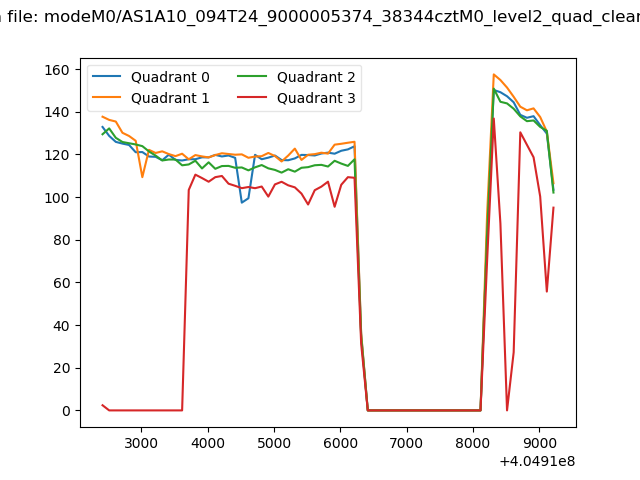 |
|
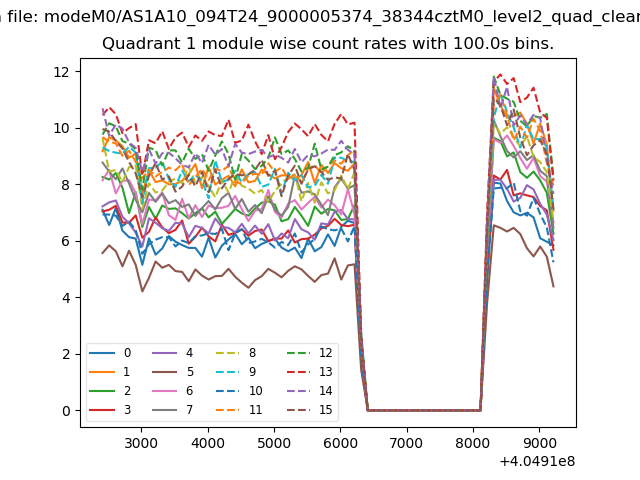
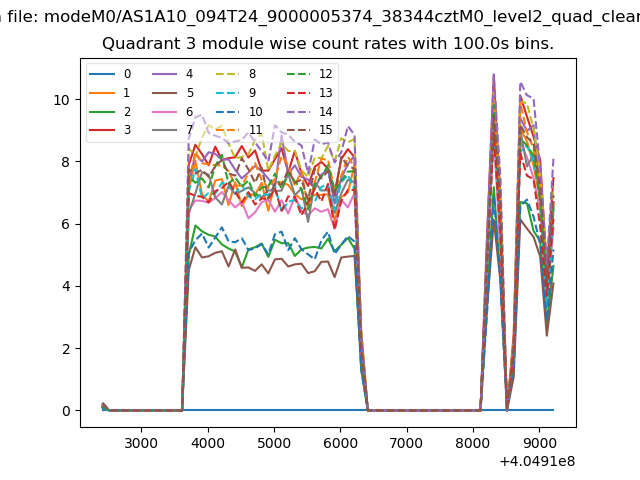
| Module-wise count rates for Quadrant A Data is divided into 100 sec bins |
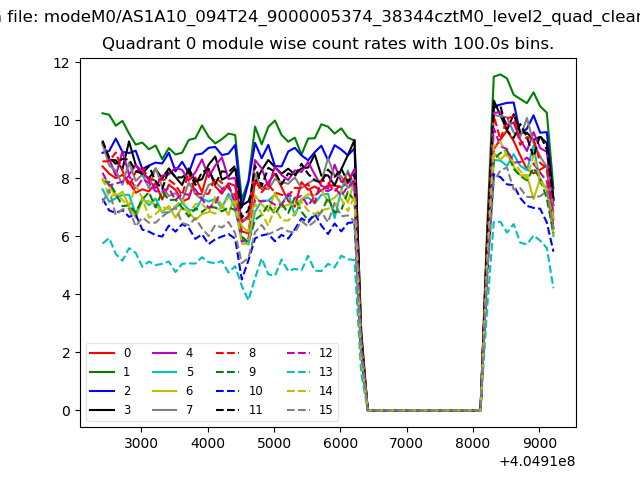 |
 |
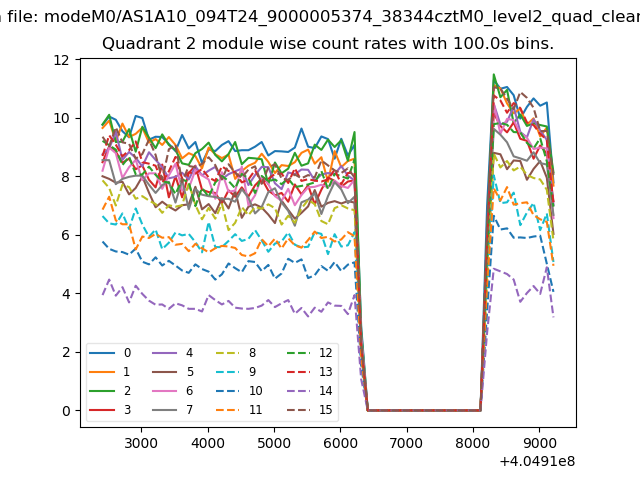
| Module-wise count rates for Quadrant B Data is divided into 100 sec bins |
 |
 |
| Module-wise count rates for Quadrant C Data is divided into 100 sec bins |
 |
 |
| Module-wise count rates for Quadrant D Data is divided into 100 sec bins |
 |
 |
| Parameter | Plot |
|---|---|
| CZT HV Monitor | 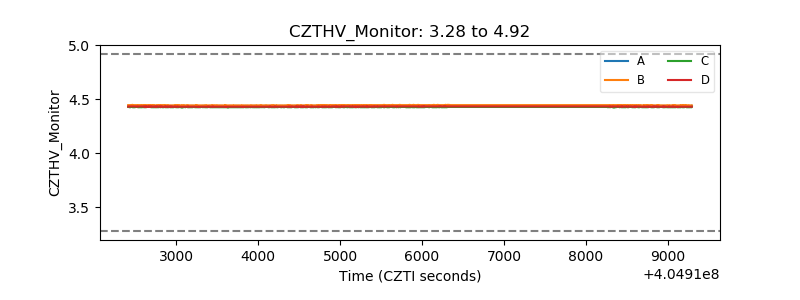 |
| D_VDD | 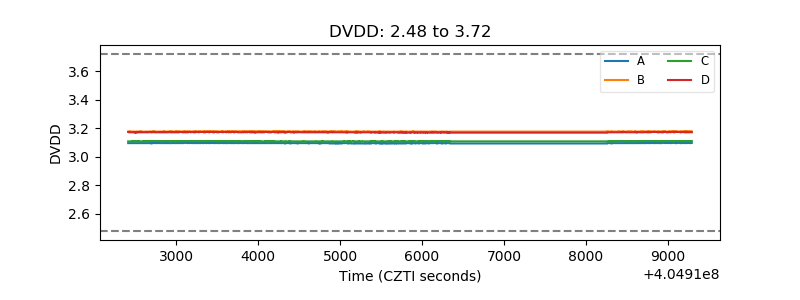 |
| Temperature 1 | 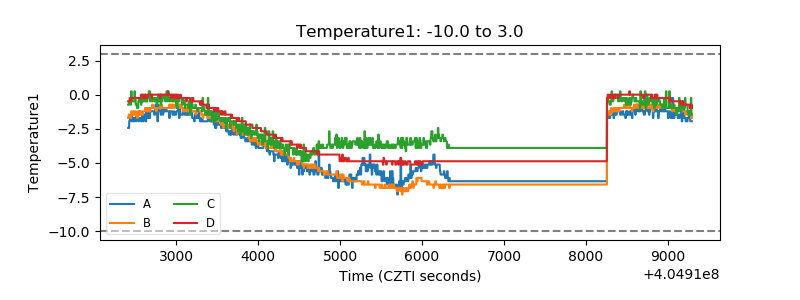 |
| Veto HV Monitor | 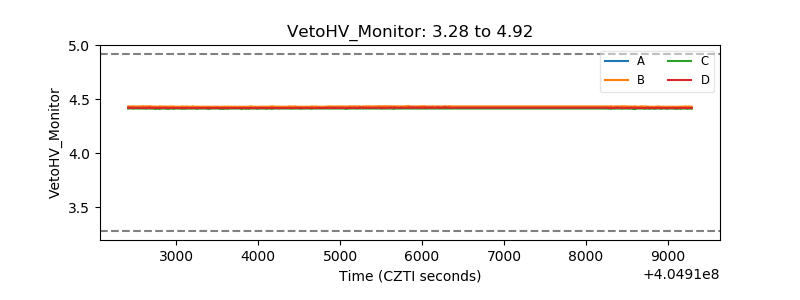 |
| Veto LLD | 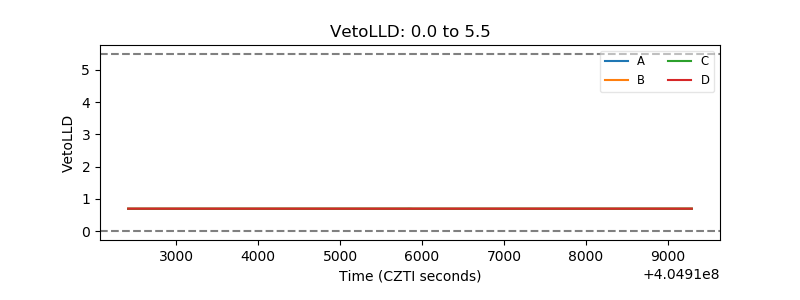 |
| Alpha Counter | 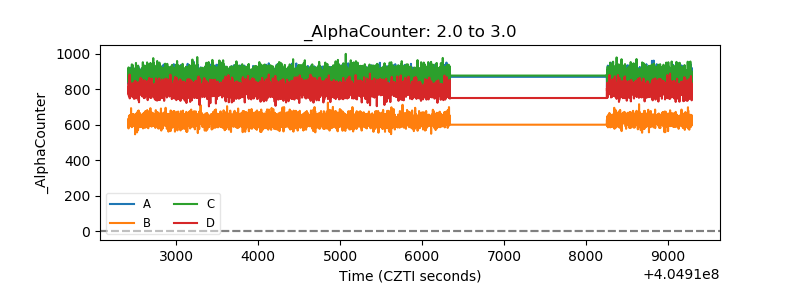 |
| _CPM_Rate | 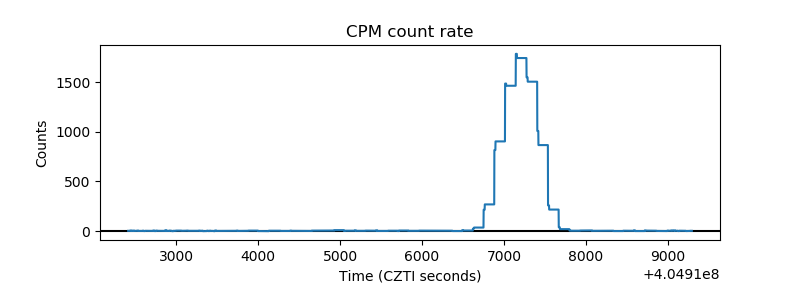 |
| CZT Counter | 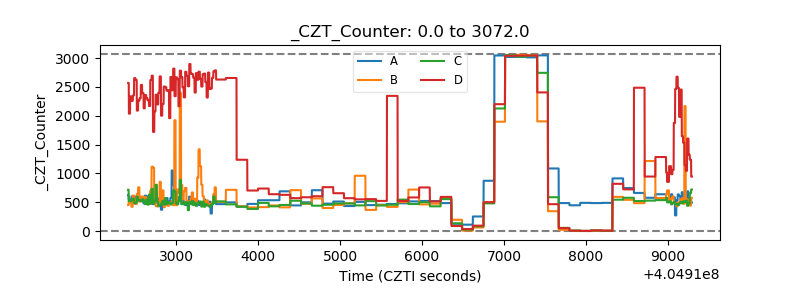 |
| +2.5 Volts monitor | 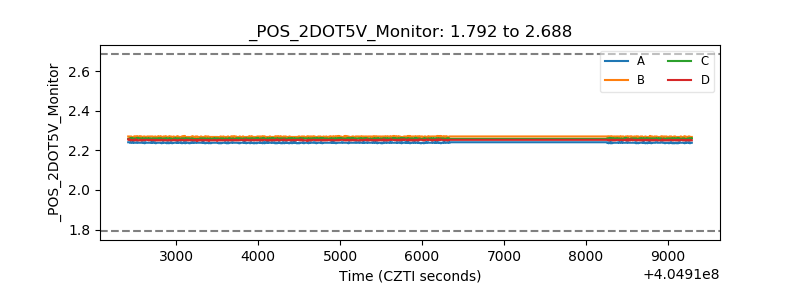 |
| +5 Volts monitor | 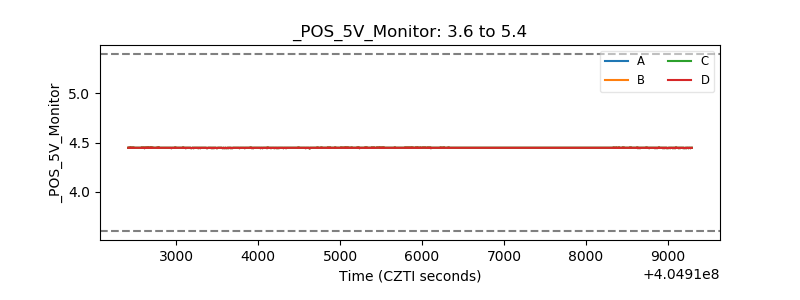 |
| _ROLL_ROT | 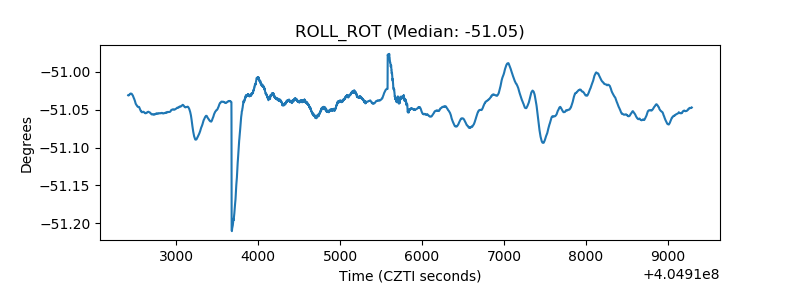 |
| _Roll_DEC | 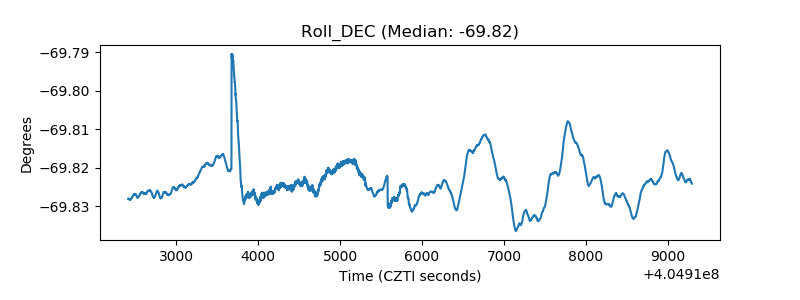 |
| _Roll_RA | 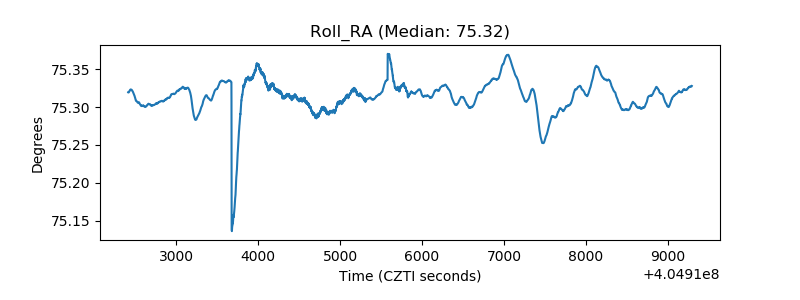 |
| Veto Counter | 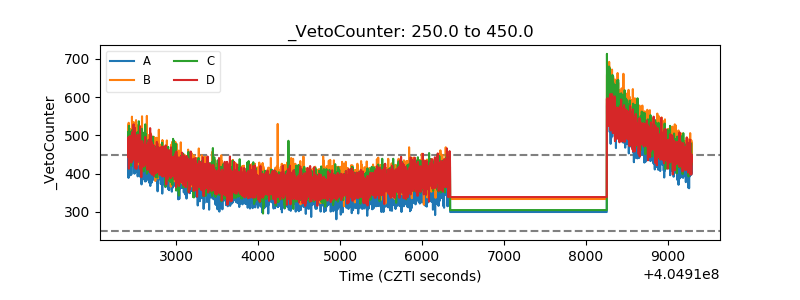 |