| Param | Original file | Final file |
|---|---|---|
| Filename | modeM0/AS1A10_094T24_9000005374_38345cztM0_level2.fits | modeM0/AS1A10_094T24_9000005374_38345cztM0_level2_quad_clean.evt |
| Size (bytes) | 422,239,680 | 90,950,400 |
| Size | 402.7 MB | 86.7 MB |
| Events in quadrant A | 2,811,607 | 664,545 |
| Events in quadrant B | 3,262,178 | 647,174 |
| Events in quadrant C | 2,563,486 | 637,944 |
| Events in quadrant D | 6,599,451 | 450,399 |
| Mode SS | |||
|---|---|---|---|
| Quadrant | BADHDUFLAG | Total packets | Discarded packets |
| A | 0 | 102 | 0 |
| B | 0 | 102 | 0 |
| C | 0 | 102 | 0 |
| D | 0 | 102 | 0 |
| Mode M0 | |||
|---|---|---|---|
| Quadrant | BADHDUFLAG | Total packets | Discarded packets |
| A | 0 | 11424 | 2 |
| B | 0 | 13018 | 1 |
| C | 0 | 10646 | 1 |
| D | 0 | 23427 | 1 |
| Mode M9 | |||
|---|---|---|---|
| Quadrant | BADHDUFLAG | Total packets | Discarded packets |
| A | 0 | 21 | 0 |
| B | 0 | 21 | 0 |
| C | 0 | 21 | 0 |
| D | 0 | 21 | 0 |
| Quadrant | Total seconds | Saturated seconds | Saturation percentage |
|---|---|---|---|
| A | 5056 | 16 | 0.316456% |
| B | 5056 | 243 | 4.806171% |
| C | 5056 | 6 | 0.118671% |
| D | 5056 | 1224 | 24.208861% |
Noise dominated data is calculated using 1-second bins in cleaned event files. If a bin has >2000 counts, and if more than 50% of those come from <1% of pixels, then it is considered to be noise-dominated and hence unusable.
| Quadrant | # 1 sec bins | Bins with >0 counts | Bins with >2000 counts | High rate bins dominated by noise | Noise dominated (total time) | Noise dominated (detector-on time) | Marked lightcurve |
|---|---|---|---|---|---|---|---|
| A | 7089 | 5057 | 3 | 3 | 0.04% | 0.06% | 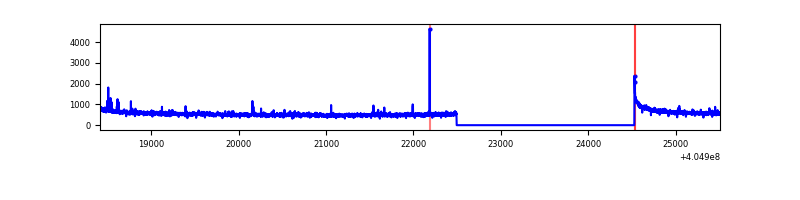 |
| B | 7089 | 5057 | 230 | 230 | 3.24% | 4.55% | 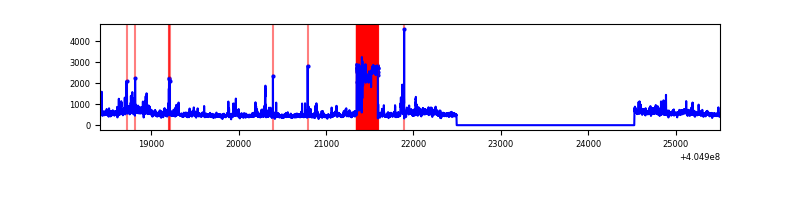 |
| C | 7089 | 5057 | 4 | 4 | 0.06% | 0.08% | 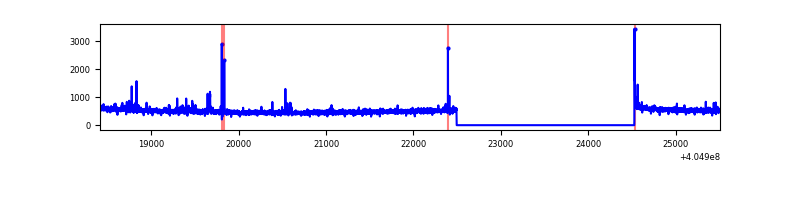 |
| D | 7089 | 5057 | 1151 | 1151 | 16.24% | 22.76% | 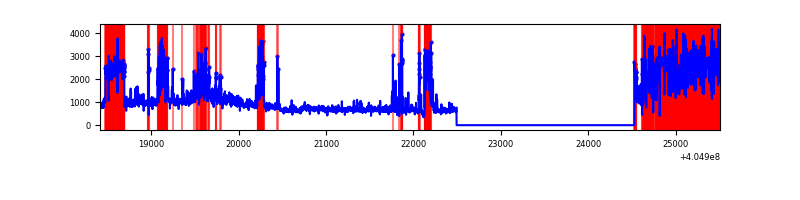 |
Top three noisy pixels from each quadrant. If the there are fewer than three noisy pixels in the level2.evt file, extra rows are filled as -1
| Pixel properties | Quadrant properties | ||||||
|---|---|---|---|---|---|---|---|
| Quadrant | DetID | PixID | Counts | Sigma | Mean | Median | Sigma |
| A | 10 | 83 | 375424 | 3086.88 | 605 | 595 | 121.4 |
| A | 12 | 189 | 53850 | 438.58 | 605 | 595 | 121.4 |
| A | 13 | 248 | 21928 | 175.69 | 605 | 595 | 121.4 |
| B | 5 | 184 | 640087 | 5852.11 | 582 | 569 | 109.3 |
| B | 0 | 183 | 89326 | 812.2 | 582 | 569 | 109.3 |
| B | 0 | 155 | 52799 | 477.95 | 582 | 569 | 109.3 |
| C | 15 | 214 | 217264 | 1626.58 | 579 | 584 | 133.2 |
| C | 14 | 254 | 39976 | 295.71 | 579 | 584 | 133.2 |
| C | 1 | 23 | 13875 | 99.77 | 579 | 584 | 133.2 |
| D | 10 | 203 | 1846429 | 14888.44 | 508 | 495 | 124.0 |
| D | 12 | 227 | 1175211 | 9474.71 | 508 | 495 | 124.0 |
| D | 12 | 233 | 652568 | 5259.32 | 508 | 495 | 124.0 |
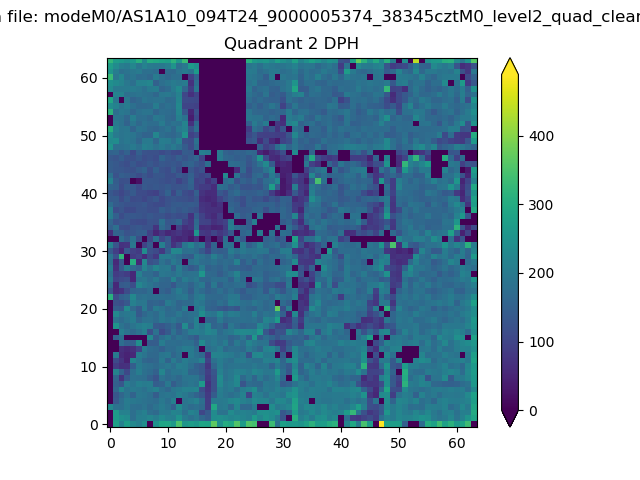
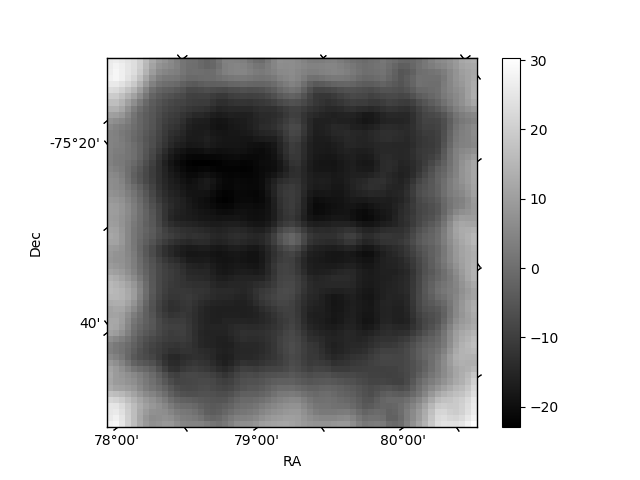
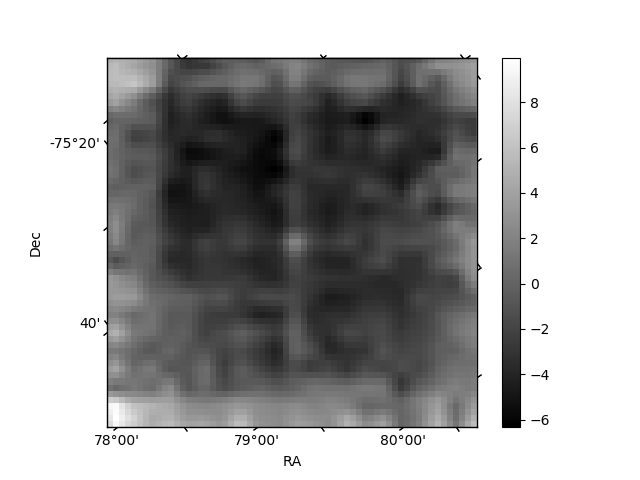
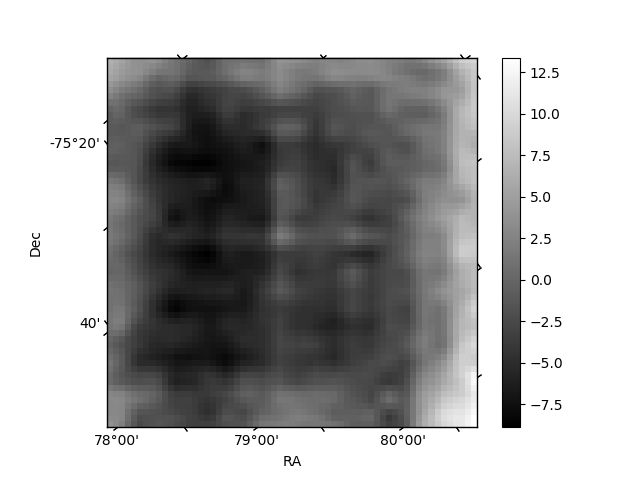
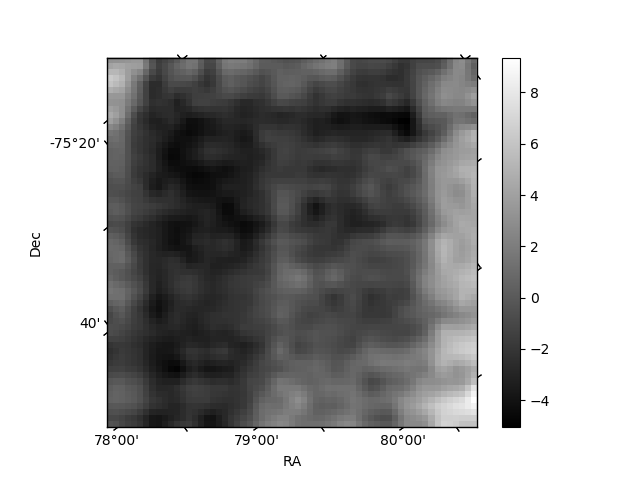
Histogram calculated using DETX and DETY for each event in the final _common_clean file
| Quadrant A | 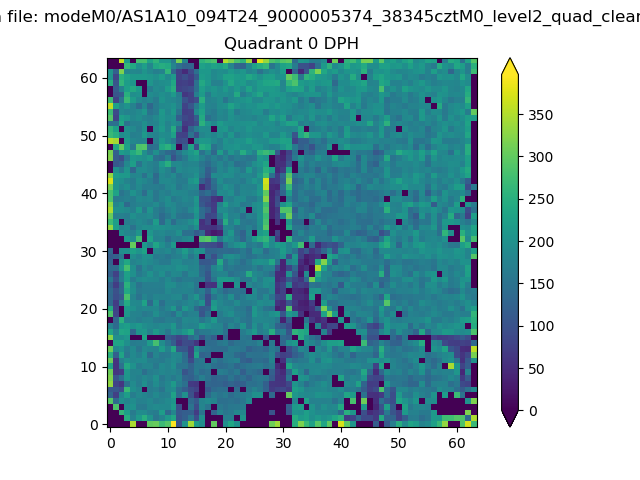 |
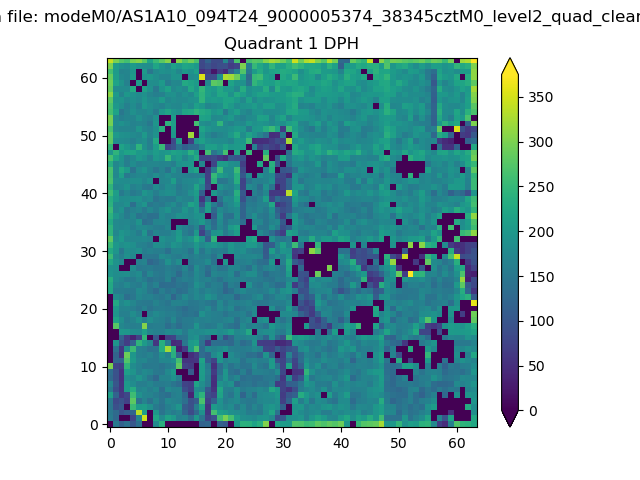 |
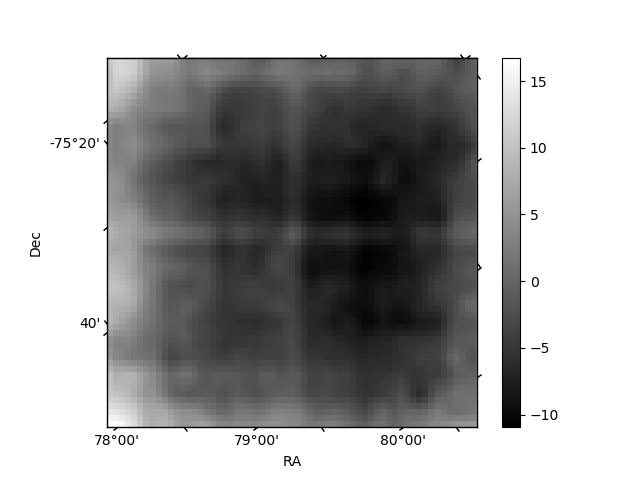
Quadrant B |
|---|---|---|---|
| Quadrant D | 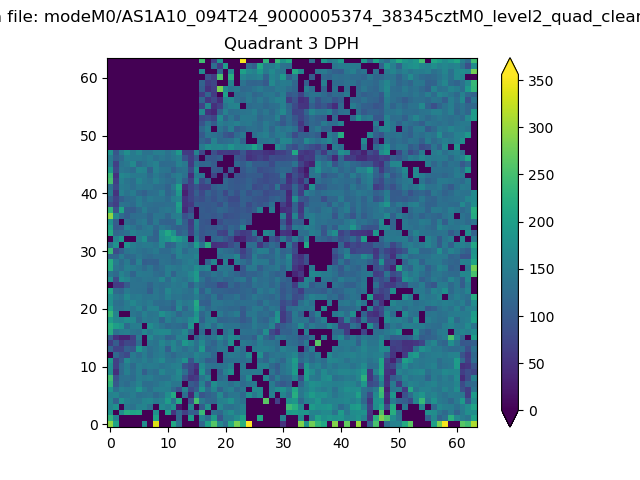 |
 |
Quadrant C |
| Plot type | Count rate plots | Images |
|---|---|---|
| Comparison with Poisson distribution Blue bars denote a histogram of data divided into 1 sec bins. Red curve is a Poisson curve with rate = median count rate of data. |
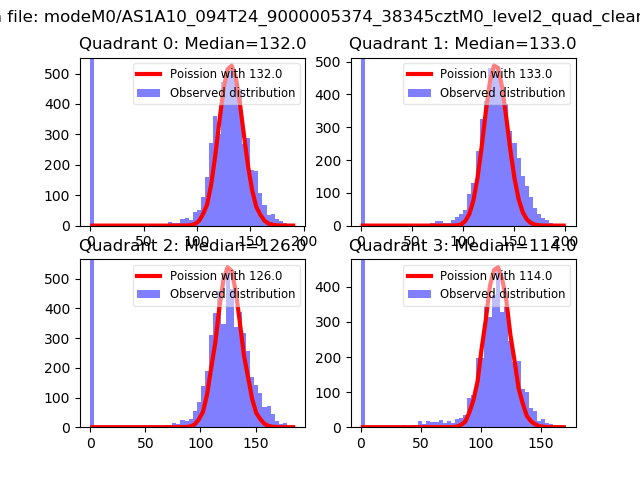 |
 |
| Quadrant-wise count rates Data is divided into 100 sec bins |
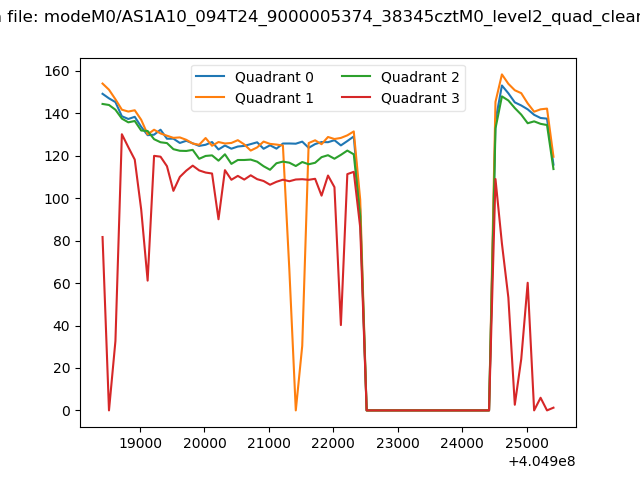 |
|
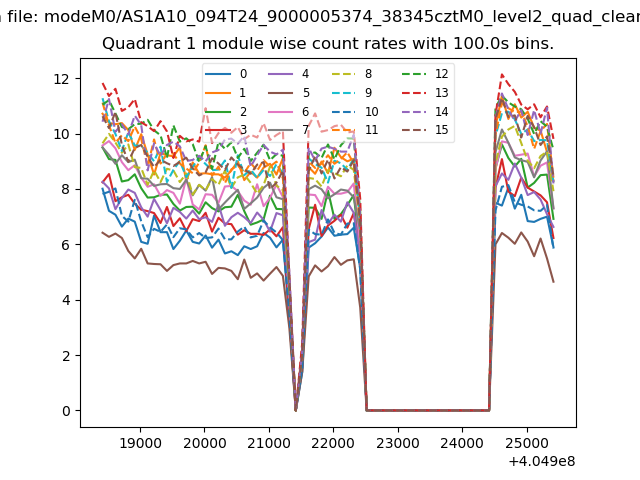
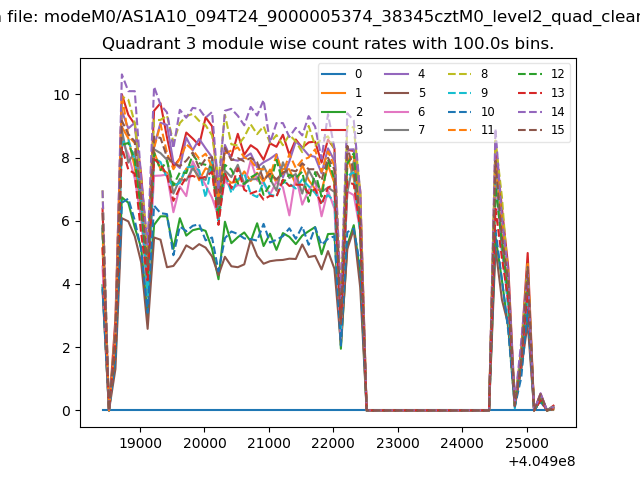
| Module-wise count rates for Quadrant A Data is divided into 100 sec bins |
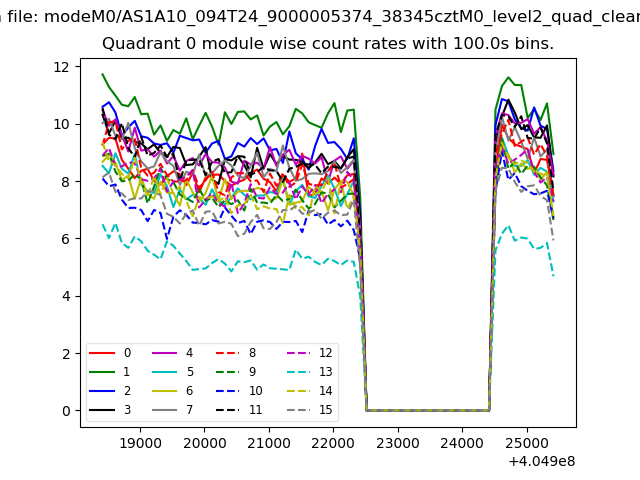 |
 |
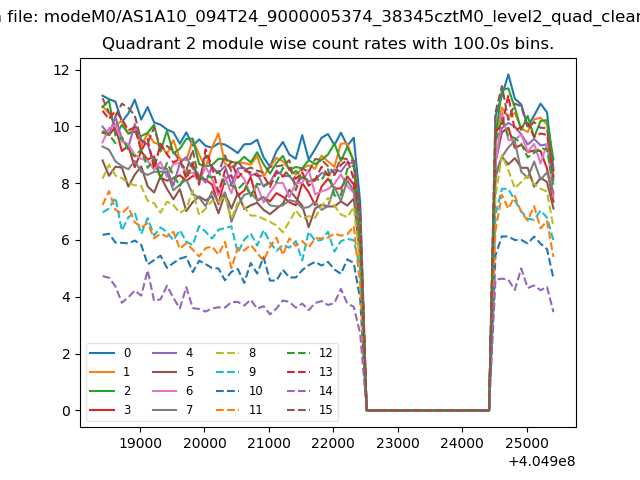
| Module-wise count rates for Quadrant B Data is divided into 100 sec bins |
 |
 |
| Module-wise count rates for Quadrant C Data is divided into 100 sec bins |
 |
 |
| Module-wise count rates for Quadrant D Data is divided into 100 sec bins |
 |
 |
| Parameter | Plot |
|---|---|
| CZT HV Monitor | 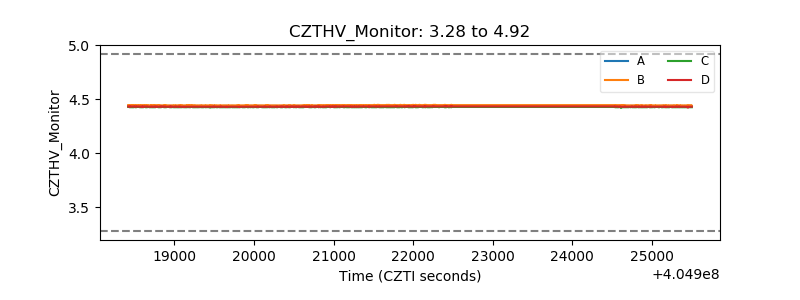 |
| D_VDD | 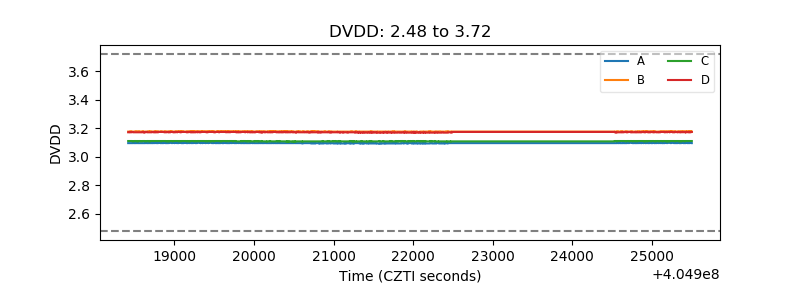 |
| Temperature 1 | 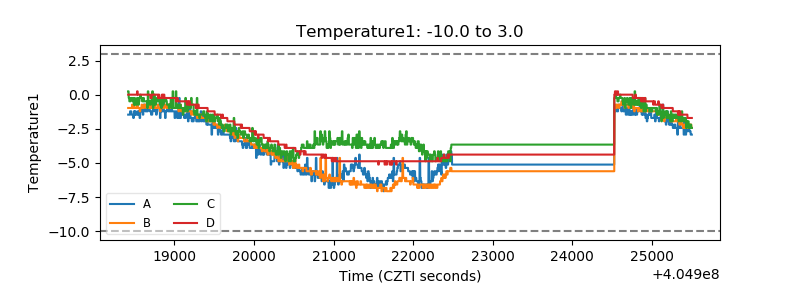 |
| Veto HV Monitor | 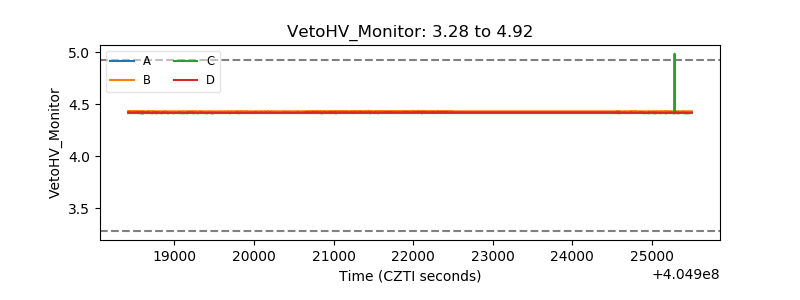 |
| Veto LLD | 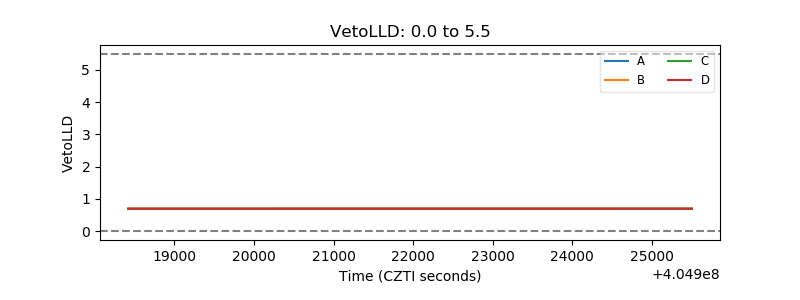 |
| Alpha Counter | 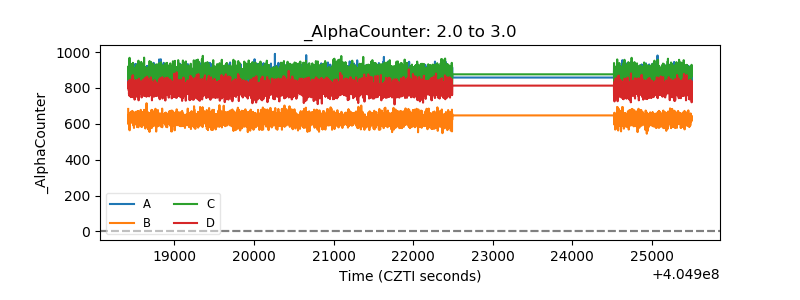 |
| _CPM_Rate | 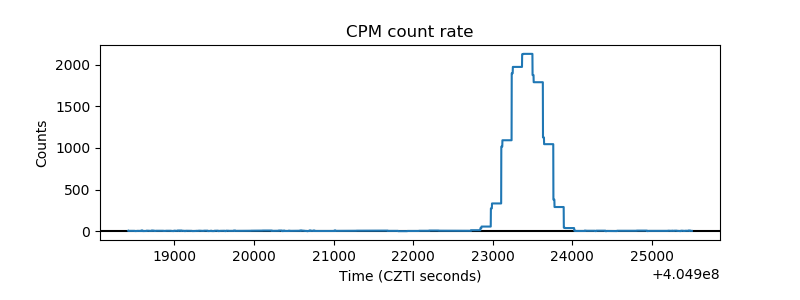 |
| CZT Counter | 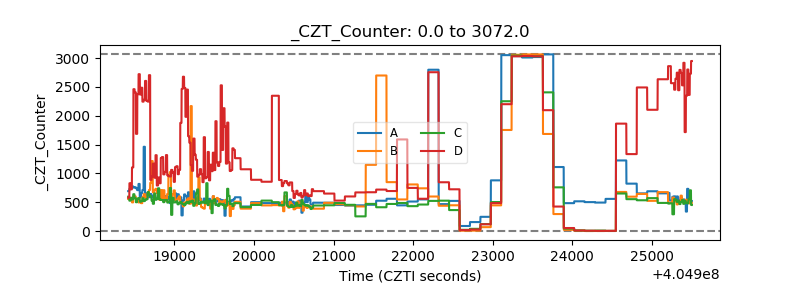 |
| +2.5 Volts monitor |  |
| +5 Volts monitor | 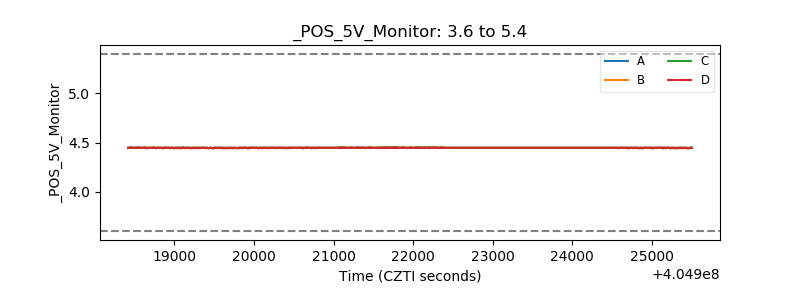 |
| _ROLL_ROT | 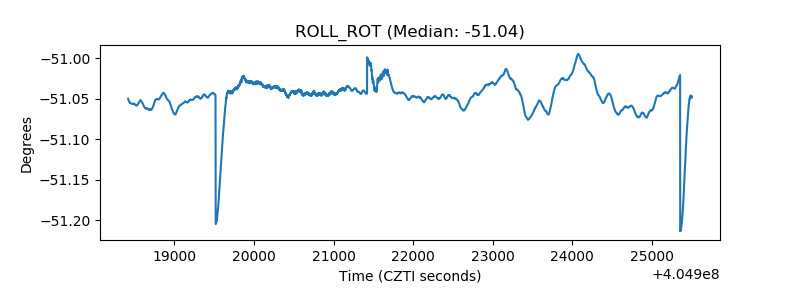 |
| _Roll_DEC | 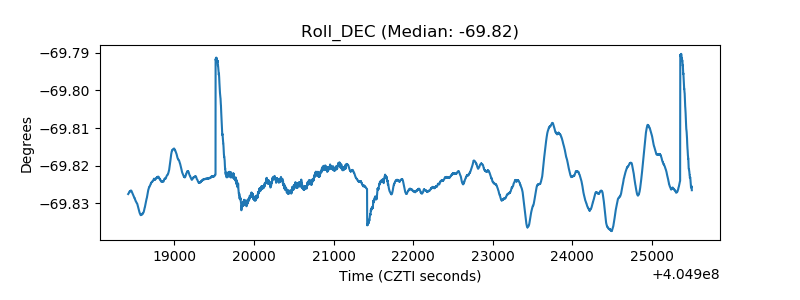 |
| _Roll_RA | 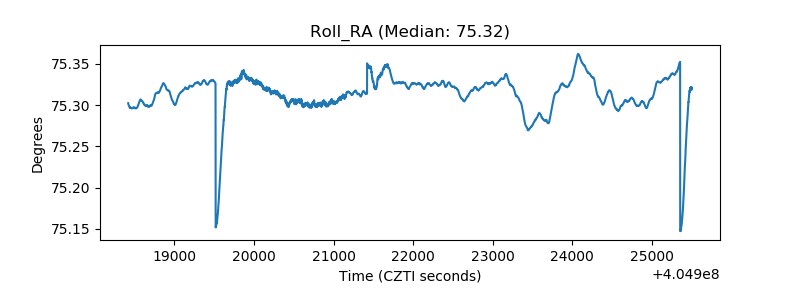 |
| Veto Counter | 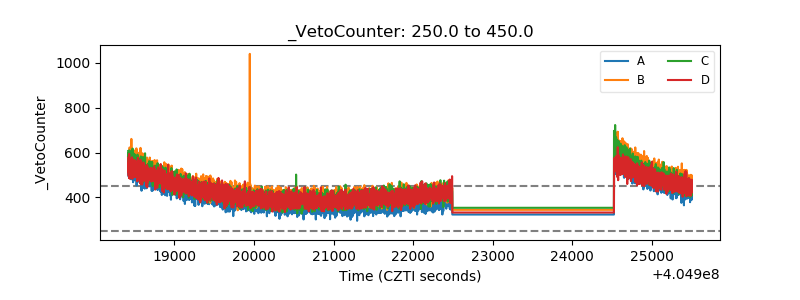 |