| Param | Original file | Final file |
|---|---|---|
| Filename | modeM0/AS1A10_094T24_9000005374_38346cztM0_level2.fits | modeM0/AS1A10_094T24_9000005374_38346cztM0_level2_quad_clean.evt |
| Size (bytes) | 449,651,520 | 92,453,760 |
| Size | 428.8 MB | 88.2 MB |
| Events in quadrant A | 2,871,546 | 673,211 |
| Events in quadrant B | 2,855,160 | 684,037 |
| Events in quadrant C | 2,721,522 | 642,710 |
| Events in quadrant D | 7,801,302 | 443,333 |
| Mode SS | |||
|---|---|---|---|
| Quadrant | BADHDUFLAG | Total packets | Discarded packets |
| A | 0 | 104 | 0 |
| B | 0 | 104 | 0 |
| C | 0 | 104 | 0 |
| D | 0 | 104 | 0 |
| Mode M0 | |||
|---|---|---|---|
| Quadrant | BADHDUFLAG | Total packets | Discarded packets |
| A | 0 | 11575 | 3 |
| B | 0 | 11781 | 2 |
| C | 0 | 11050 | 2 |
| D | 0 | 26798 | 2 |
| Mode M9 | |||
|---|---|---|---|
| Quadrant | BADHDUFLAG | Total packets | Discarded packets |
| A | 0 | 21 | 0 |
| B | 0 | 21 | 0 |
| C | 0 | 21 | 0 |
| D | 0 | 22 | 0 |
| Quadrant | Total seconds | Saturated seconds | Saturation percentage |
|---|---|---|---|
| A | 5084 | 15 | 0.295043% |
| B | 5084 | 63 | 1.239182% |
| C | 5084 | 42 | 0.826121% |
| D | 5084 | 1429 | 28.107789% |
Noise dominated data is calculated using 1-second bins in cleaned event files. If a bin has >2000 counts, and if more than 50% of those come from <1% of pixels, then it is considered to be noise-dominated and hence unusable.
| Quadrant | # 1 sec bins | Bins with >0 counts | Bins with >2000 counts | High rate bins dominated by noise | Noise dominated (total time) | Noise dominated (detector-on time) | Marked lightcurve |
|---|---|---|---|---|---|---|---|
| A | 7207 | 5085 | 4 | 4 | 0.06% | 0.08% | 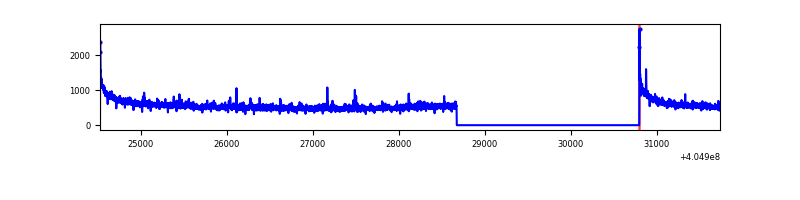 |
| B | 7207 | 5085 | 38 | 38 | 0.53% | 0.75% | 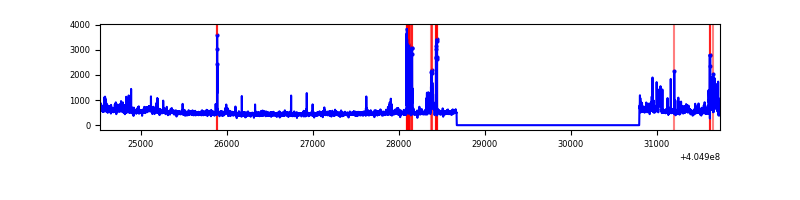 |
| C | 7207 | 5085 | 27 | 27 | 0.37% | 0.53% | 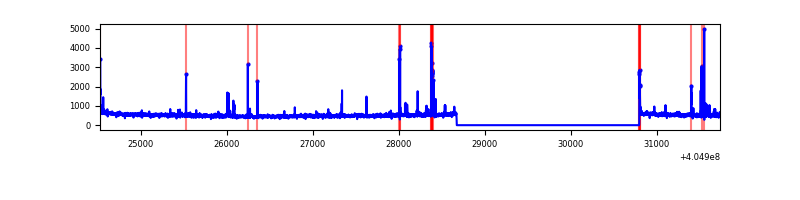 |
| D | 7207 | 5085 | 1396 | 1396 | 19.37% | 27.45% | 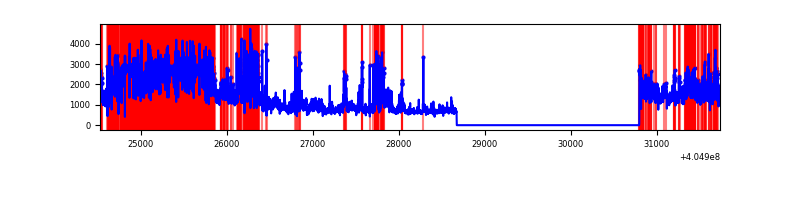 |
Top three noisy pixels from each quadrant. If the there are fewer than three noisy pixels in the level2.evt file, extra rows are filled as -1
| Pixel properties | Quadrant properties | ||||||
|---|---|---|---|---|---|---|---|
| Quadrant | DetID | PixID | Counts | Sigma | Mean | Median | Sigma |
| A | 10 | 83 | 425246 | 3499.8 | 608 | 598 | 121.3 |
| A | 12 | 189 | 51106 | 416.27 | 608 | 598 | 121.3 |
| A | 13 | 248 | 21093 | 168.91 | 608 | 598 | 121.3 |
| B | 4 | 232 | 152526 | 1348.18 | 608 | 595 | 112.7 |
| B | 0 | 183 | 87507 | 771.22 | 608 | 595 | 112.7 |
| B | 10 | 245 | 77627 | 683.55 | 608 | 595 | 112.7 |
| C | 15 | 214 | 219446 | 1649.39 | 583 | 588 | 132.7 |
| C | 2 | 16 | 74331 | 555.75 | 583 | 588 | 132.7 |
| C | 0 | 207 | 46819 | 348.41 | 583 | 588 | 132.7 |
| D | 12 | 235 | 1695953 | 14013.17 | 500 | 486 | 121.0 |
| D | 12 | 227 | 1676589 | 13853.12 | 500 | 486 | 121.0 |
| D | 10 | 203 | 1263510 | 10438.99 | 500 | 486 | 121.0 |
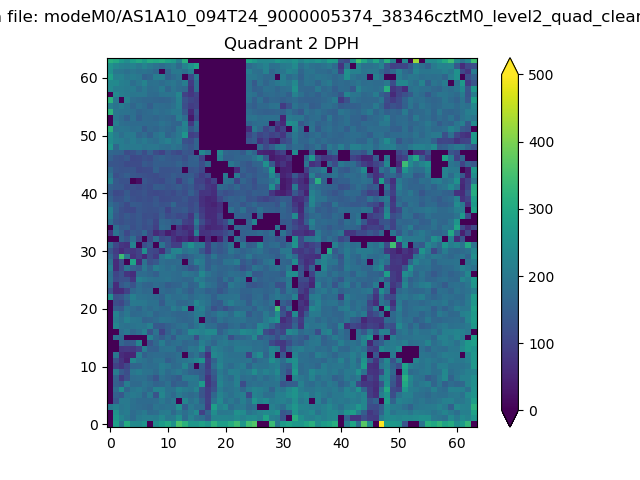
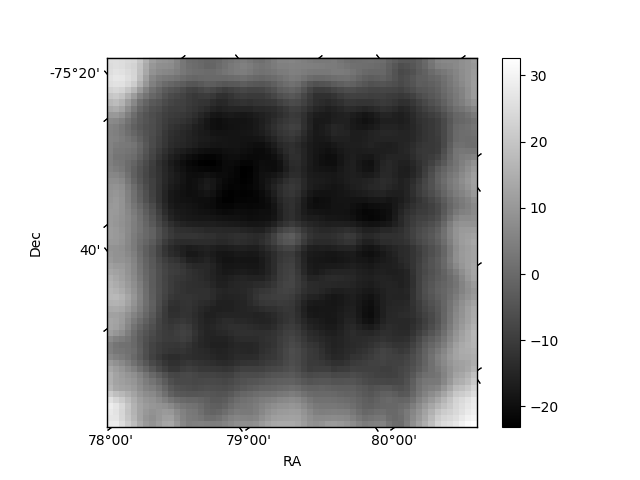
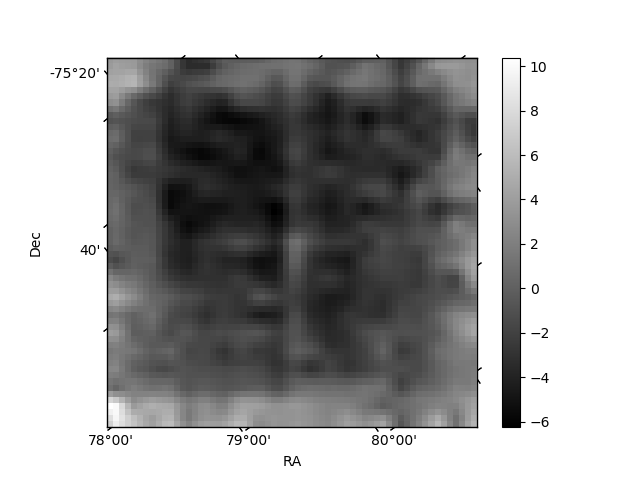
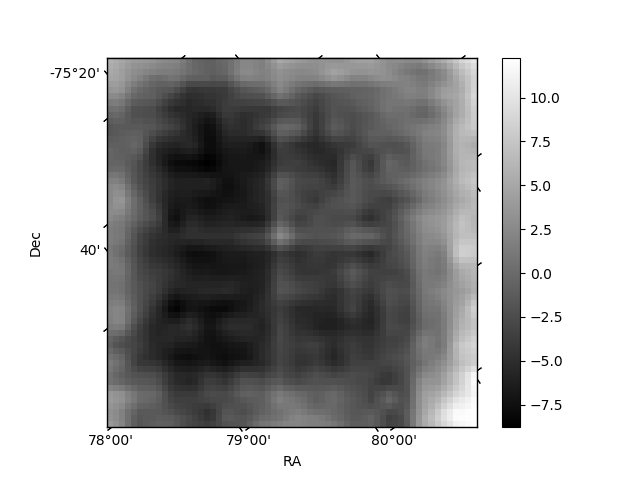
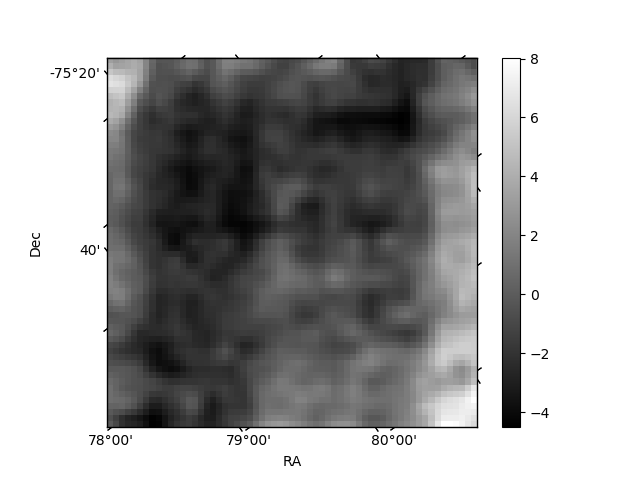
Histogram calculated using DETX and DETY for each event in the final _common_clean file
| Quadrant A | 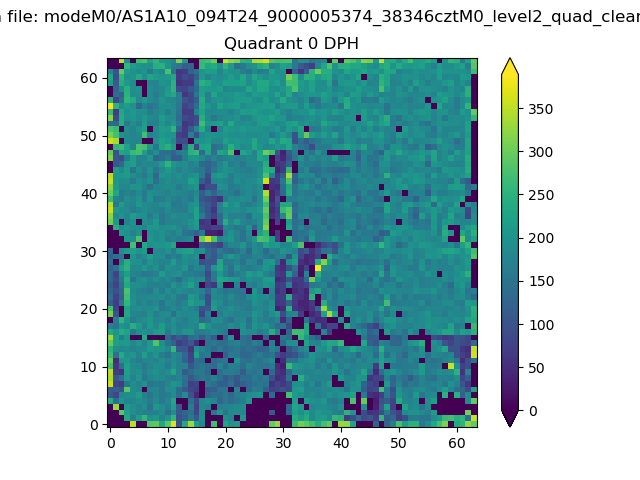 |
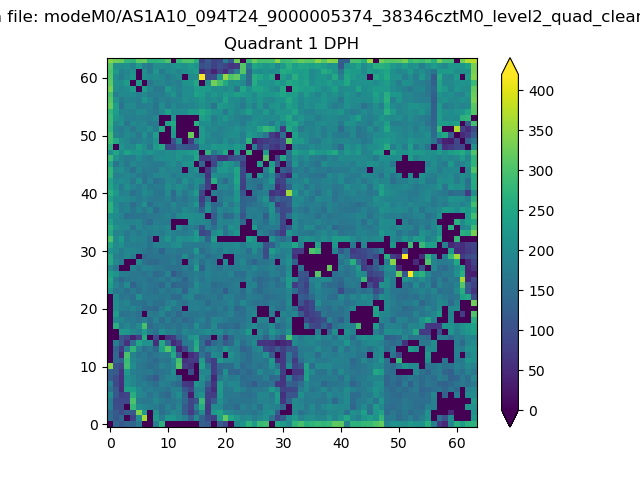 |
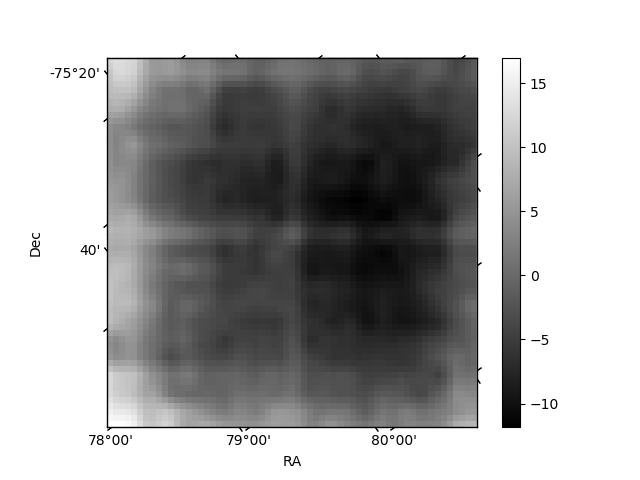
Quadrant B |
|---|---|---|---|
| Quadrant D | 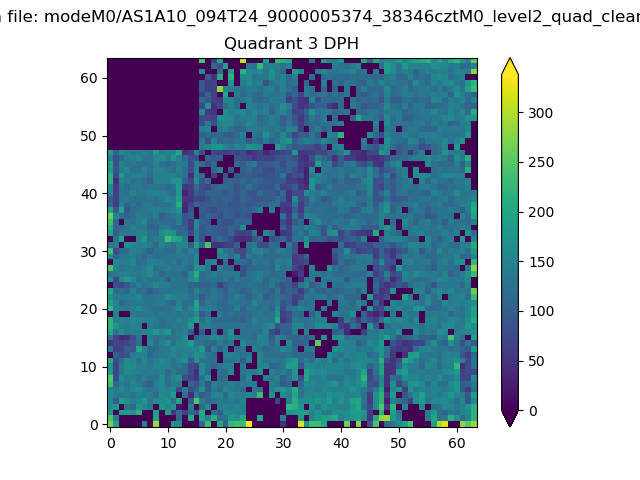 |
 |
Quadrant C |
| Plot type | Count rate plots | Images |
|---|---|---|
| Comparison with Poisson distribution Blue bars denote a histogram of data divided into 1 sec bins. Red curve is a Poisson curve with rate = median count rate of data. |
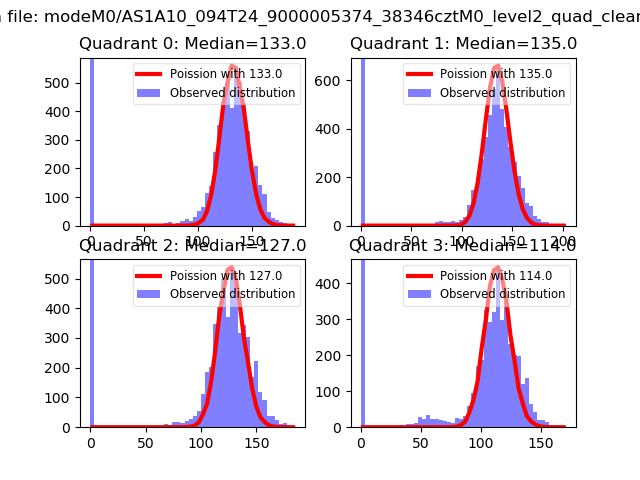 |
 |
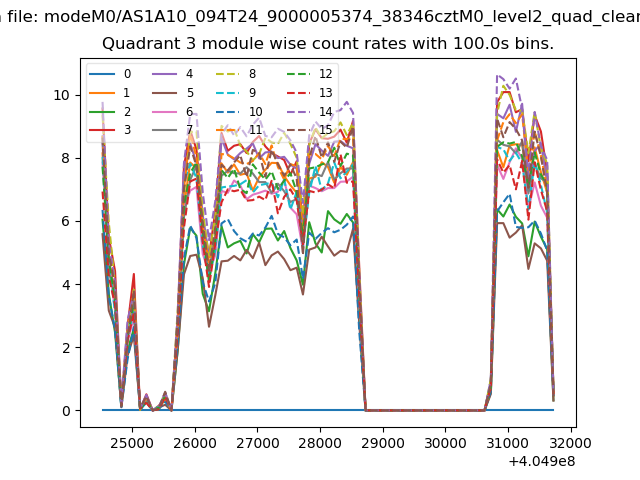
| Quadrant-wise count rates Data is divided into 100 sec bins |
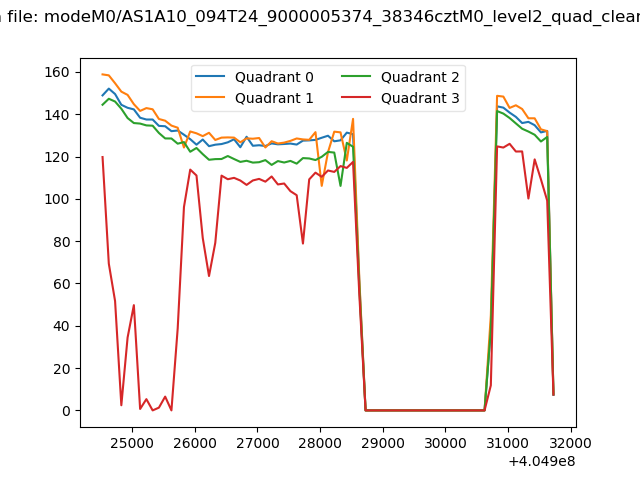 |
|
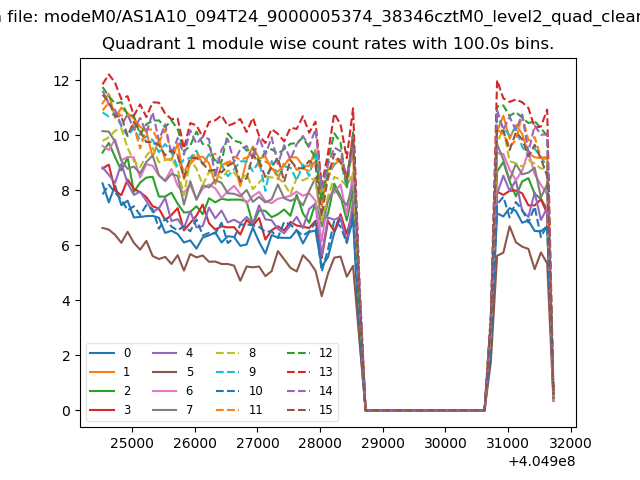
| Module-wise count rates for Quadrant A Data is divided into 100 sec bins |
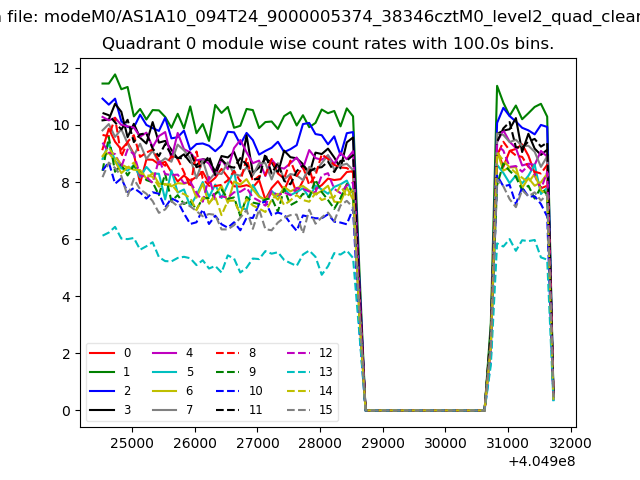 |
 |
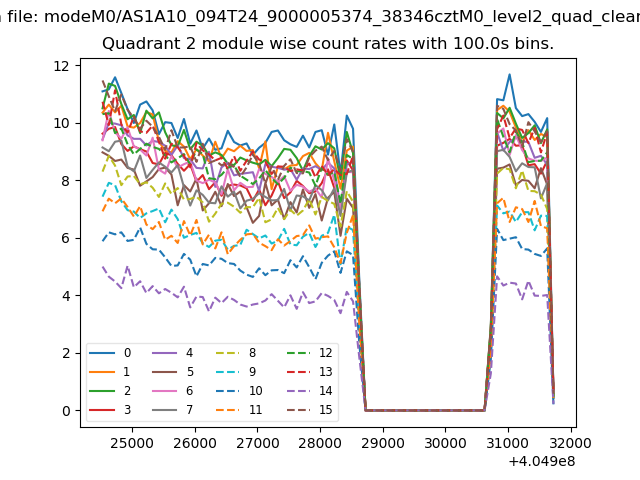
| Module-wise count rates for Quadrant B Data is divided into 100 sec bins |
 |
 |
| Module-wise count rates for Quadrant C Data is divided into 100 sec bins |
 |
 |
| Module-wise count rates for Quadrant D Data is divided into 100 sec bins |
 |
 |
| Parameter | Plot |
|---|---|
| CZT HV Monitor | 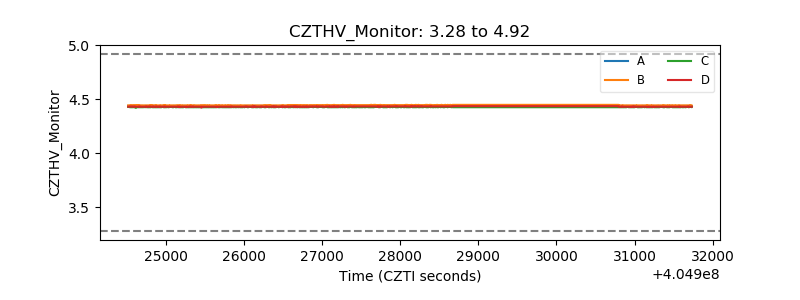 |
| D_VDD | 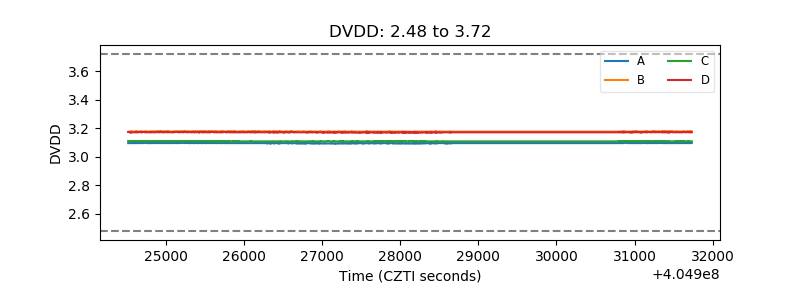 |
| Temperature 1 | 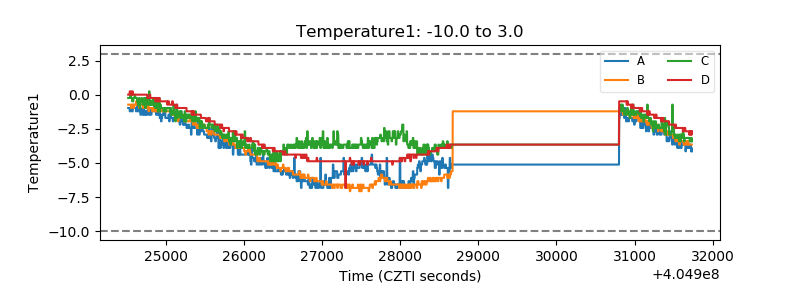 |
| Veto HV Monitor | 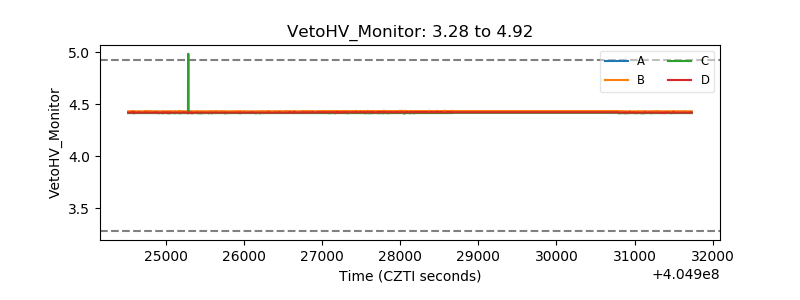 |
| Veto LLD | 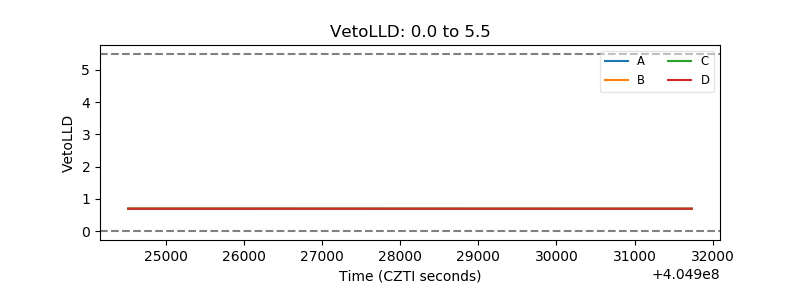 |
| Alpha Counter | 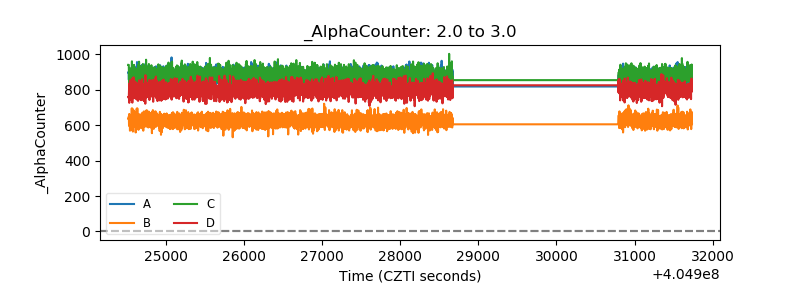 |
| _CPM_Rate | 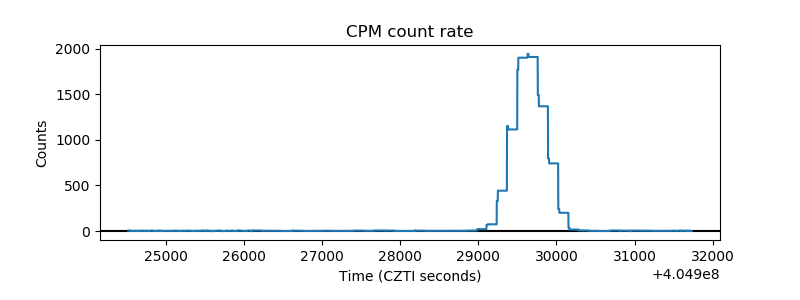 |
| CZT Counter | 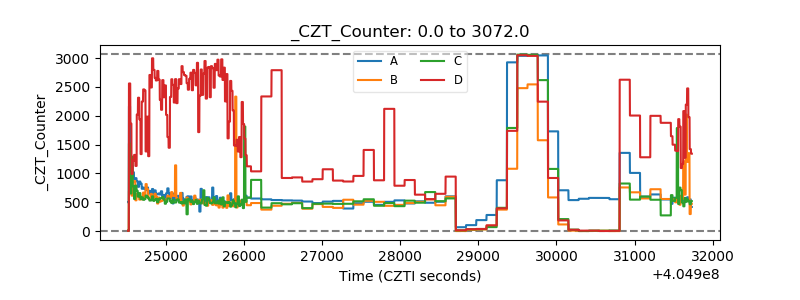 |
| +2.5 Volts monitor | 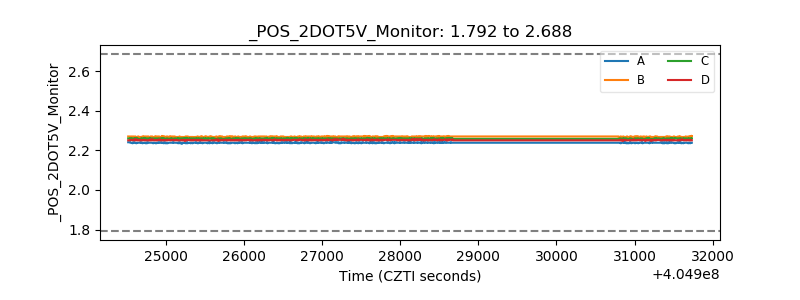 |
| +5 Volts monitor | 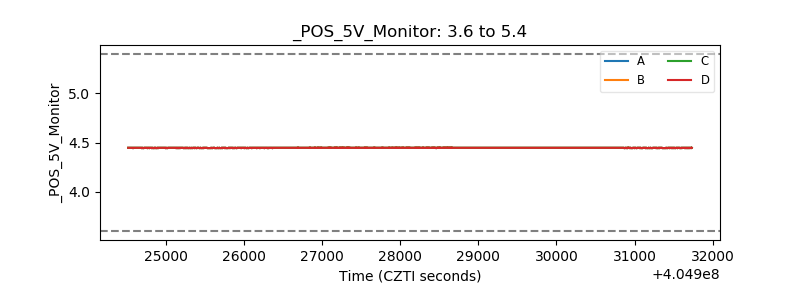 |
| _ROLL_ROT | 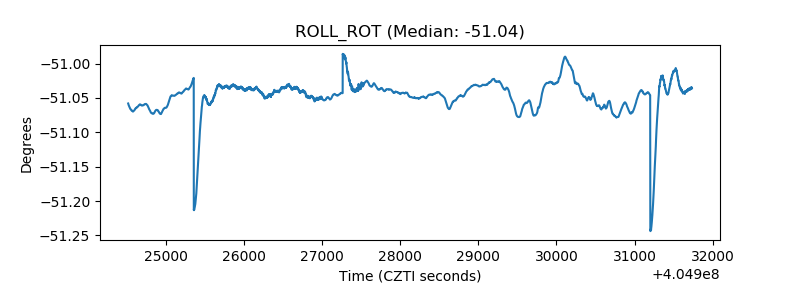 |
| _Roll_DEC | 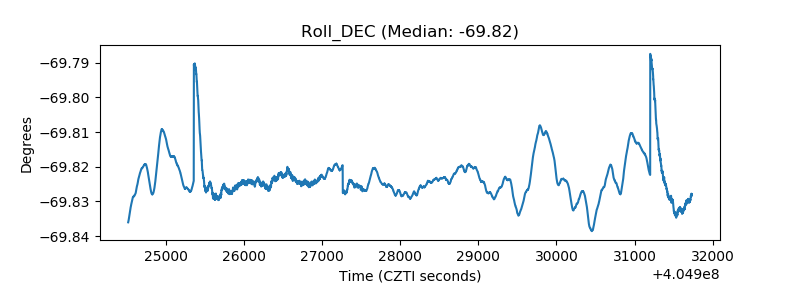 |
| _Roll_RA | 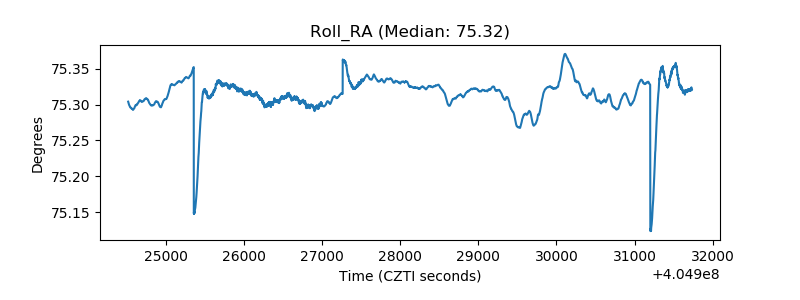 |
| Veto Counter | 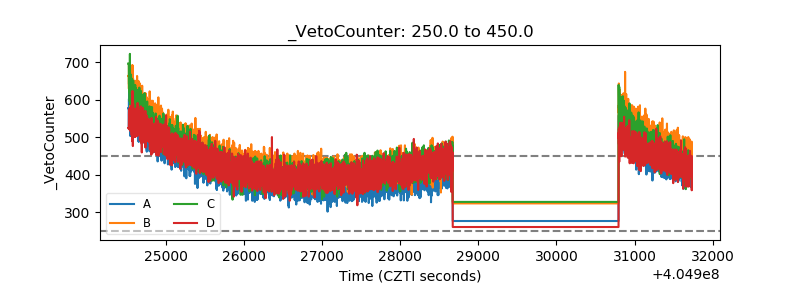 |