| Param | Original file | Final file |
|---|---|---|
| Filename | modeM0/AS1A10_094T24_9000005374_38347cztM0_level2.fits | modeM0/AS1A10_094T24_9000005374_38347cztM0_level2_quad_clean.evt |
| Size (bytes) | 443,335,680 | 88,122,240 |
| Size | 422.8 MB | 84.0 MB |
| Events in quadrant A | 3,053,569 | 626,730 |
| Events in quadrant B | 2,786,185 | 640,663 |
| Events in quadrant C | 2,521,386 | 600,674 |
| Events in quadrant D | 7,669,066 | 456,416 |
| Mode SS | |||
|---|---|---|---|
| Quadrant | BADHDUFLAG | Total packets | Discarded packets |
| A | 0 | 100 | 0 |
| B | 0 | 100 | 0 |
| C | 0 | 100 | 0 |
| D | 0 | 100 | 0 |
| Mode M0 | |||
|---|---|---|---|
| Quadrant | BADHDUFLAG | Total packets | Discarded packets |
| A | 0 | 12102 | 3 |
| B | 0 | 11444 | 2 |
| C | 0 | 10437 | 2 |
| D | 0 | 26275 | 2 |
| Mode M9 | |||
|---|---|---|---|
| Quadrant | BADHDUFLAG | Total packets | Discarded packets |
| A | 0 | 25 | 0 |
| B | 0 | 25 | 0 |
| C | 0 | 25 | 0 |
| D | 0 | 26 | 0 |
| Quadrant | Total seconds | Saturated seconds | Saturation percentage |
|---|---|---|---|
| A | 4905 | 31 | 0.632008% |
| B | 4905 | 50 | 1.019368% |
| C | 4905 | 19 | 0.387360% |
| D | 4905 | 1125 | 22.935780% |
Noise dominated data is calculated using 1-second bins in cleaned event files. If a bin has >2000 counts, and if more than 50% of those come from <1% of pixels, then it is considered to be noise-dominated and hence unusable.
| Quadrant | # 1 sec bins | Bins with >0 counts | Bins with >2000 counts | High rate bins dominated by noise | Noise dominated (total time) | Noise dominated (detector-on time) | Marked lightcurve |
|---|---|---|---|---|---|---|---|
| A | 7028 | 4906 | 22 | 22 | 0.31% | 0.45% | 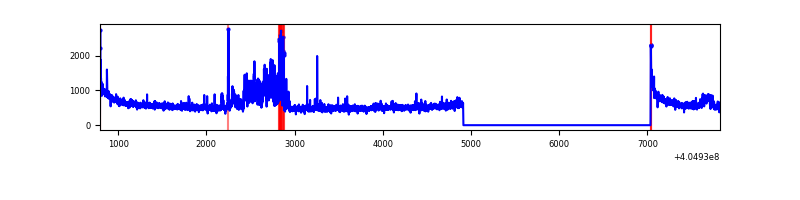 |
| B | 7028 | 4906 | 28 | 28 | 0.40% | 0.57% | 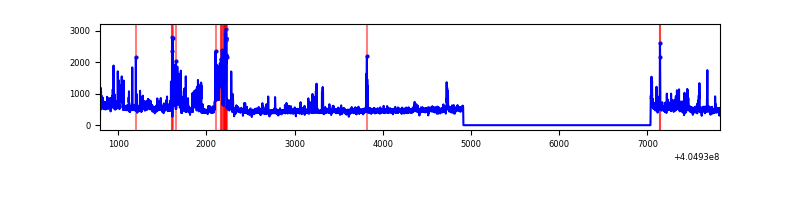 |
| C | 7028 | 4906 | 19 | 19 | 0.27% | 0.39% | 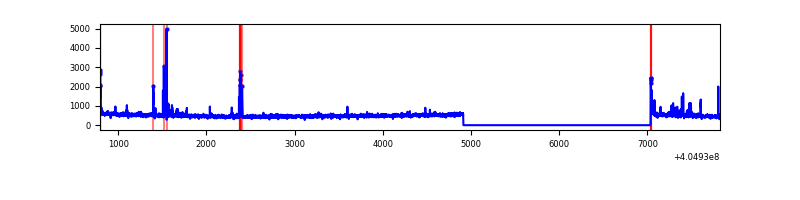 |
| D | 7028 | 4906 | 1271 | 1271 | 18.08% | 25.91% | 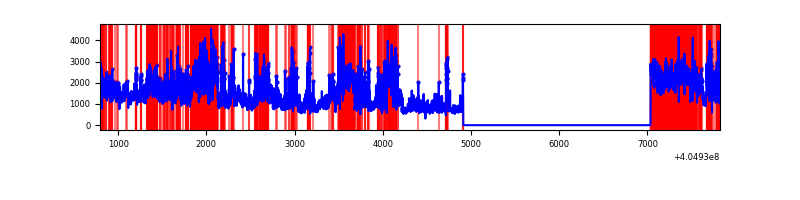 |
Top three noisy pixels from each quadrant. If the there are fewer than three noisy pixels in the level2.evt file, extra rows are filled as -1
| Pixel properties | Quadrant properties | ||||||
|---|---|---|---|---|---|---|---|
| Quadrant | DetID | PixID | Counts | Sigma | Mean | Median | Sigma |
| A | 10 | 83 | 405033 | 3513.7 | 568 | 558 | 115.1 |
| A | 13 | 248 | 371231 | 3220.06 | 568 | 558 | 115.1 |
| A | 12 | 189 | 58156 | 500.36 | 568 | 558 | 115.1 |
| B | 10 | 245 | 152350 | 1415.03 | 570 | 556 | 107.3 |
| B | 4 | 232 | 124207 | 1152.68 | 570 | 556 | 107.3 |
| B | 0 | 229 | 105008 | 973.71 | 570 | 556 | 107.3 |
| C | 15 | 214 | 208430 | 1641.42 | 548 | 552 | 126.6 |
| C | 2 | 16 | 43423 | 338.51 | 548 | 552 | 126.6 |
| C | 0 | 207 | 40374 | 314.43 | 548 | 552 | 126.6 |
| D | 12 | 235 | 2451456 | 20225.65 | 505 | 492 | 121.2 |
| D | 10 | 203 | 1553764 | 12817.79 | 505 | 492 | 121.2 |
| D | 12 | 227 | 529816 | 4368.05 | 505 | 492 | 121.2 |
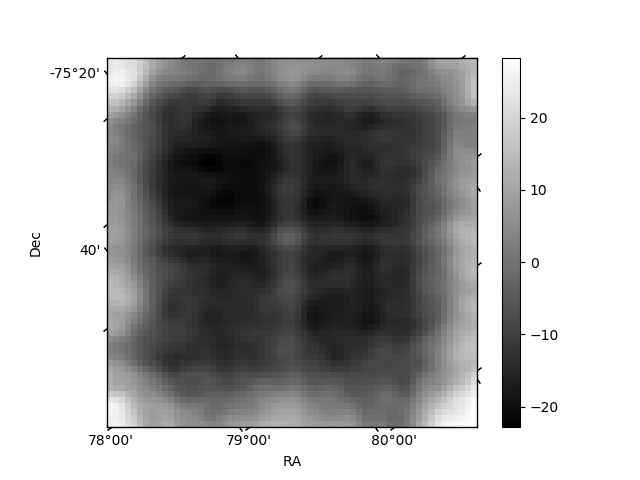
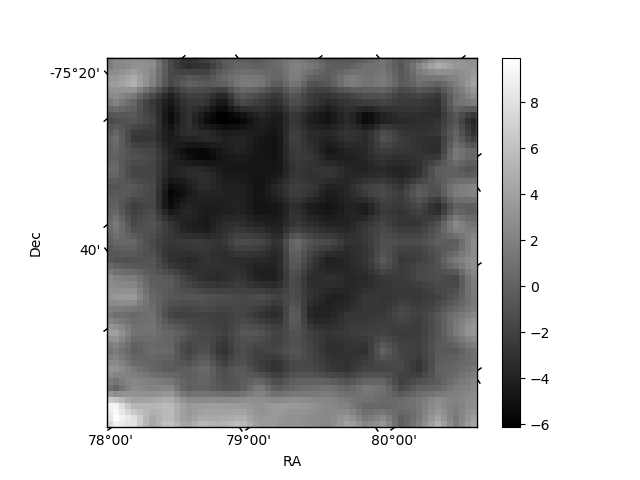
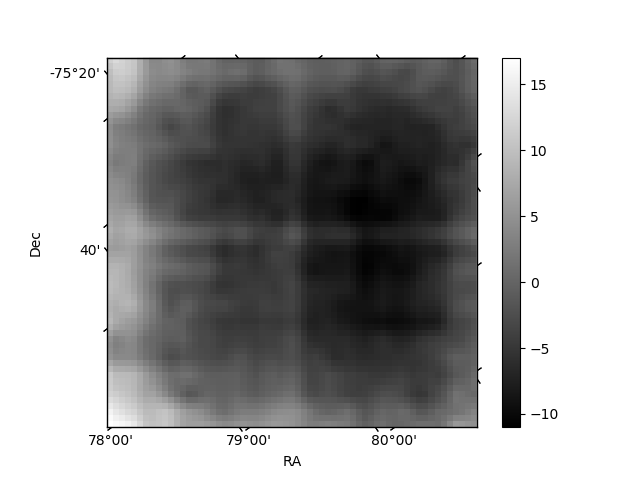
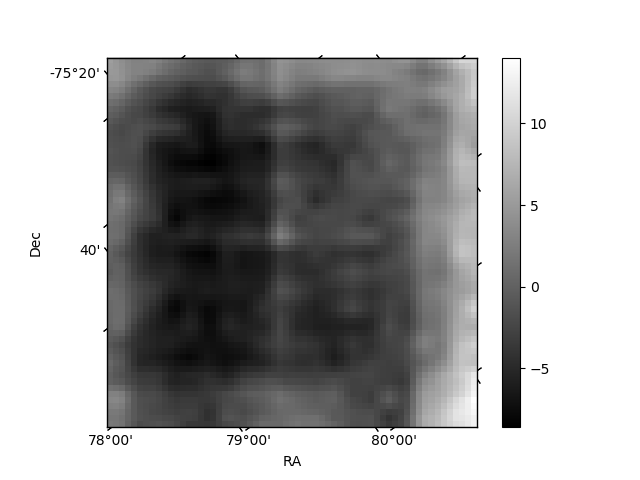
Histogram calculated using DETX and DETY for each event in the final _common_clean file
| Quadrant A | 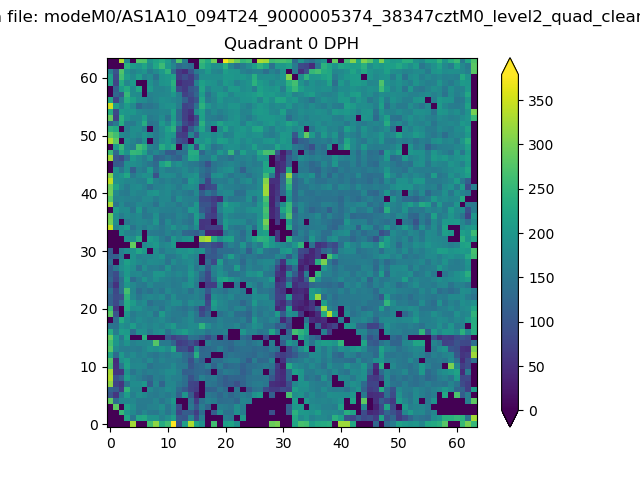 |
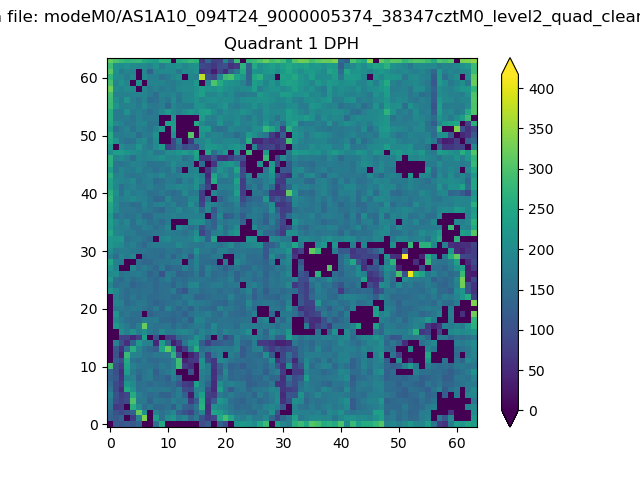 |
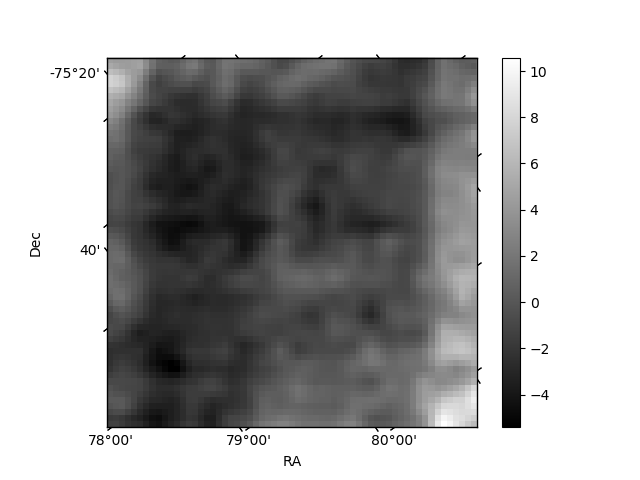
Quadrant B |
|---|---|---|---|
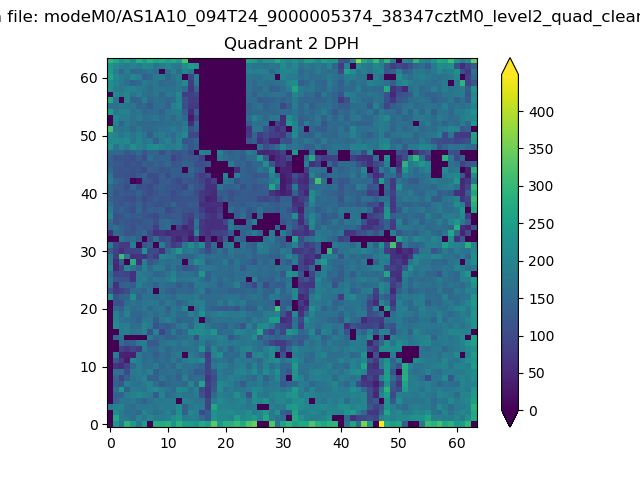
| Quadrant D | 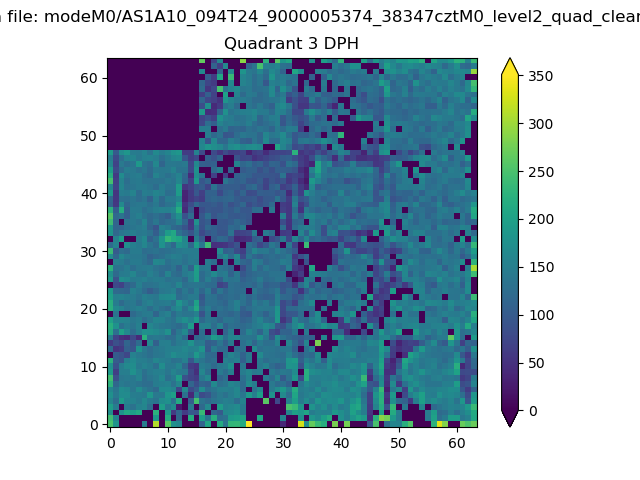 |
 |
Quadrant C |
| Plot type | Count rate plots | Images |
|---|---|---|
| Comparison with Poisson distribution Blue bars denote a histogram of data divided into 1 sec bins. Red curve is a Poisson curve with rate = median count rate of data. |
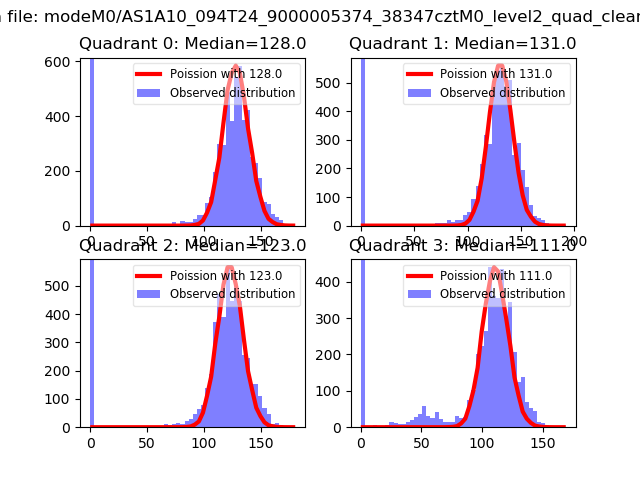 |
 |
| Quadrant-wise count rates Data is divided into 100 sec bins |
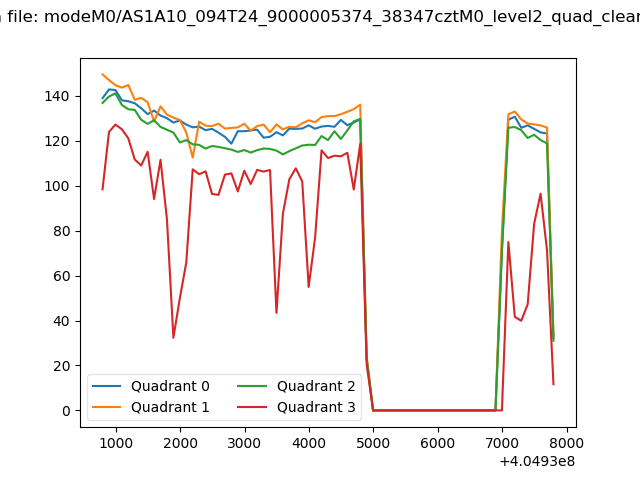 |
|
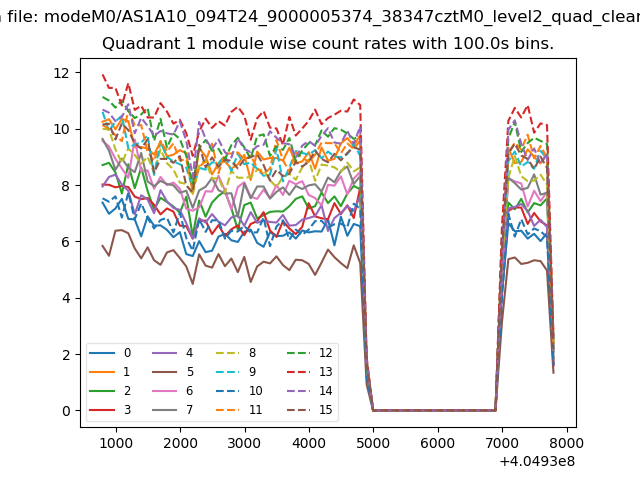
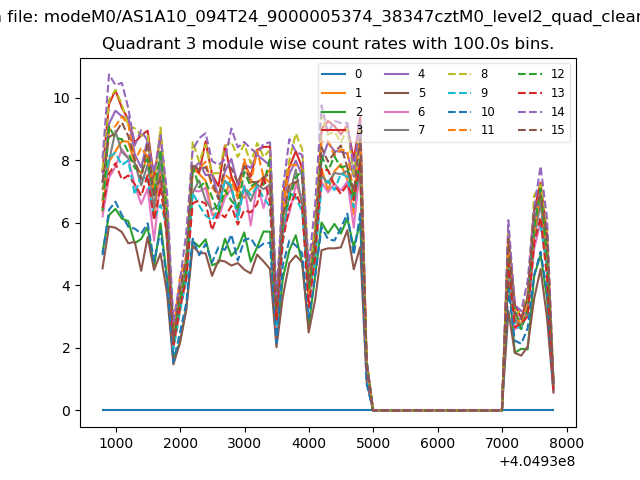
| Module-wise count rates for Quadrant A Data is divided into 100 sec bins |
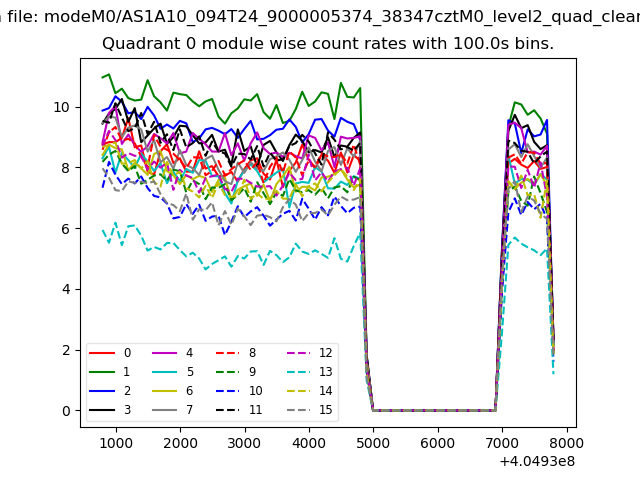 |
 |
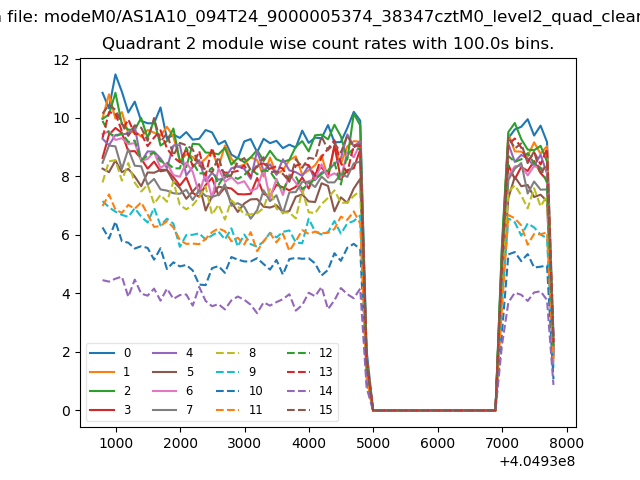
| Module-wise count rates for Quadrant B Data is divided into 100 sec bins |
 |
 |
| Module-wise count rates for Quadrant C Data is divided into 100 sec bins |
 |
 |
| Module-wise count rates for Quadrant D Data is divided into 100 sec bins |
 |
 |
| Parameter | Plot |
|---|---|
| CZT HV Monitor | 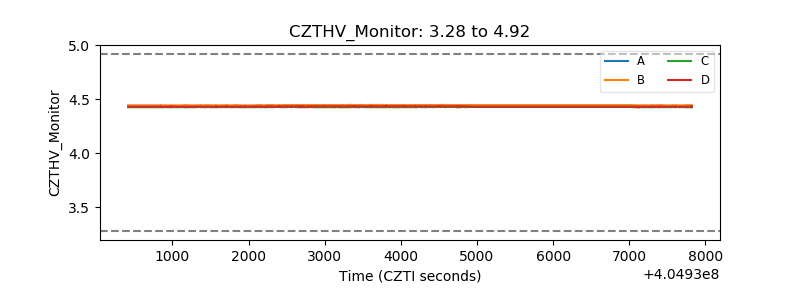 |
| D_VDD | 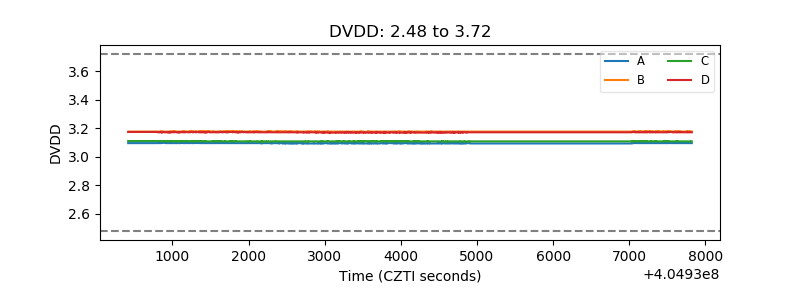 |
| Temperature 1 | 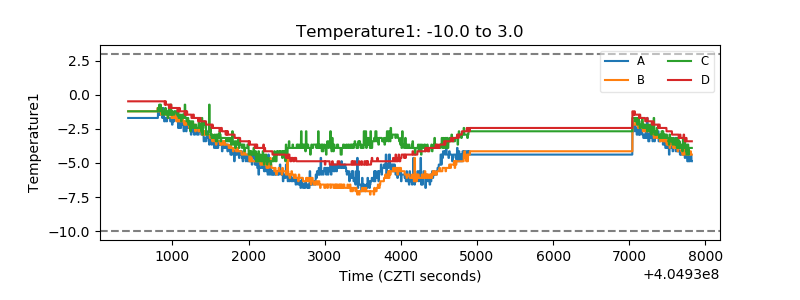 |
| Veto HV Monitor | 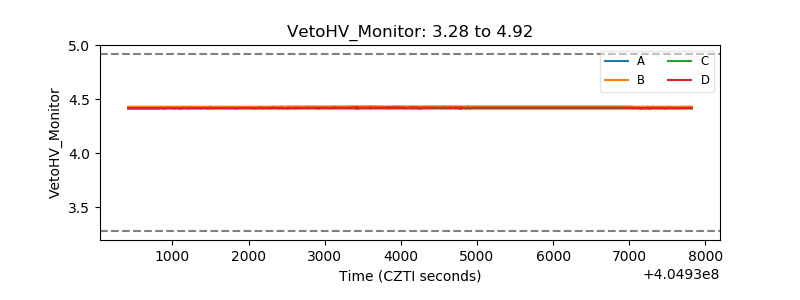 |
| Veto LLD | 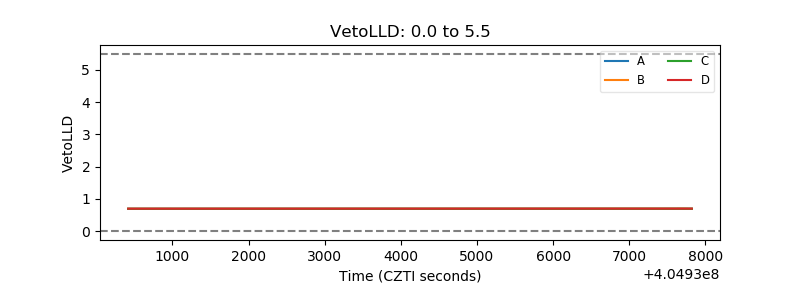 |
| Alpha Counter | 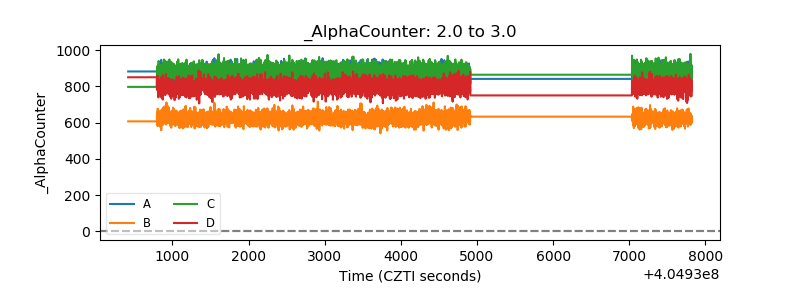 |
| _CPM_Rate | 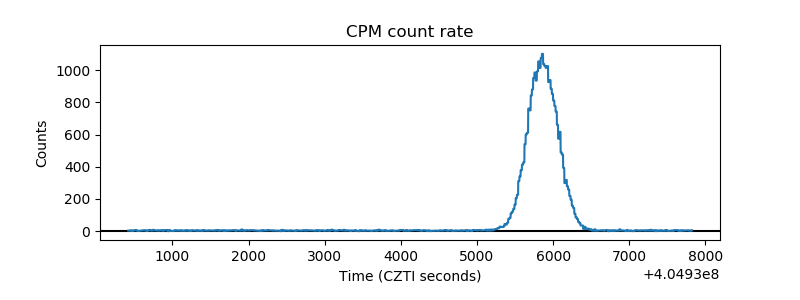 |
| CZT Counter | 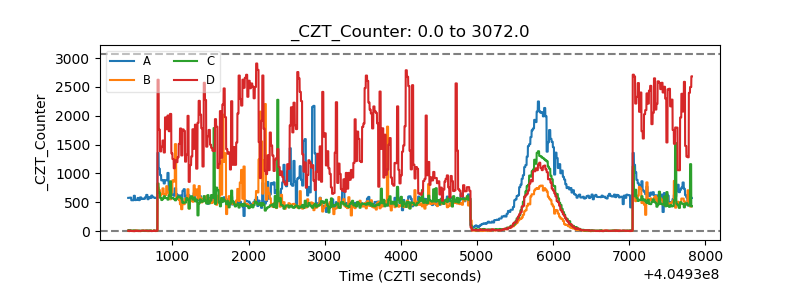 |
| +2.5 Volts monitor | 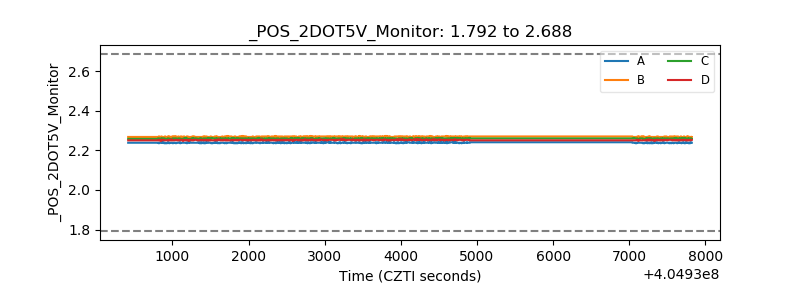 |
| +5 Volts monitor | 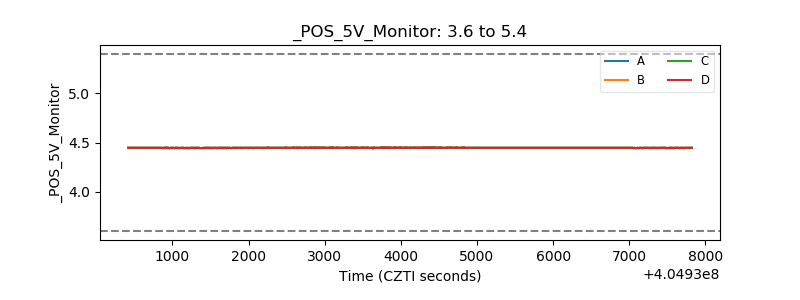 |
| _ROLL_ROT |  |
| _Roll_DEC | 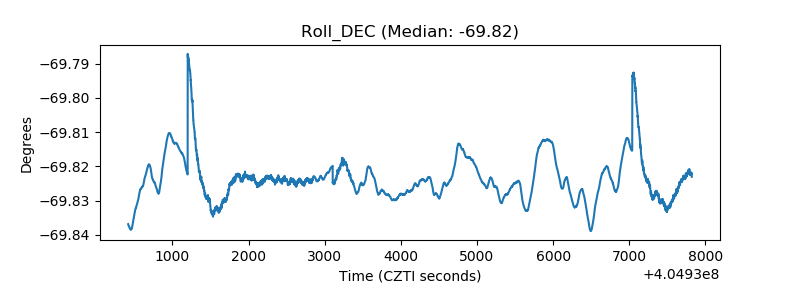 |
| _Roll_RA | 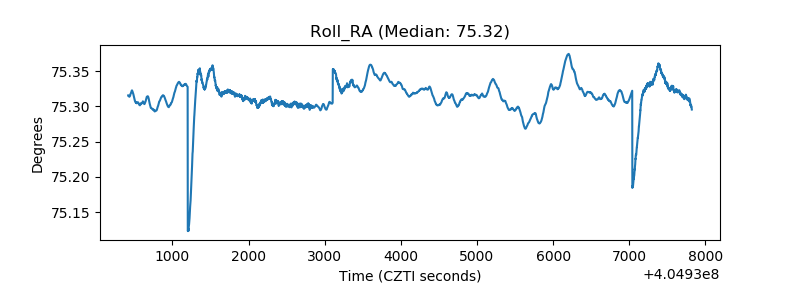 |
| Veto Counter | 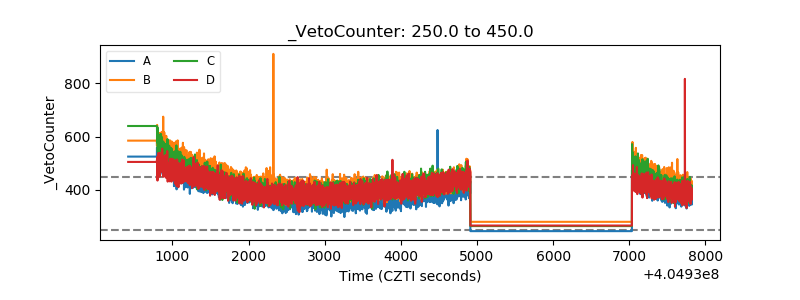 |