| Param | Original file | Final file |
|---|---|---|
| Filename | modeM0/AS1A10_094T24_9000005374_38348cztM0_level2.fits | modeM0/AS1A10_094T24_9000005374_38348cztM0_level2_quad_clean.evt |
| Size (bytes) | 412,056,000 | 84,173,760 |
| Size | 393.0 MB | 80.3 MB |
| Events in quadrant A | 2,692,055 | 597,020 |
| Events in quadrant B | 2,523,233 | 607,378 |
| Events in quadrant C | 2,545,057 | 571,639 |
| Events in quadrant D | 7,107,774 | 425,413 |
| Mode SS | |||
|---|---|---|---|
| Quadrant | BADHDUFLAG | Total packets | Discarded packets |
| A | 0 | 102 | 0 |
| B | 0 | 102 | 0 |
| C | 0 | 102 | 0 |
| D | 0 | 102 | 0 |
| Mode M0 | |||
|---|---|---|---|
| Quadrant | BADHDUFLAG | Total packets | Discarded packets |
| A | 0 | 11042 | 3 |
| B | 0 | 10828 | 2 |
| C | 0 | 10713 | 2 |
| D | 0 | 24676 | 2 |
| Mode M9 | |||
|---|---|---|---|
| Quadrant | BADHDUFLAG | Total packets | Discarded packets |
| A | 0 | 27 | 0 |
| B | 0 | 27 | 0 |
| C | 0 | 27 | 0 |
| D | 0 | 28 | 0 |
| Quadrant | Total seconds | Saturated seconds | Saturation percentage |
|---|---|---|---|
| A | 4950 | 17 | 0.343434% |
| B | 4950 | 39 | 0.787879% |
| C | 4950 | 28 | 0.565657% |
| D | 4950 | 1162 | 23.474747% |
Noise dominated data is calculated using 1-second bins in cleaned event files. If a bin has >2000 counts, and if more than 50% of those come from <1% of pixels, then it is considered to be noise-dominated and hence unusable.
| Quadrant | # 1 sec bins | Bins with >0 counts | Bins with >2000 counts | High rate bins dominated by noise | Noise dominated (total time) | Noise dominated (detector-on time) | Marked lightcurve |
|---|---|---|---|---|---|---|---|
| A | 7013 | 4951 | 7 | 7 | 0.10% | 0.14% | 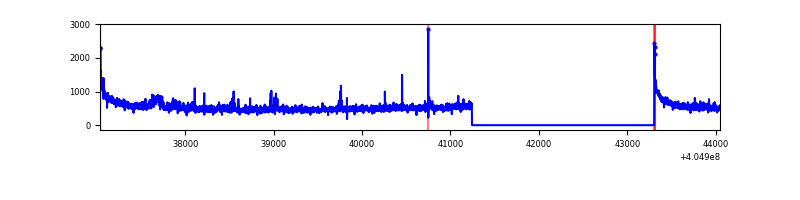 |
| B | 7013 | 4951 | 19 | 19 | 0.27% | 0.38% | 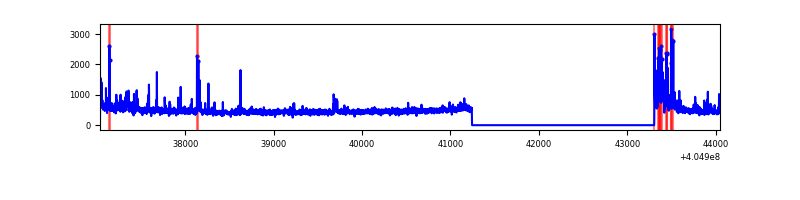 |
| C | 7013 | 4951 | 24 | 24 | 0.34% | 0.48% | 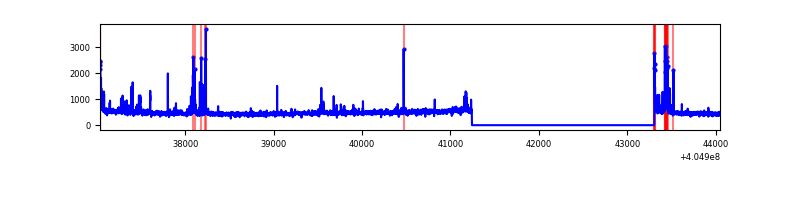 |
| D | 7013 | 4951 | 1250 | 1250 | 17.82% | 25.25% | 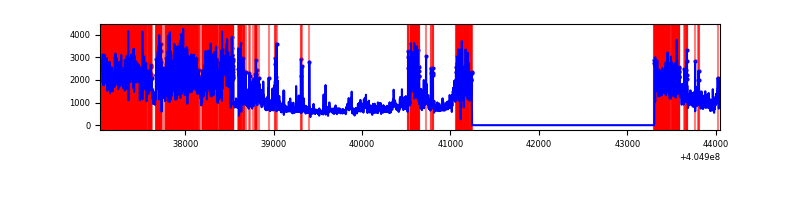 |
Top three noisy pixels from each quadrant. If the there are fewer than three noisy pixels in the level2.evt file, extra rows are filled as -1
| Pixel properties | Quadrant properties | ||||||
|---|---|---|---|---|---|---|---|
| Quadrant | DetID | PixID | Counts | Sigma | Mean | Median | Sigma |
| A | 10 | 83 | 390628 | 3479.22 | 550 | 540 | 112.1 |
| A | 12 | 189 | 111187 | 986.87 | 550 | 540 | 112.1 |
| A | 9 | 143 | 29899 | 261.85 | 550 | 540 | 112.1 |
| B | 0 | 183 | 155495 | 1484.32 | 552 | 538 | 104.4 |
| B | 0 | 229 | 112335 | 1070.89 | 552 | 538 | 104.4 |
| B | 15 | 32 | 23123 | 216.34 | 552 | 538 | 104.4 |
| C | 15 | 214 | 212011 | 1708.47 | 536 | 539 | 123.8 |
| C | 2 | 16 | 86689 | 696.0 | 536 | 539 | 123.8 |
| C | 0 | 207 | 68479 | 548.88 | 536 | 539 | 123.8 |
| D | 12 | 235 | 2191904 | 18434.97 | 494 | 481 | 118.9 |
| D | 10 | 203 | 1144680 | 9625.38 | 494 | 481 | 118.9 |
| D | 12 | 227 | 863265 | 7258.02 | 494 | 481 | 118.9 |
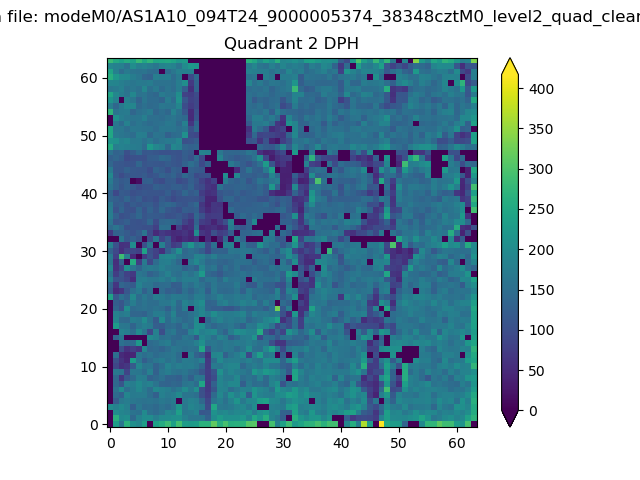
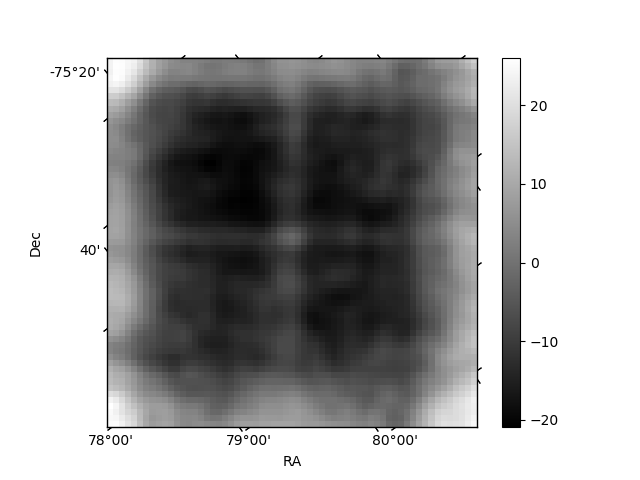
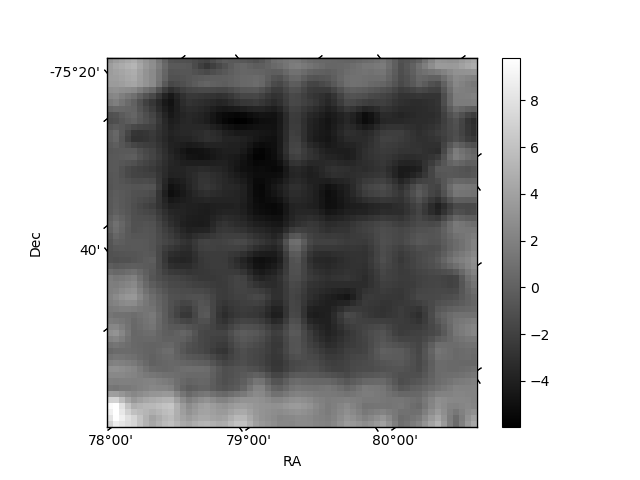
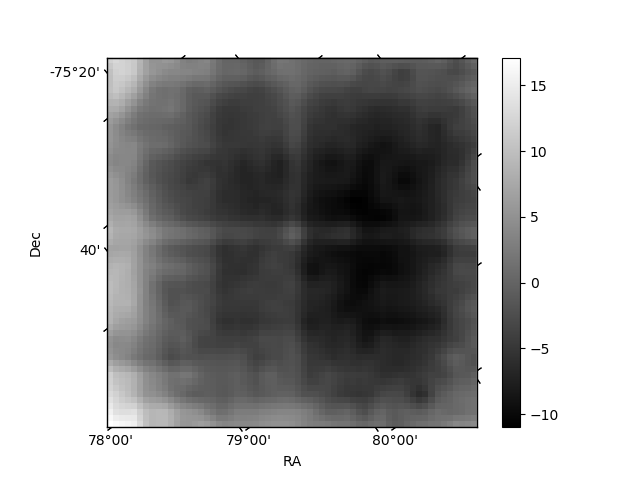
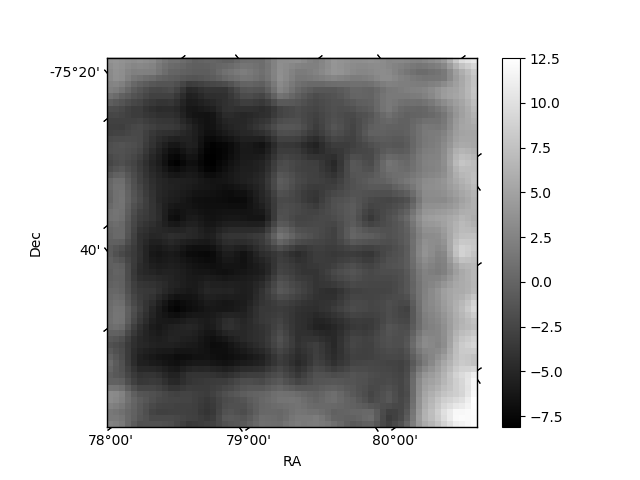
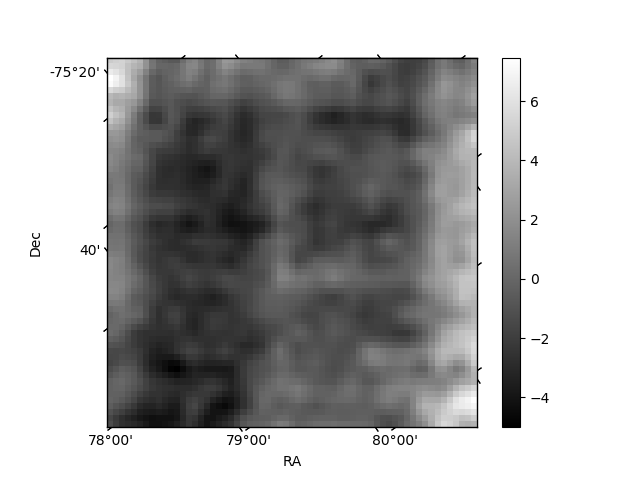
Histogram calculated using DETX and DETY for each event in the final _common_clean file
| Quadrant A | 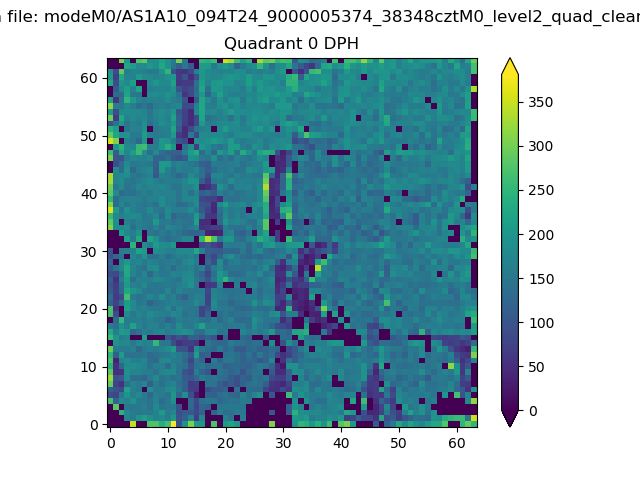 |
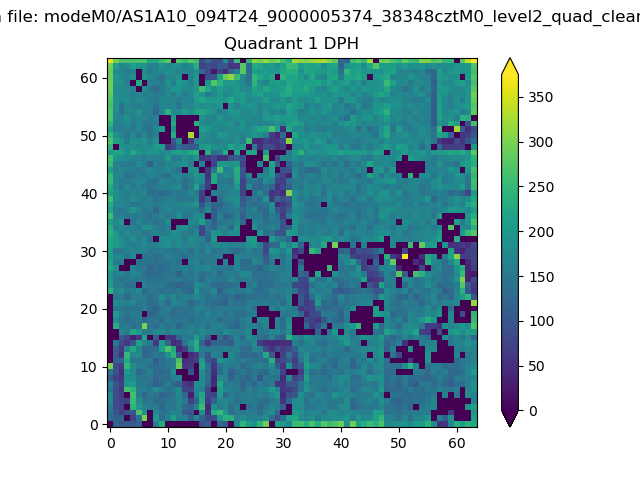 |
Quadrant B |
|---|---|---|---|
| Quadrant D | 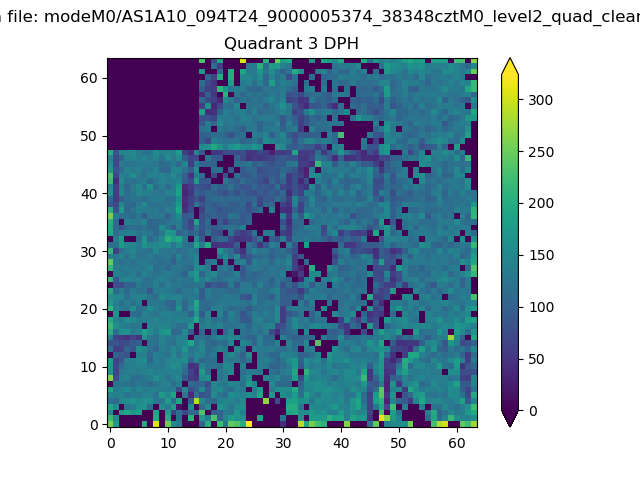 |
 |
Quadrant C |
| Plot type | Count rate plots | Images |
|---|---|---|
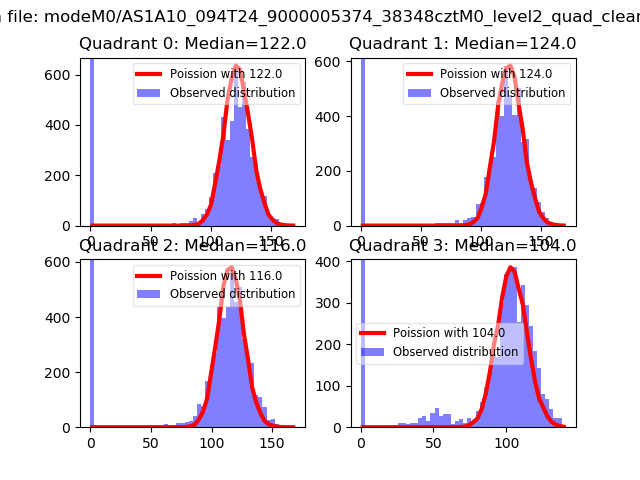
| Comparison with Poisson distribution Blue bars denote a histogram of data divided into 1 sec bins. Red curve is a Poisson curve with rate = median count rate of data. |
 |
 |
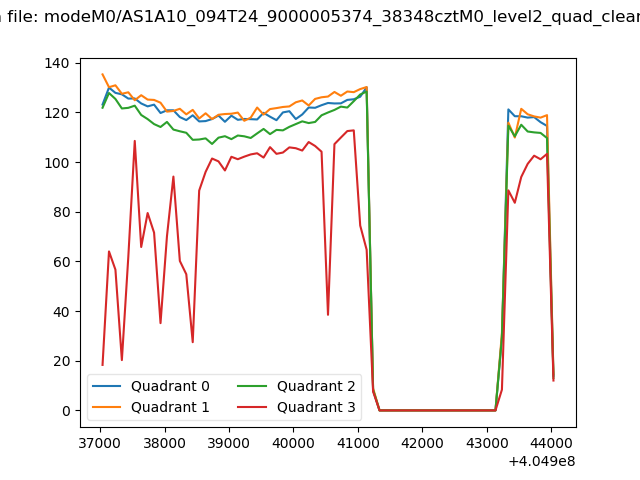
| Quadrant-wise count rates Data is divided into 100 sec bins |
 |
|
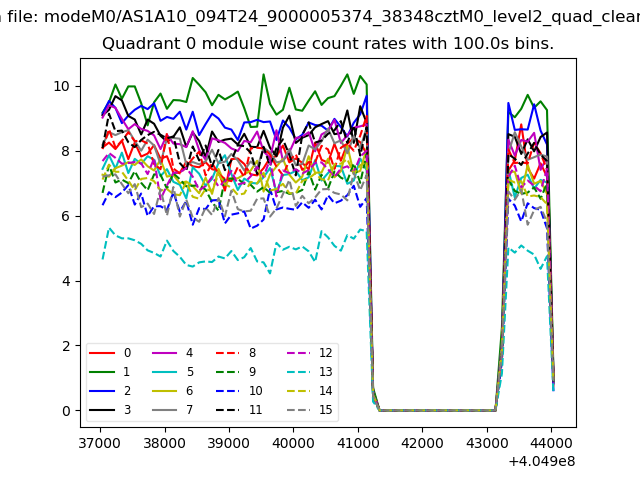
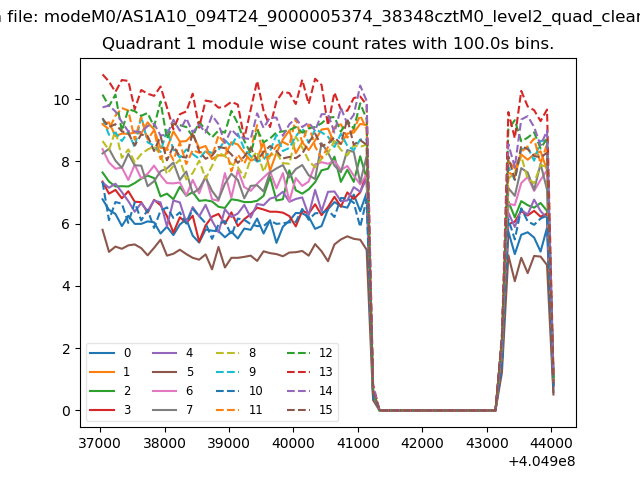
| Module-wise count rates for Quadrant A Data is divided into 100 sec bins |
 |
 |
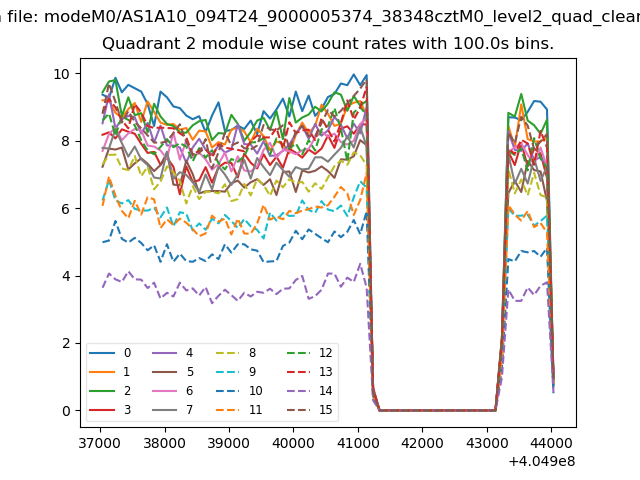
| Module-wise count rates for Quadrant B Data is divided into 100 sec bins |
 |
 |
| Module-wise count rates for Quadrant C Data is divided into 100 sec bins |
 |
 |
| Module-wise count rates for Quadrant D Data is divided into 100 sec bins |
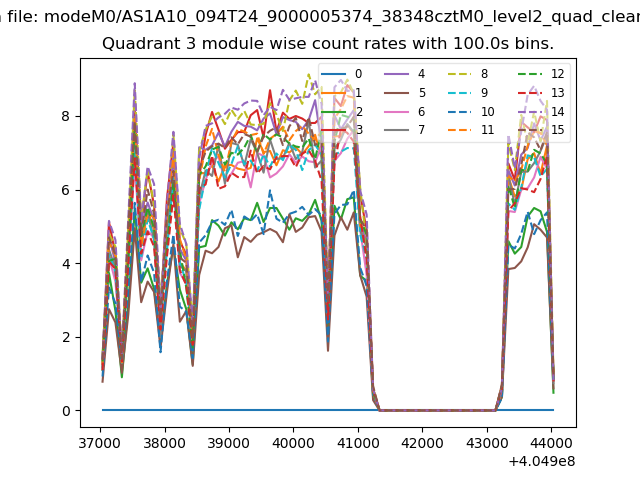 |
 |
| Parameter | Plot |
|---|---|
| CZT HV Monitor | 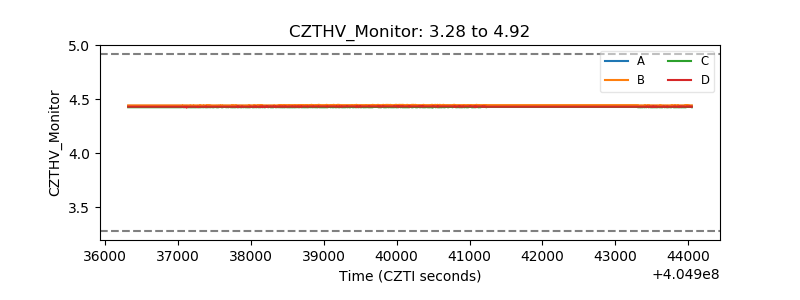 |
| D_VDD | 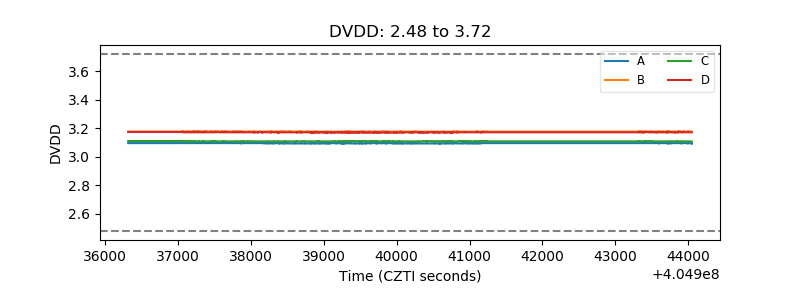 |
| Temperature 1 | 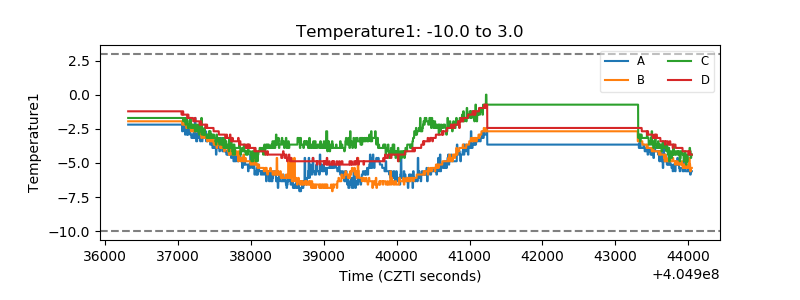 |
| Veto HV Monitor | 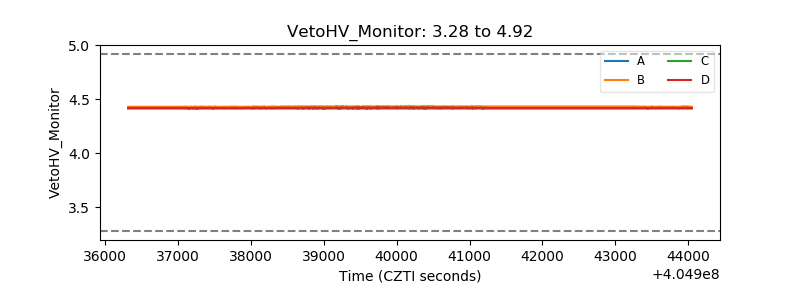 |
| Veto LLD | 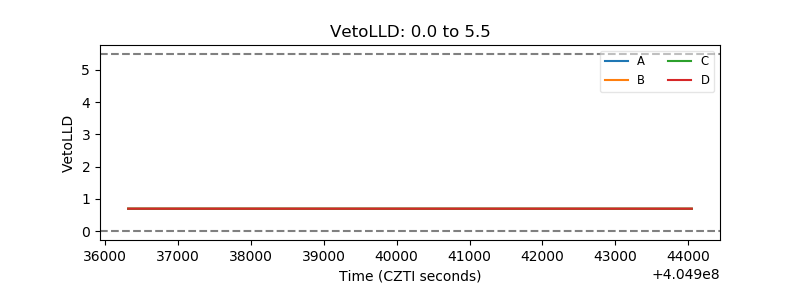 |
| Alpha Counter | 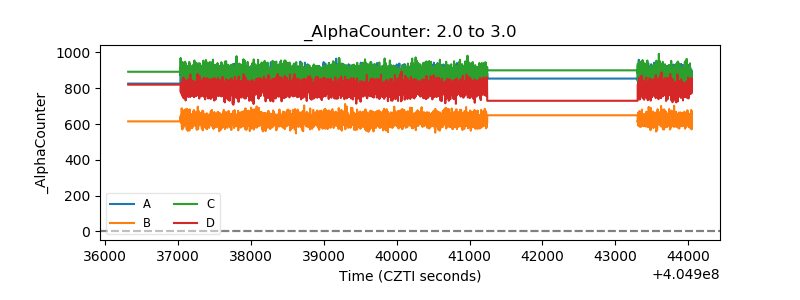 |
| _CPM_Rate | 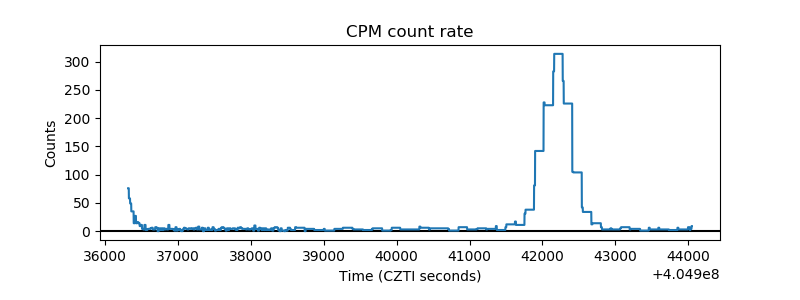 |
| CZT Counter | 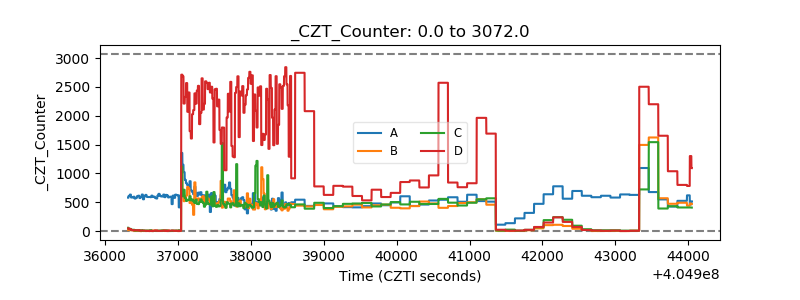 |
| +2.5 Volts monitor |  |
| +5 Volts monitor | 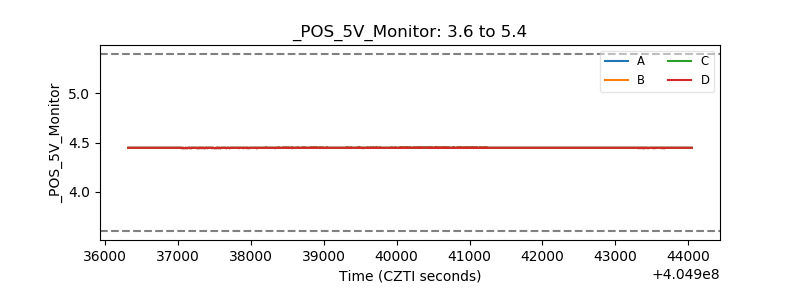 |
| _ROLL_ROT | 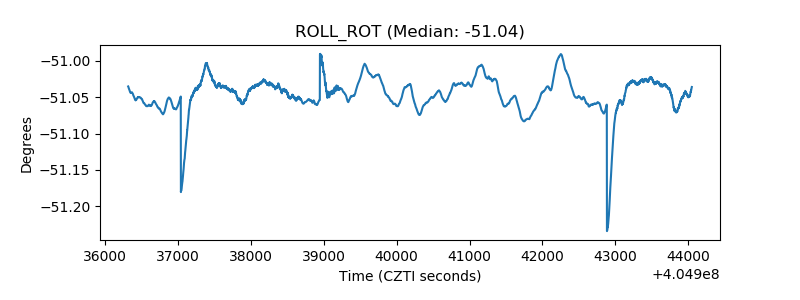 |
| _Roll_DEC | 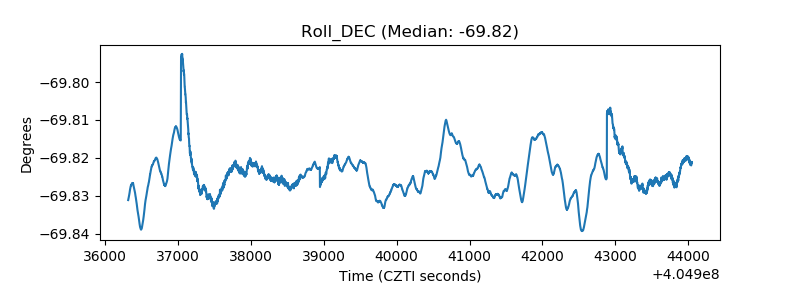 |
| _Roll_RA | 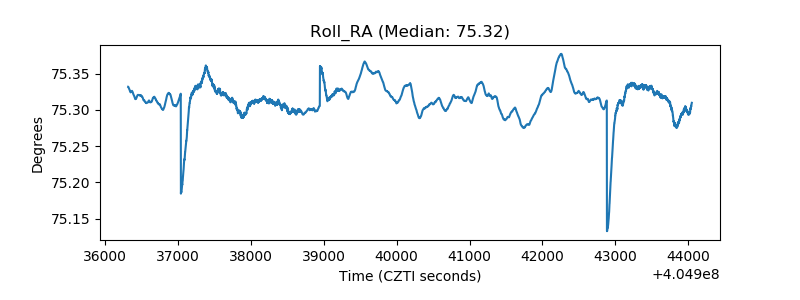 |
| Veto Counter | 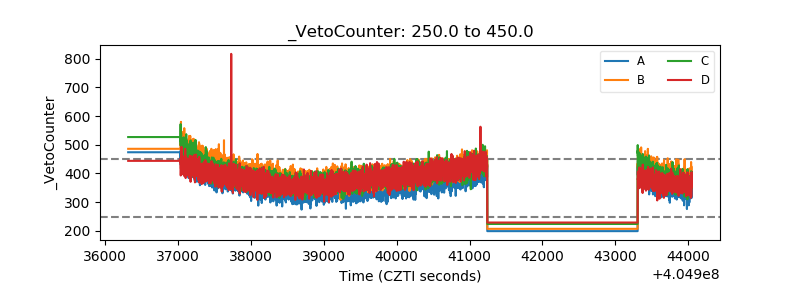 |