| Param | Original file | Final file |
|---|---|---|
| Filename | modeM0/AS1A10_094T24_9000005374_38351cztM0_level2.fits | modeM0/AS1A10_094T24_9000005374_38351cztM0_level2_quad_clean.evt |
| Size (bytes) | 922,757,760 | 167,791,680 |
| Size | 880.0 MB | 160.0 MB |
| Events in quadrant A | 5,760,396 | 1,187,809 |
| Events in quadrant B | 6,165,162 | 1,197,465 |
| Events in quadrant C | 5,205,703 | 1,165,438 |
| Events in quadrant D | 16,197,201 | 787,451 |
| Mode SS | |||
|---|---|---|---|
| Quadrant | BADHDUFLAG | Total packets | Discarded packets |
| A | 0 | 218 | 0 |
| B | 0 | 218 | 0 |
| C | 0 | 218 | 0 |
| D | 0 | 218 | 0 |
| Mode M0 | |||
|---|---|---|---|
| Quadrant | BADHDUFLAG | Total packets | Discarded packets |
| A | 0 | 23814 | 4 |
| B | 0 | 25826 | 3 |
| C | 0 | 22140 | 3 |
| D | 0 | 55625 | 3 |
| Mode M9 | |||
|---|---|---|---|
| Quadrant | BADHDUFLAG | Total packets | Discarded packets |
| A | 0 | 42 | 0 |
| B | 0 | 42 | 0 |
| C | 0 | 42 | 0 |
| D | 0 | 43 | 0 |
| Quadrant | Total seconds | Saturated seconds | Saturation percentage |
|---|---|---|---|
| A | 10720 | 38 | 0.354478% |
| B | 10720 | 243 | 2.266791% |
| C | 10720 | 16 | 0.149254% |
| D | 10720 | 2954 | 27.555970% |
Noise dominated data is calculated using 1-second bins in cleaned event files. If a bin has >2000 counts, and if more than 50% of those come from <1% of pixels, then it is considered to be noise-dominated and hence unusable.
| Quadrant | # 1 sec bins | Bins with >0 counts | Bins with >2000 counts | High rate bins dominated by noise | Noise dominated (total time) | Noise dominated (detector-on time) | Marked lightcurve |
|---|---|---|---|---|---|---|---|
| A | 13525 | 10722 | 16 | 16 | 0.12% | 0.15% | 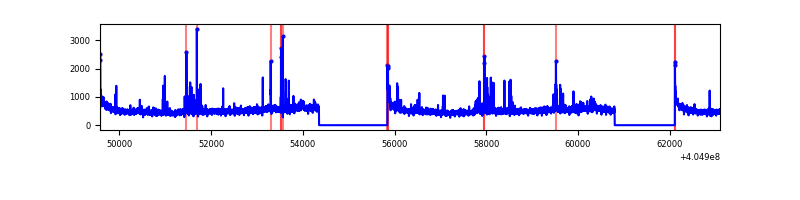 |
| B | 13525 | 10722 | 123 | 123 | 0.91% | 1.15% | 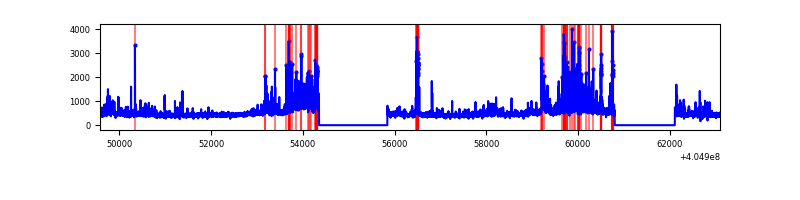 |
| C | 13525 | 10722 | 4 | 4 | 0.03% | 0.04% | 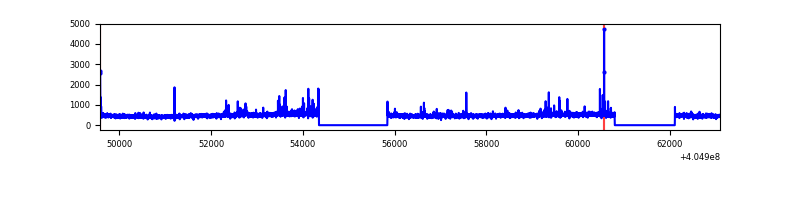 |
| D | 13525 | 10721 | 2812 | 2812 | 20.79% | 26.23% | 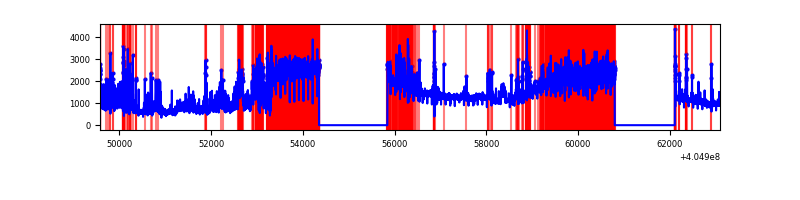 |
Top three noisy pixels from each quadrant. If the there are fewer than three noisy pixels in the level2.evt file, extra rows are filled as -1
| Pixel properties | Quadrant properties | ||||||
|---|---|---|---|---|---|---|---|
| Quadrant | DetID | PixID | Counts | Sigma | Mean | Median | Sigma |
| A | 10 | 83 | 746471 | 3133.32 | 1182 | 1155 | 237.9 |
| A | 13 | 248 | 196323 | 820.49 | 1182 | 1155 | 237.9 |
| A | 12 | 189 | 129228 | 538.42 | 1182 | 1155 | 237.9 |
| B | 0 | 229 | 378220 | 1696.47 | 1175 | 1144 | 222.3 |
| B | 0 | 183 | 366679 | 1644.55 | 1175 | 1144 | 222.3 |
| B | 4 | 170 | 157382 | 702.92 | 1175 | 1144 | 222.3 |
| C | 15 | 214 | 458298 | 1689.07 | 1165 | 1171 | 270.6 |
| C | 14 | 254 | 52868 | 191.02 | 1165 | 1171 | 270.6 |
| C | 1 | 23 | 43648 | 156.95 | 1165 | 1171 | 270.6 |
| D | 10 | 203 | 8997479 | 35756.82 | 1035 | 1007 | 251.6 |
| D | 12 | 235 | 1355416 | 5383.15 | 1035 | 1007 | 251.6 |
| D | 2 | 16 | 664930 | 2638.79 | 1035 | 1007 | 251.6 |
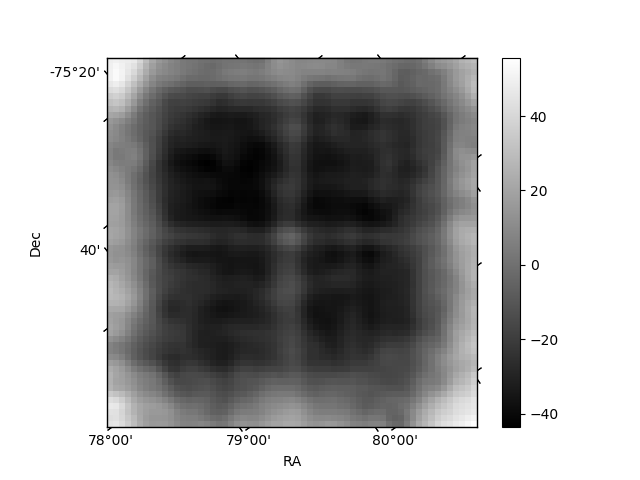
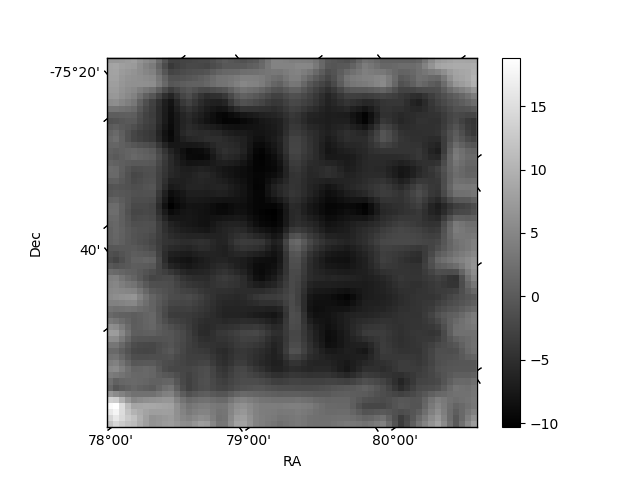
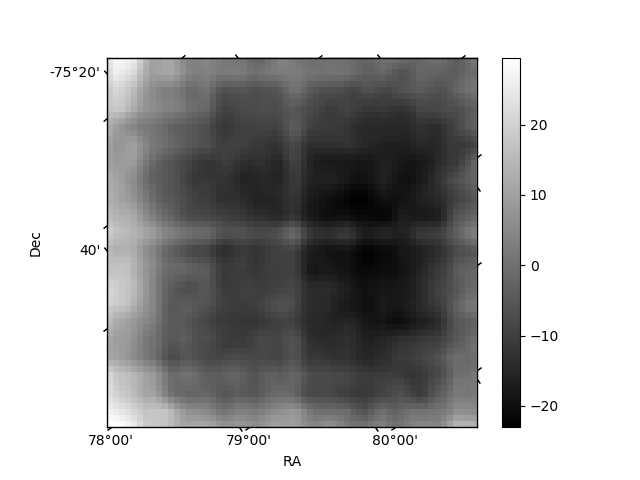
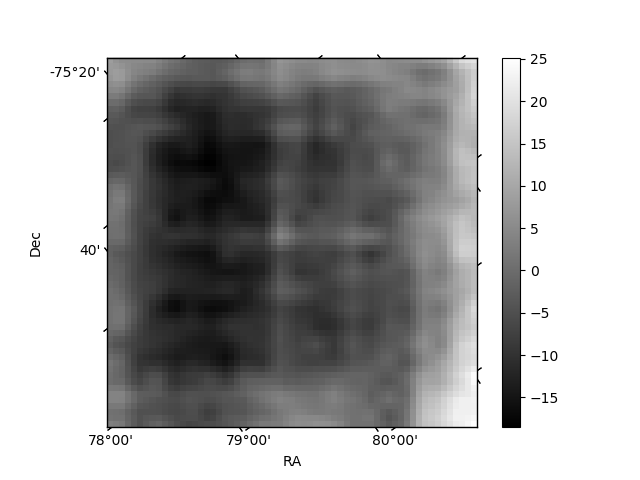
Histogram calculated using DETX and DETY for each event in the final _common_clean file
| Quadrant A | 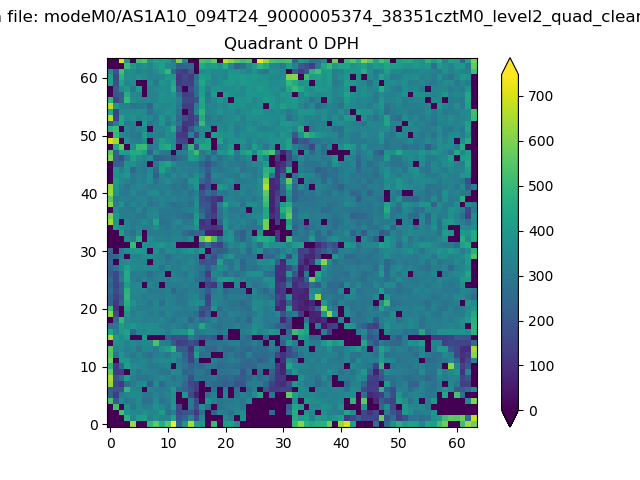 |
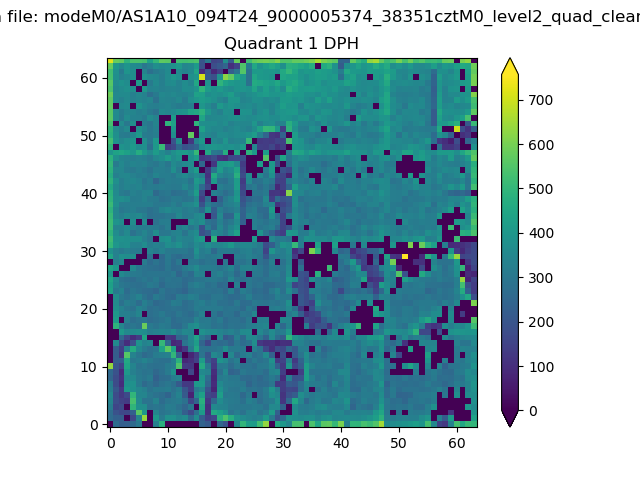 |
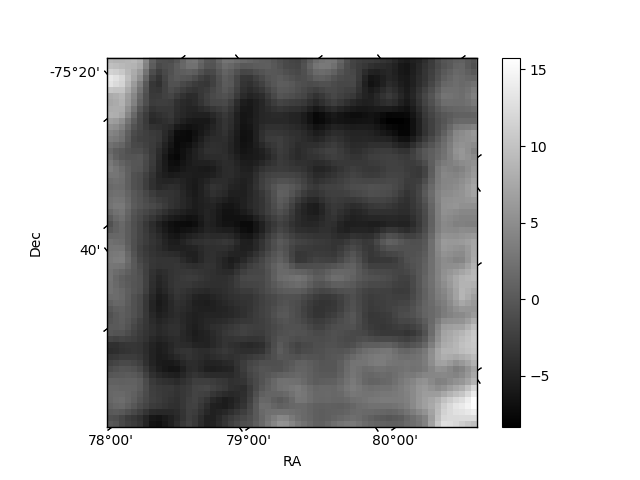
Quadrant B |
|---|---|---|---|
| Quadrant D | 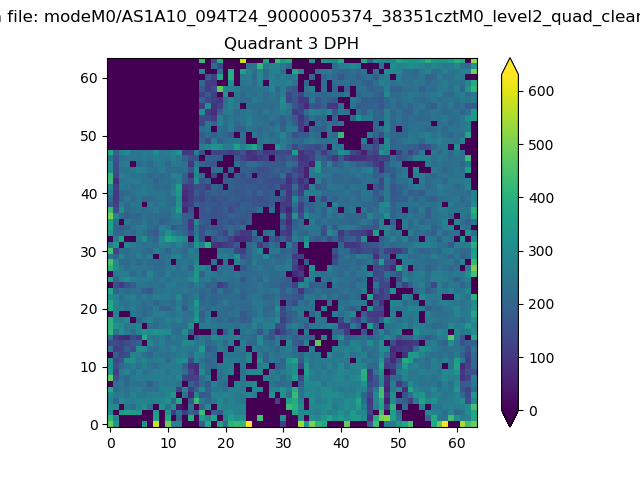 |
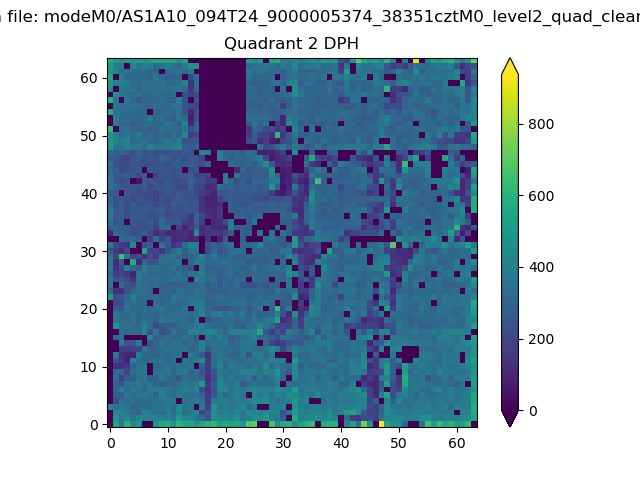 |
Quadrant C |
| Plot type | Count rate plots | Images |
|---|---|---|
| Comparison with Poisson distribution Blue bars denote a histogram of data divided into 1 sec bins. Red curve is a Poisson curve with rate = median count rate of data. |
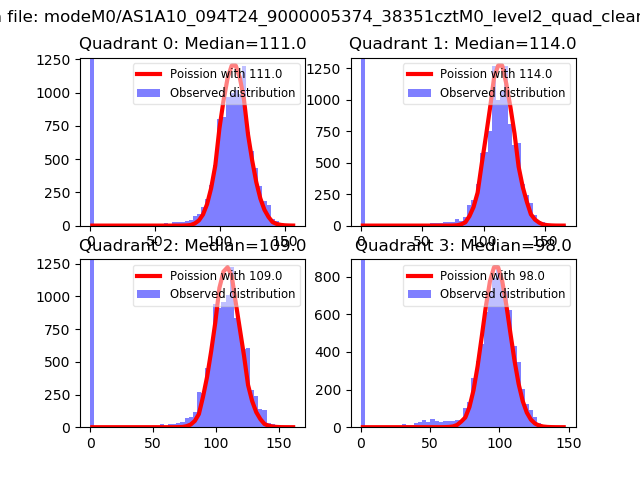 |
 |
| Quadrant-wise count rates Data is divided into 100 sec bins |
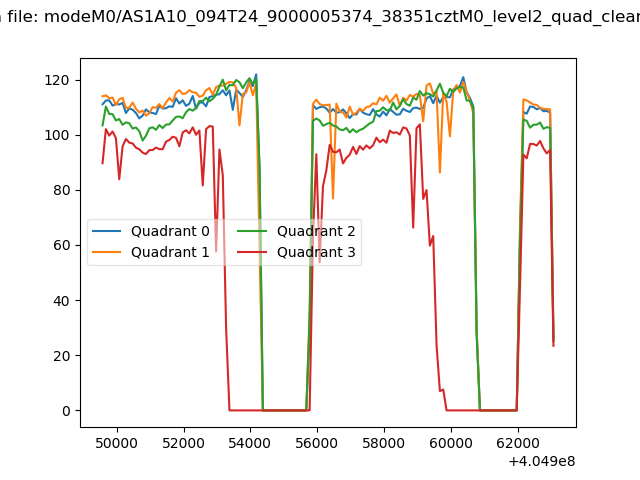 |
|
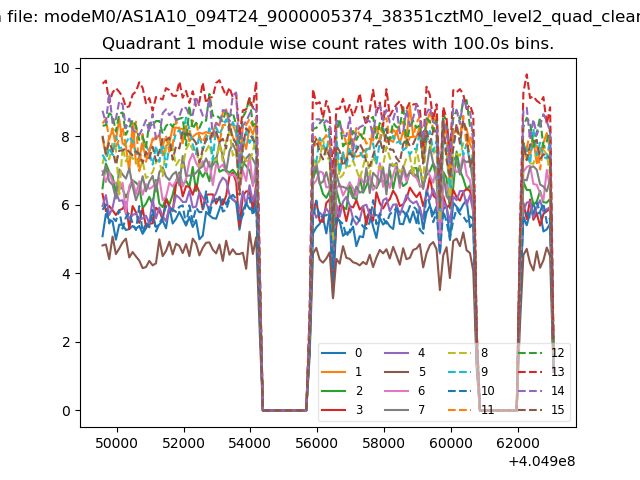
| Module-wise count rates for Quadrant A Data is divided into 100 sec bins |
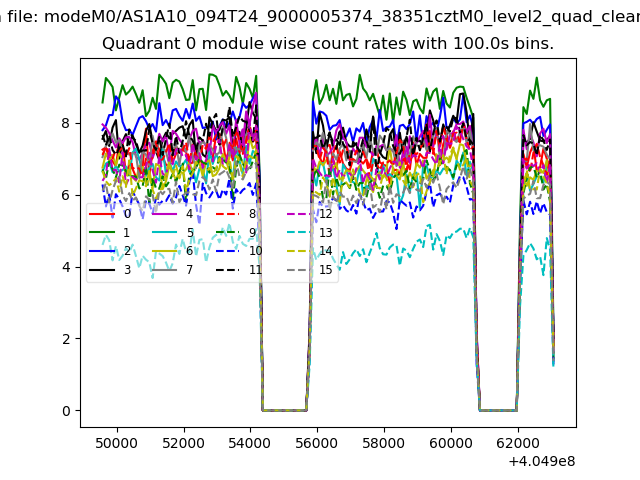 |
 |
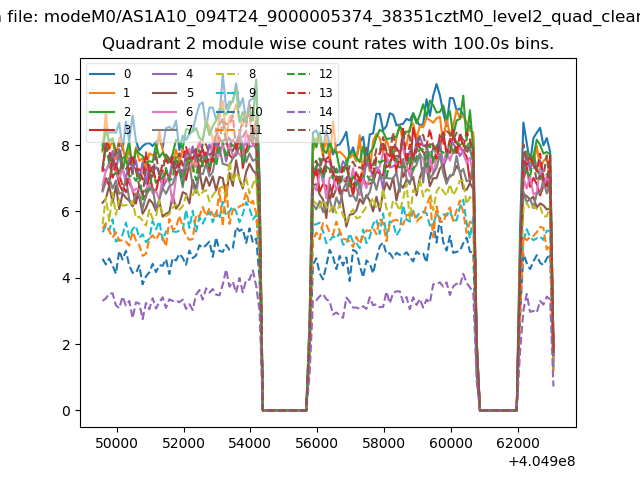
| Module-wise count rates for Quadrant B Data is divided into 100 sec bins |
 |
 |
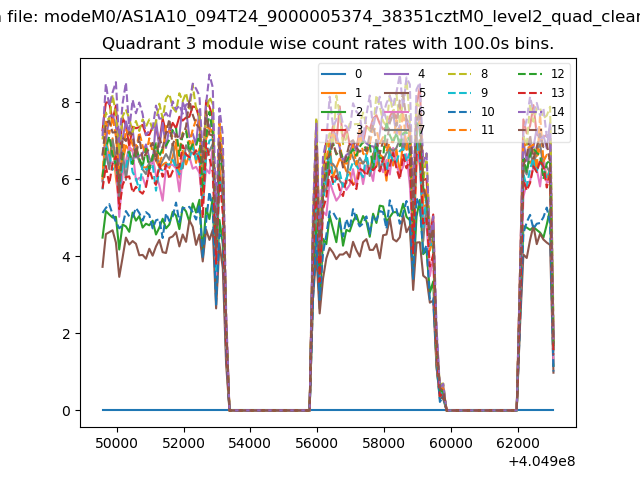
| Module-wise count rates for Quadrant C Data is divided into 100 sec bins |
 |
 |
| Module-wise count rates for Quadrant D Data is divided into 100 sec bins |
 |
 |
| Parameter | Plot |
|---|---|
| CZT HV Monitor |  |
| D_VDD | 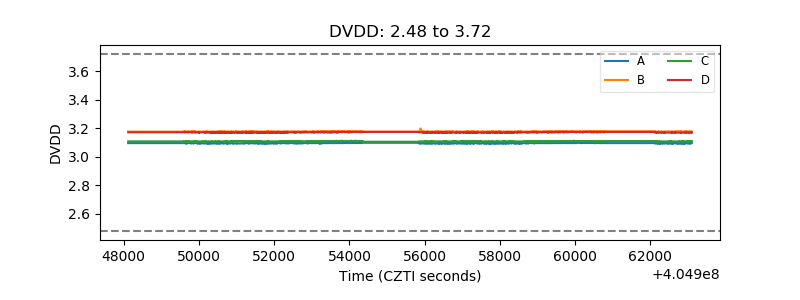 |
| Temperature 1 | 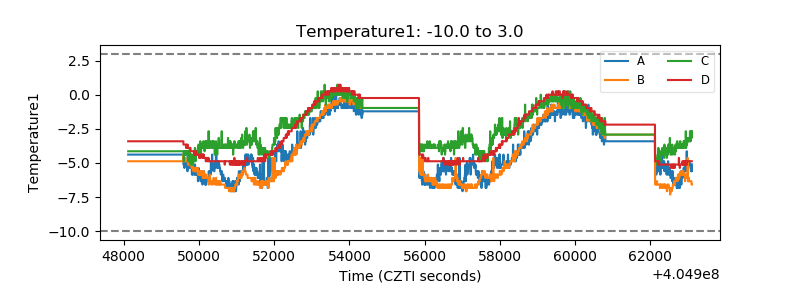 |
| Veto HV Monitor | 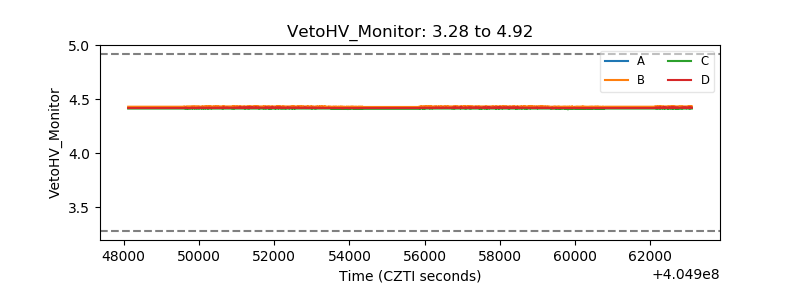 |
| Veto LLD | 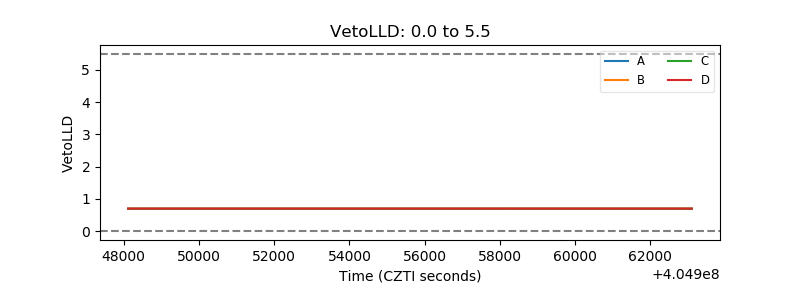 |
| Alpha Counter | 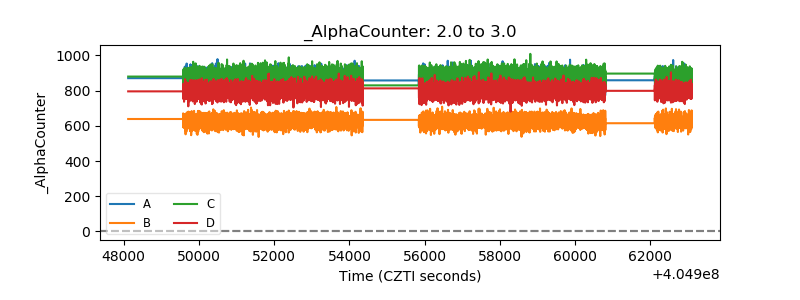 |
| _CPM_Rate | 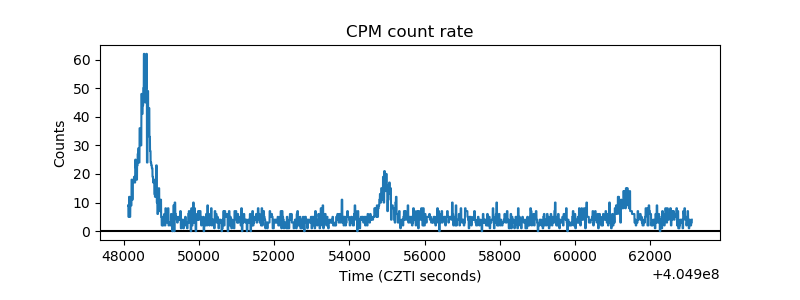 |
| CZT Counter | 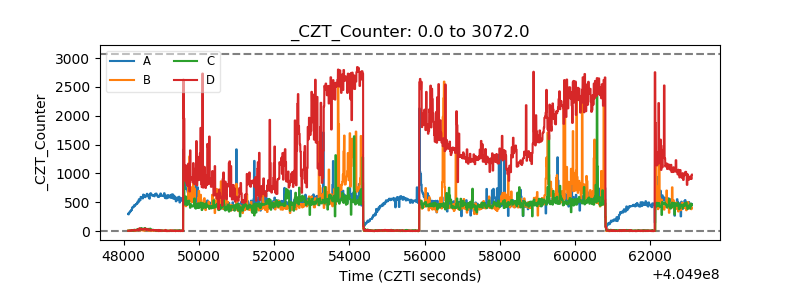 |
| +2.5 Volts monitor | 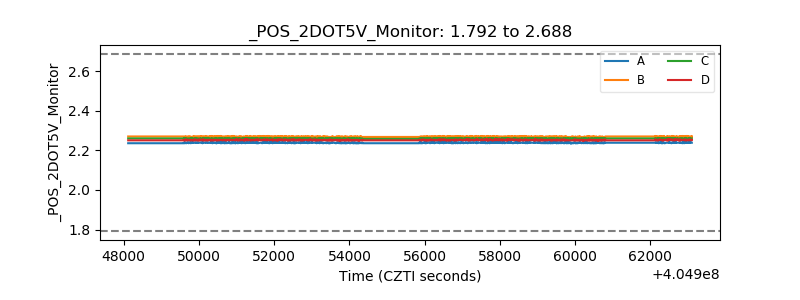 |
| +5 Volts monitor | 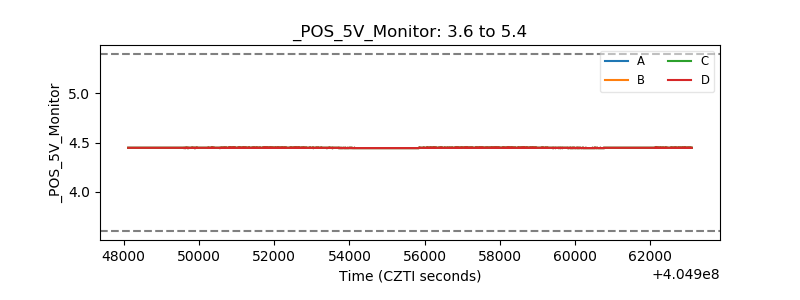 |
| _ROLL_ROT | 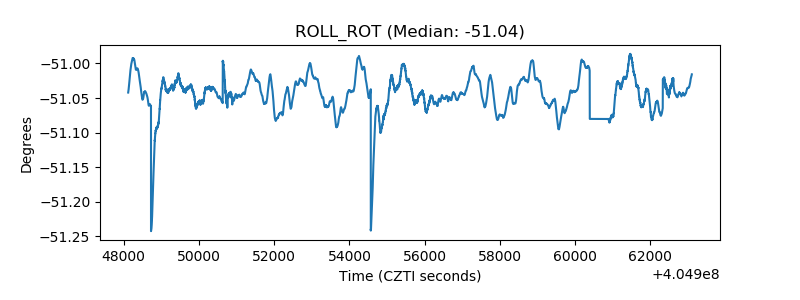 |
| _Roll_DEC | 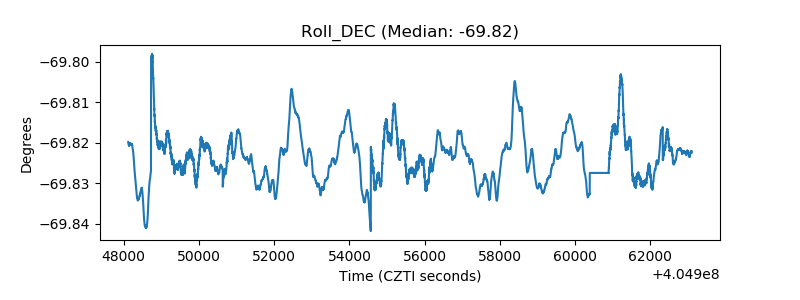 |
| _Roll_RA | 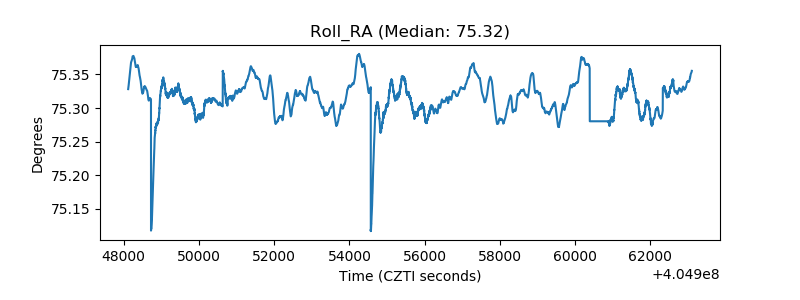 |
| Veto Counter | 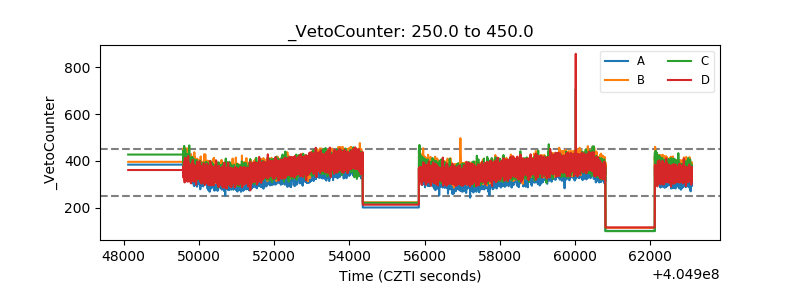 |