| Param | Original file | Final file |
|---|---|---|
| Filename | modeM0/AS1A10_094T24_9000005374_38356cztM0_level2.fits | modeM0/AS1A10_094T24_9000005374_38356cztM0_level2_quad_clean.evt |
| Size (bytes) | 1,563,707,520 | 260,913,600 |
| Size | 1.5 GB | 248.8 MB |
| Events in quadrant A | 10,985,063 | 1,817,511 |
| Events in quadrant B | 9,527,963 | 1,856,383 |
| Events in quadrant C | 8,152,224 | 1,804,388 |
| Events in quadrant D | 27,917,954 | 1,258,319 |
| Mode SS | |||
|---|---|---|---|
| Quadrant | BADHDUFLAG | Total packets | Discarded packets |
| A | 0 | 344 | 0 |
| B | 0 | 344 | 0 |
| C | 0 | 344 | 0 |
| D | 0 | 344 | 0 |
| Mode M0 | |||
|---|---|---|---|
| Quadrant | BADHDUFLAG | Total packets | Discarded packets |
| A | 0 | 42771 | 5 |
| B | 0 | 39565 | 4 |
| C | 0 | 34499 | 4 |
| D | 0 | 95011 | 4 |
| Mode M9 | |||
|---|---|---|---|
| Quadrant | BADHDUFLAG | Total packets | Discarded packets |
| A | 0 | 55 | 0 |
| B | 0 | 55 | 0 |
| C | 0 | 55 | 0 |
| D | 0 | 55 | 0 |
| Quadrant | Total seconds | Saturated seconds | Saturation percentage |
|---|---|---|---|
| A | 16861 | 450 | 2.668881% |
| B | 16861 | 209 | 1.239547% |
| C | 16861 | 43 | 0.255026% |
| D | 16861 | 4654 | 27.602159% |
Noise dominated data is calculated using 1-second bins in cleaned event files. If a bin has >2000 counts, and if more than 50% of those come from <1% of pixels, then it is considered to be noise-dominated and hence unusable.
| Quadrant | # 1 sec bins | Bins with >0 counts | Bins with >2000 counts | High rate bins dominated by noise | Noise dominated (total time) | Noise dominated (detector-on time) | Marked lightcurve |
|---|---|---|---|---|---|---|---|
| A | 22293 | 16865 | 391 | 391 | 1.75% | 2.32% | 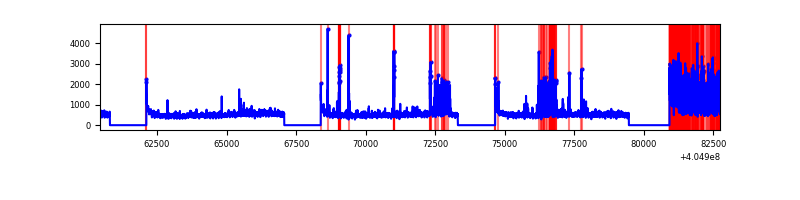 |
| B | 22293 | 16865 | 99 | 99 | 0.44% | 0.59% | 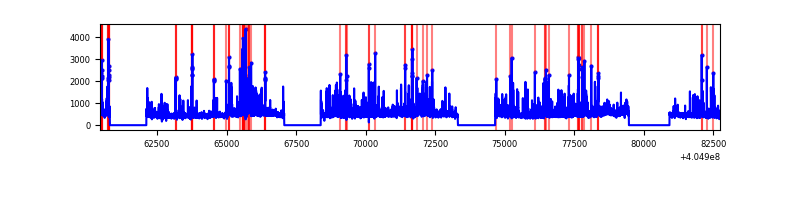 |
| C | 22293 | 16865 | 25 | 25 | 0.11% | 0.15% | 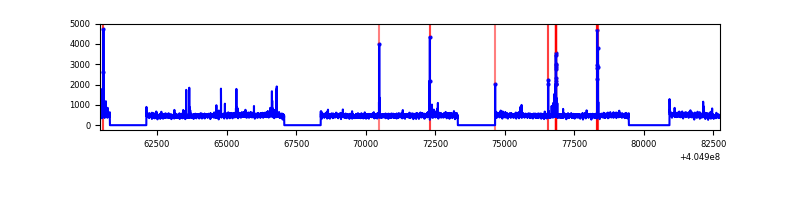 |
| D | 22293 | 16865 | 5136 | 5136 | 23.04% | 30.45% | 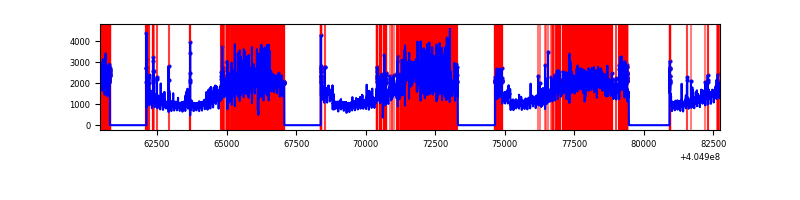 |
Top three noisy pixels from each quadrant. If the there are fewer than three noisy pixels in the level2.evt file, extra rows are filled as -1
| Pixel properties | Quadrant properties | ||||||
|---|---|---|---|---|---|---|---|
| Quadrant | DetID | PixID | Counts | Sigma | Mean | Median | Sigma |
| A | 15 | 222 | 2145619 | 5733.37 | 1868 | 1828 | 373.9 |
| A | 10 | 83 | 1140500 | 3045.27 | 1868 | 1828 | 373.9 |
| A | 12 | 189 | 171904 | 454.85 | 1868 | 1828 | 373.9 |
| B | 4 | 170 | 661110 | 1853.99 | 1868 | 1814 | 355.6 |
| B | 0 | 183 | 384285 | 1075.54 | 1868 | 1814 | 355.6 |
| B | 0 | 229 | 341752 | 955.93 | 1868 | 1814 | 355.6 |
| C | 15 | 214 | 717619 | 1685.48 | 1842 | 1851 | 424.7 |
| C | 12 | 249 | 70087 | 160.68 | 1842 | 1851 | 424.7 |
| C | 0 | 207 | 66665 | 152.62 | 1842 | 1851 | 424.7 |
| D | 10 | 203 | 16325929 | 39642.86 | 1681 | 1632 | 411.8 |
| D | 12 | 227 | 2176028 | 5280.43 | 1681 | 1632 | 411.8 |
| D | 2 | 16 | 951692 | 2307.18 | 1681 | 1632 | 411.8 |
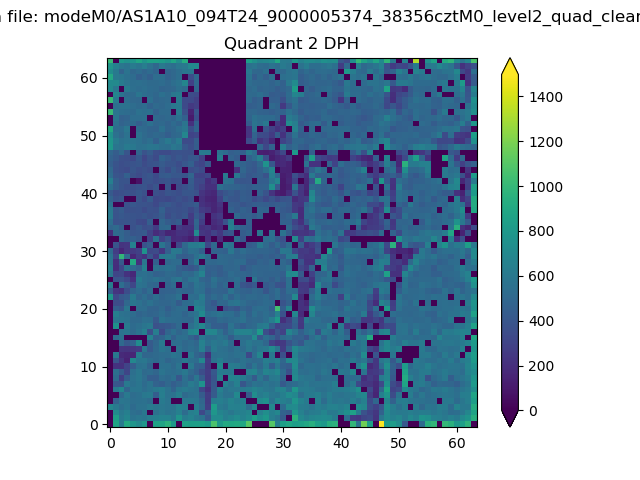
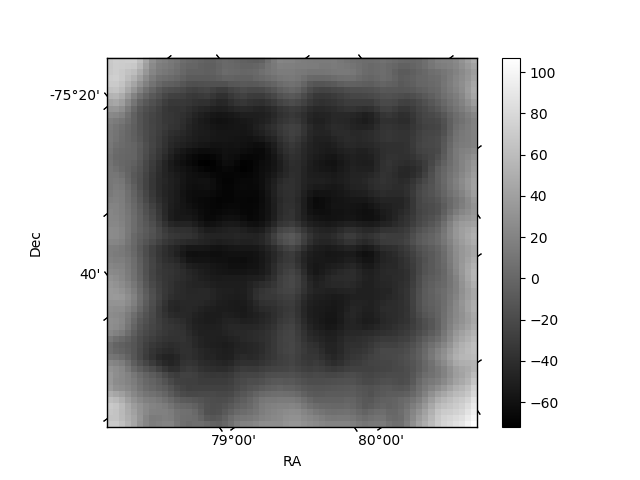
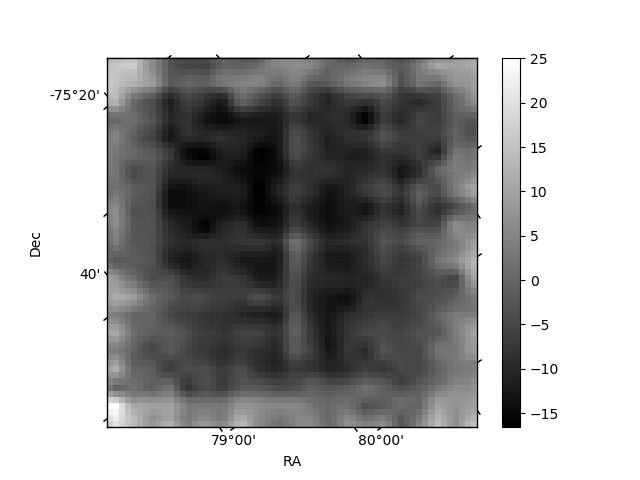
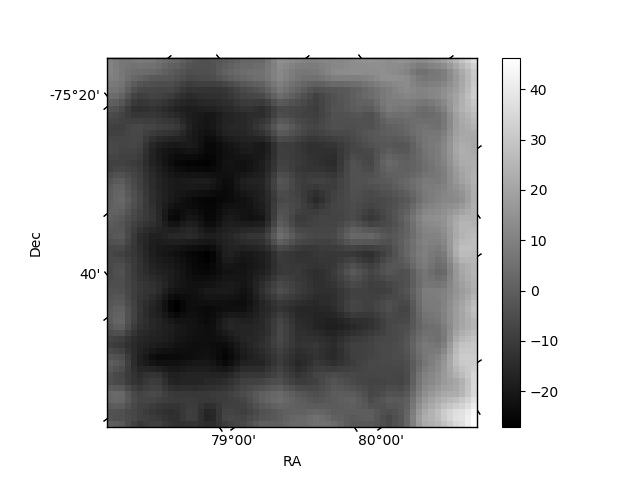
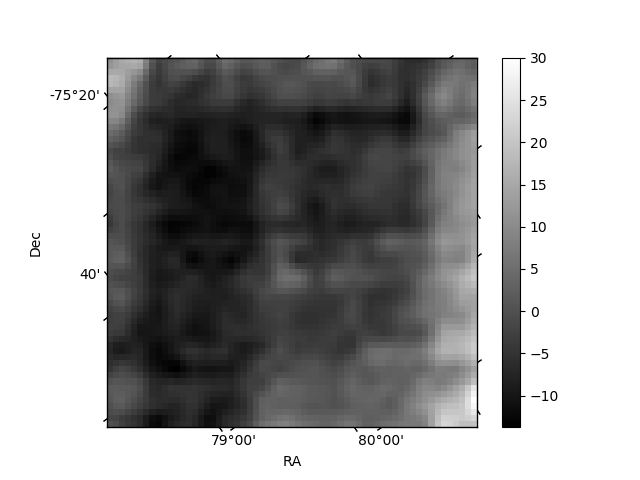
Histogram calculated using DETX and DETY for each event in the final _common_clean file
| Quadrant A | 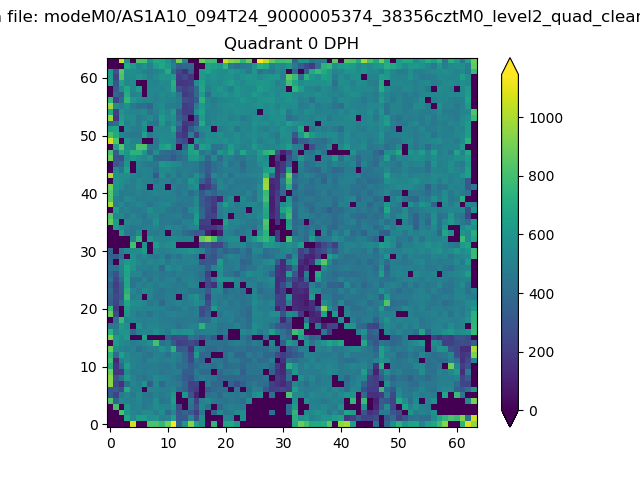 |
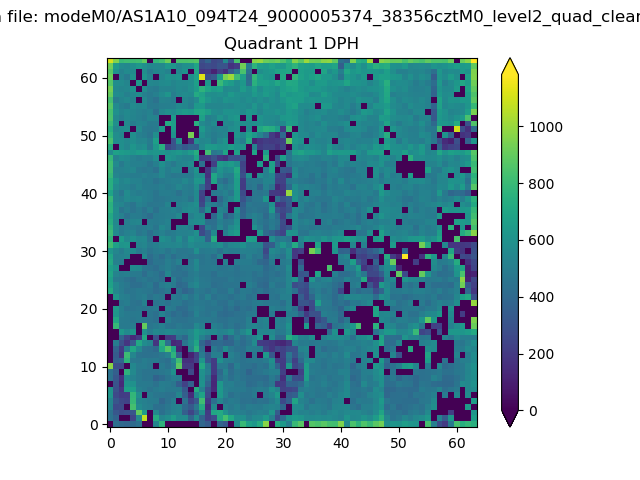 |
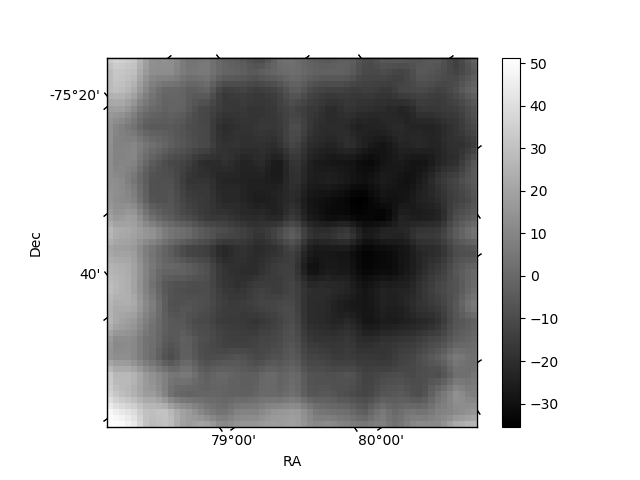
Quadrant B |
|---|---|---|---|
| Quadrant D | 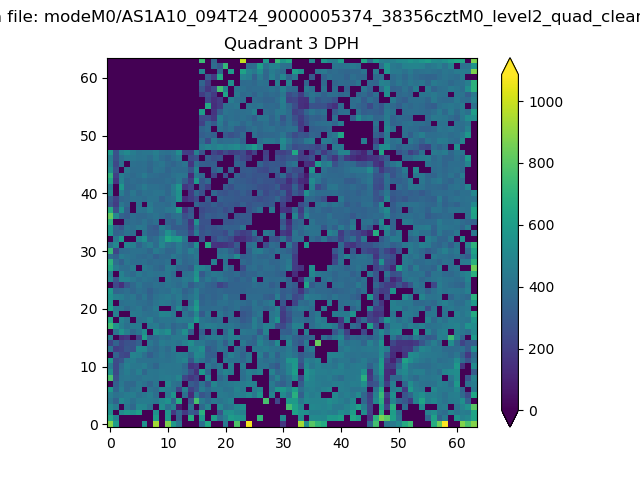 |
 |
Quadrant C |
| Plot type | Count rate plots | Images |
|---|---|---|
| Comparison with Poisson distribution Blue bars denote a histogram of data divided into 1 sec bins. Red curve is a Poisson curve with rate = median count rate of data. |
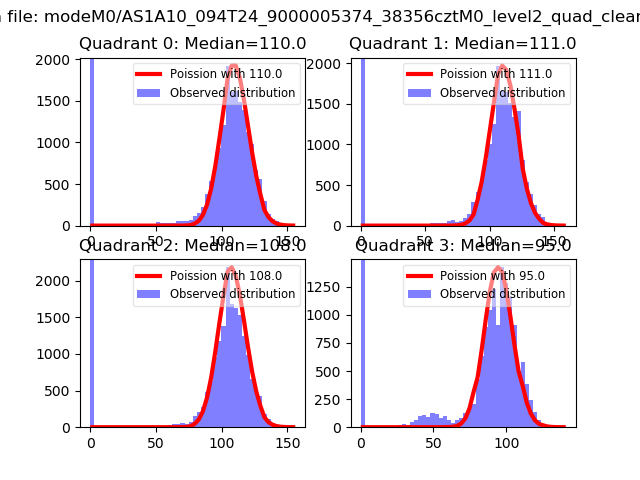 |
 |
| Quadrant-wise count rates Data is divided into 100 sec bins |
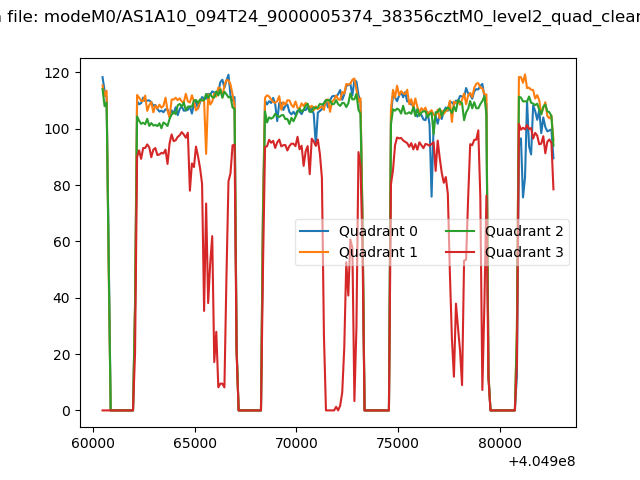 |
|
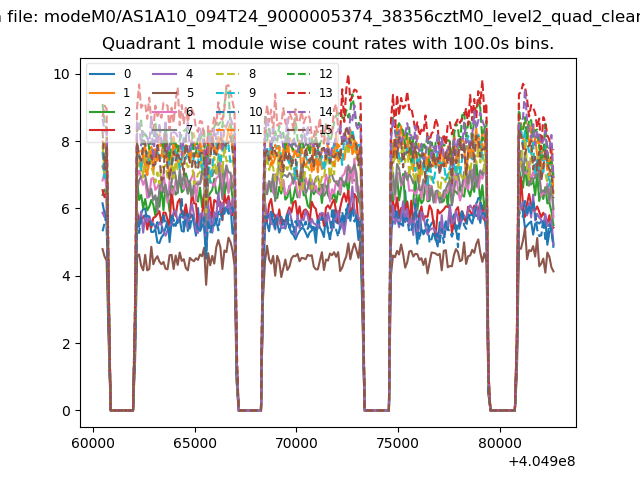
| Module-wise count rates for Quadrant A Data is divided into 100 sec bins |
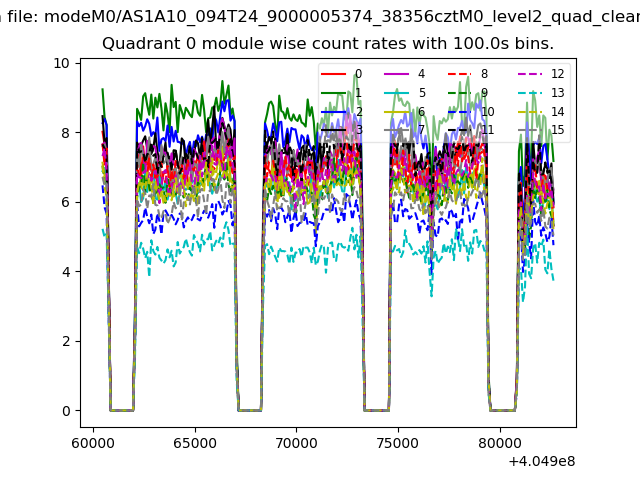 |
 |
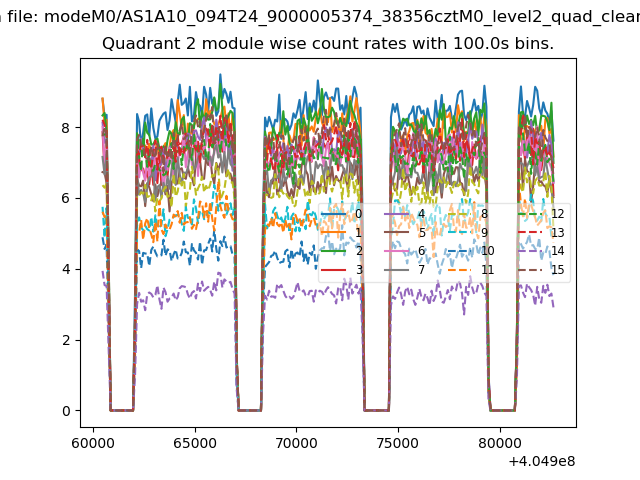
| Module-wise count rates for Quadrant B Data is divided into 100 sec bins |
 |
 |
| Module-wise count rates for Quadrant C Data is divided into 100 sec bins |
 |
 |
| Module-wise count rates for Quadrant D Data is divided into 100 sec bins |
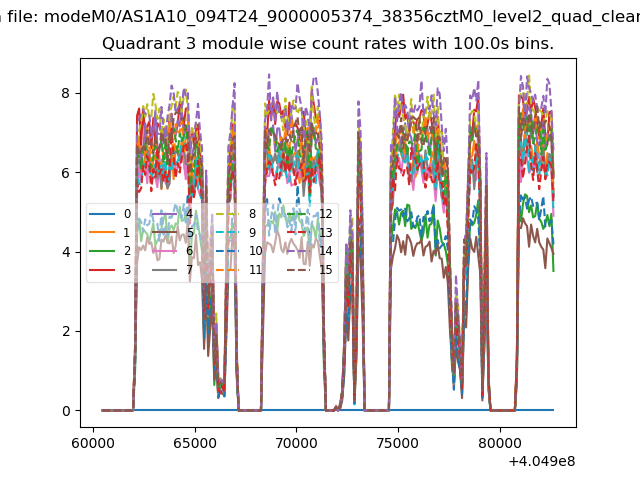 |
 |
| Parameter | Plot |
|---|---|
| CZT HV Monitor | 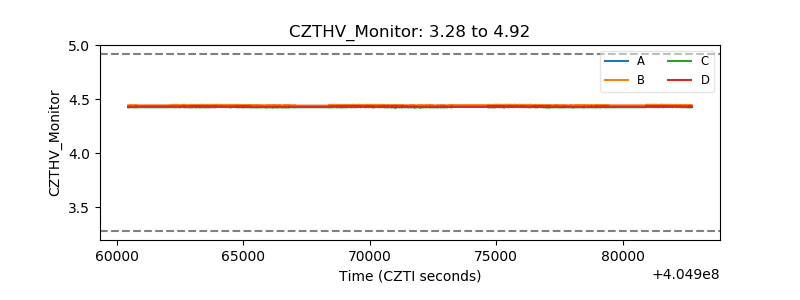 |
| D_VDD | 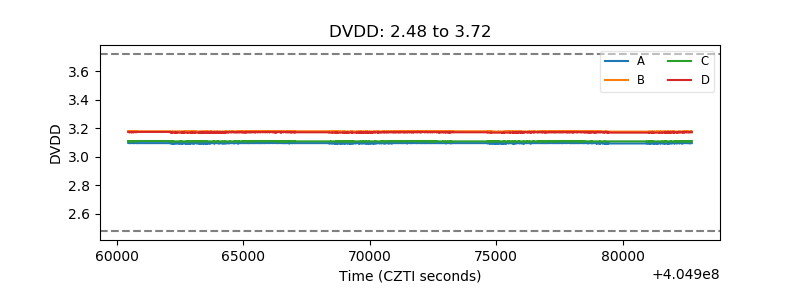 |
| Temperature 1 | 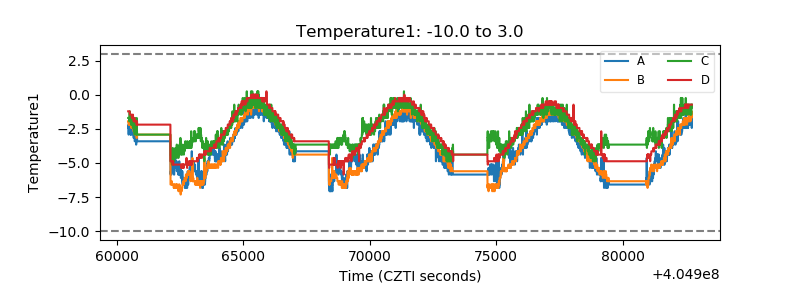 |
| Veto HV Monitor | 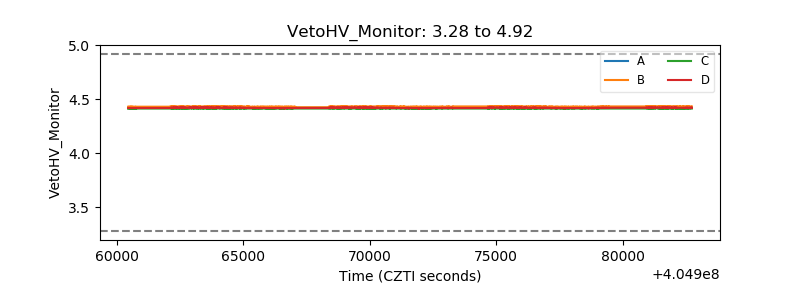 |
| Veto LLD | 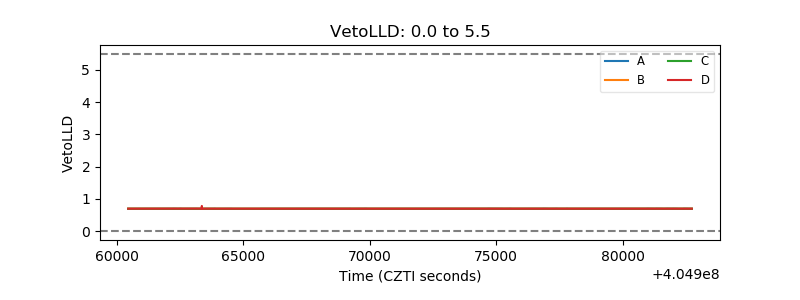 |
| Alpha Counter | 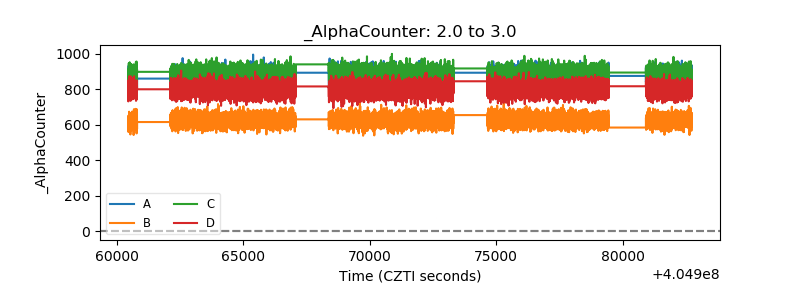 |
| _CPM_Rate | 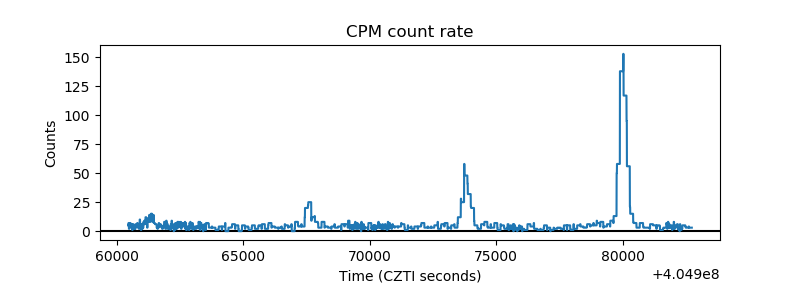 |
| CZT Counter |  |
| +2.5 Volts monitor | 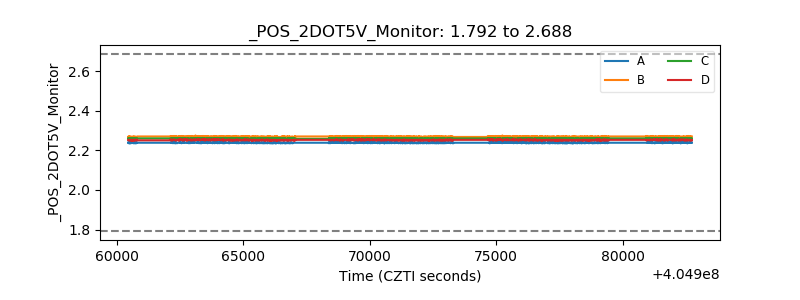 |
| +5 Volts monitor | 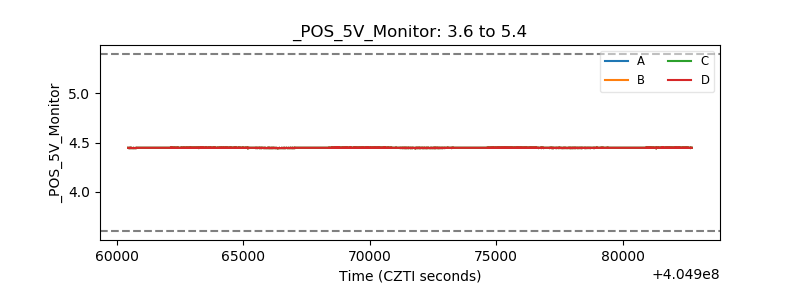 |
| _ROLL_ROT | 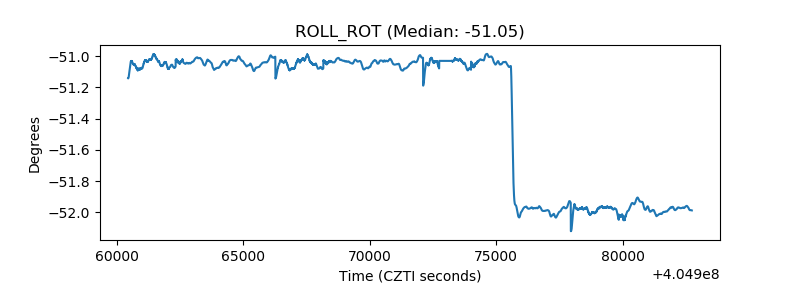 |
| _Roll_DEC | 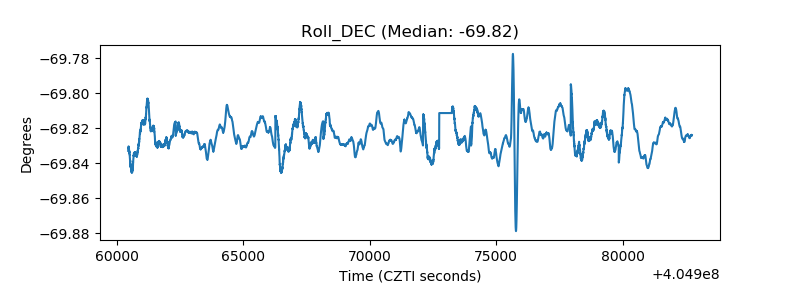 |
| _Roll_RA | 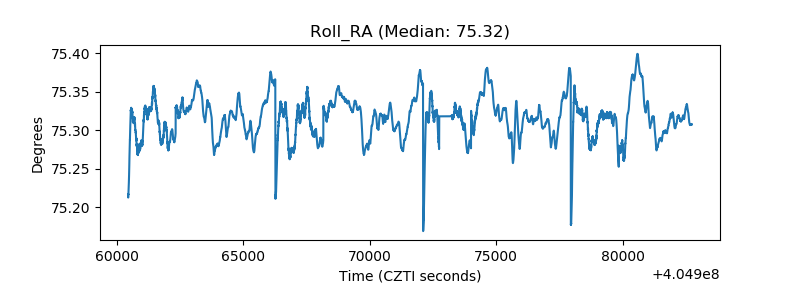 |
| Veto Counter | 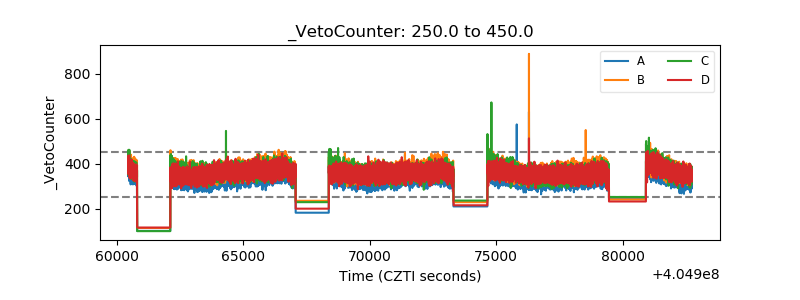 |