| Param | Original file | Final file |
|---|---|---|
| Filename | modeM0/AS1A10_094T24_9000005374_38358cztM0_level2.fits | modeM0/AS1A10_094T24_9000005374_38358cztM0_level2_quad_clean.evt |
| Size (bytes) | 1,391,114,880 | 211,461,120 |
| Size | 1.3 GB | 201.7 MB |
| Events in quadrant A | 10,847,168 | 1,444,725 |
| Events in quadrant B | 7,480,274 | 1,557,466 |
| Events in quadrant C | 6,416,680 | 1,525,561 |
| Events in quadrant D | 25,724,924 | 955,948 |
| Mode SS | |||
|---|---|---|---|
| Quadrant | BADHDUFLAG | Total packets | Discarded packets |
| A | 0 | 270 | 0 |
| B | 0 | 270 | 0 |
| C | 0 | 270 | 0 |
| D | 0 | 270 | 0 |
| Mode M0 | |||
|---|---|---|---|
| Quadrant | BADHDUFLAG | Total packets | Discarded packets |
| A | 0 | 40776 | 4 |
| B | 0 | 30798 | 3 |
| C | 0 | 27491 | 3 |
| D | 0 | 85669 | 3 |
| Mode M9 | |||
|---|---|---|---|
| Quadrant | BADHDUFLAG | Total packets | Discarded packets |
| A | 0 | 52 | 0 |
| B | 0 | 52 | 0 |
| C | 0 | 52 | 0 |
| D | 0 | 52 | 0 |
| Quadrant | Total seconds | Saturated seconds | Saturation percentage |
|---|---|---|---|
| A | 13301 | 1050 | 7.894143% |
| B | 13301 | 184 | 1.383355% |
| C | 13301 | 27 | 0.202992% |
| D | 13301 | 5207 | 39.147433% |
Noise dominated data is calculated using 1-second bins in cleaned event files. If a bin has >2000 counts, and if more than 50% of those come from <1% of pixels, then it is considered to be noise-dominated and hence unusable.
| Quadrant | # 1 sec bins | Bins with >0 counts | Bins with >2000 counts | High rate bins dominated by noise | Noise dominated (total time) | Noise dominated (detector-on time) | Marked lightcurve |
|---|---|---|---|---|---|---|---|
| A | 18437 | 13304 | 816 | 816 | 4.43% | 6.13% | 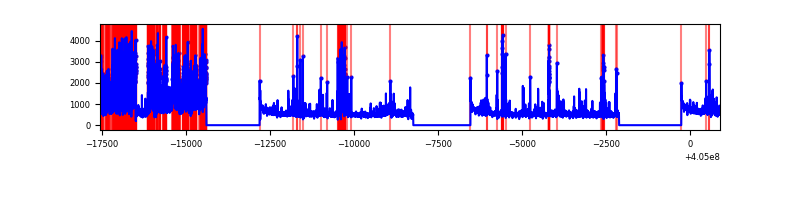 |
| B | 18437 | 13304 | 121 | 121 | 0.66% | 0.91% | 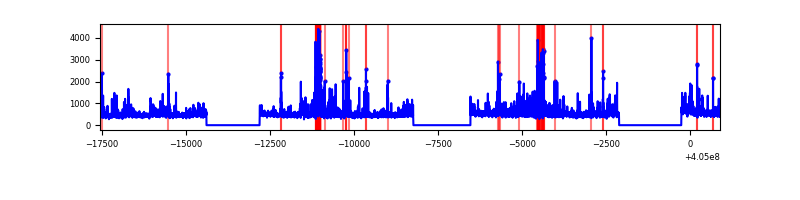 |
| C | 18437 | 13304 | 17 | 17 | 0.09% | 0.13% | 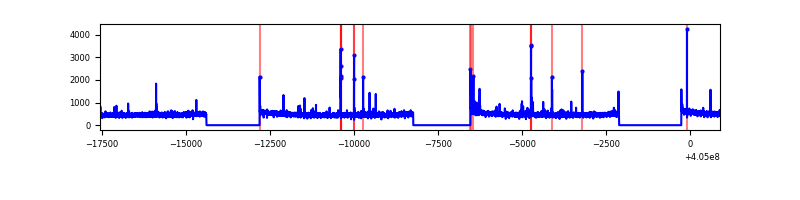 |
| D | 18437 | 13304 | 5992 | 5992 | 32.50% | 45.04% | 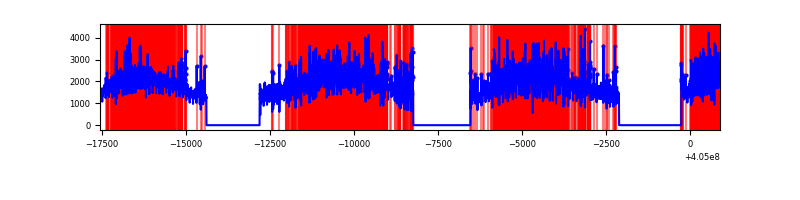 |
Top three noisy pixels from each quadrant. If the there are fewer than three noisy pixels in the level2.evt file, extra rows are filled as -1
| Pixel properties | Quadrant properties | ||||||
|---|---|---|---|---|---|---|---|
| Quadrant | DetID | PixID | Counts | Sigma | Mean | Median | Sigma |
| A | 15 | 222 | 3131614 | 10739.01 | 1465 | 1436 | 291.5 |
| A | 10 | 83 | 873893 | 2993.22 | 1465 | 1436 | 291.5 |
| A | 9 | 143 | 724814 | 2481.76 | 1465 | 1436 | 291.5 |
| B | 4 | 170 | 551650 | 1979.13 | 1488 | 1449 | 278.0 |
| B | 5 | 200 | 225318 | 805.28 | 1488 | 1449 | 278.0 |
| B | 0 | 183 | 219409 | 784.02 | 1488 | 1449 | 278.0 |
| C | 15 | 214 | 562267 | 1665.64 | 1457 | 1464 | 336.7 |
| C | 0 | 207 | 56040 | 162.09 | 1457 | 1464 | 336.7 |
| C | 15 | 159 | 33390 | 94.82 | 1457 | 1464 | 336.7 |
| D | 10 | 203 | 17659535 | 53082.7 | 1342 | 1302 | 332.7 |
| D | 2 | 16 | 1014765 | 3046.59 | 1342 | 1302 | 332.7 |
| D | 12 | 227 | 747146 | 2242.09 | 1342 | 1302 | 332.7 |
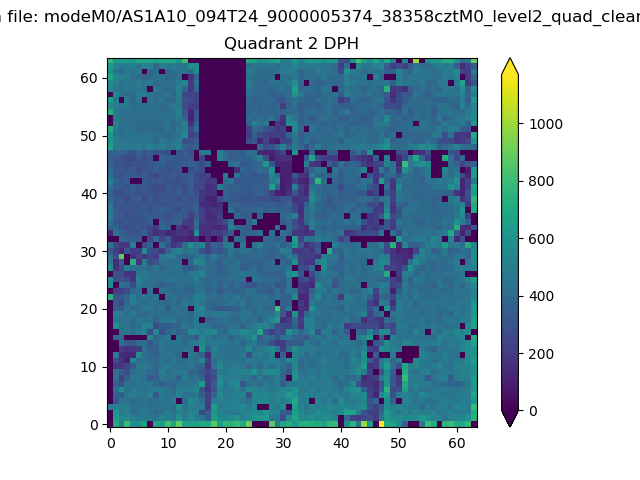
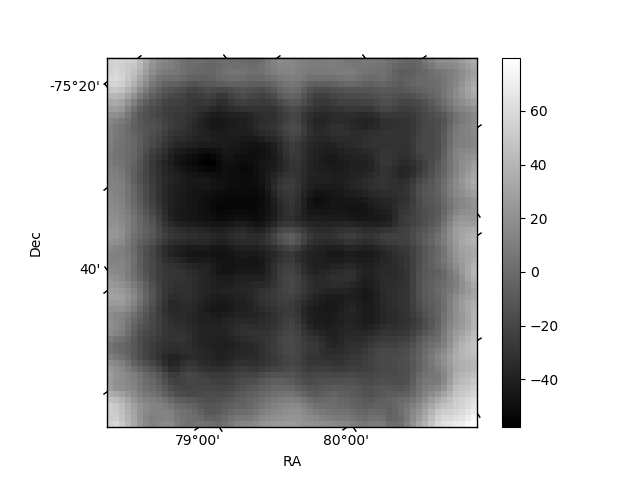
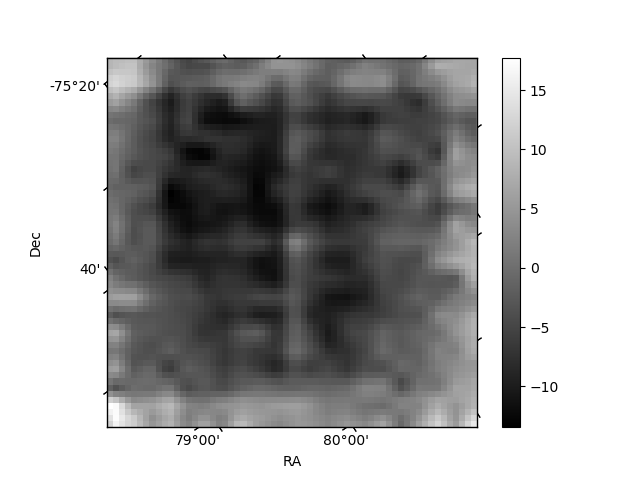
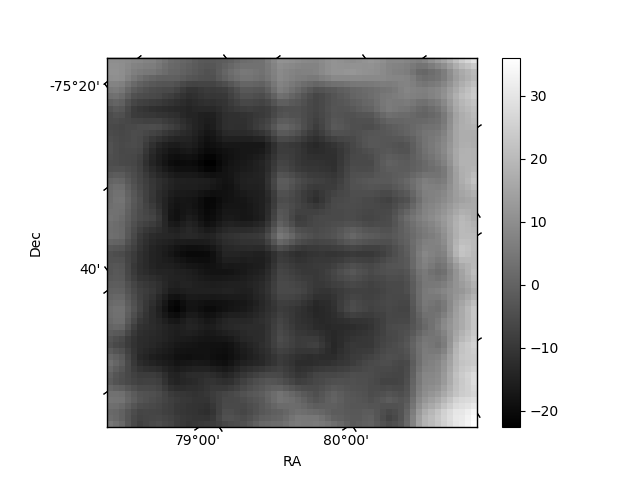
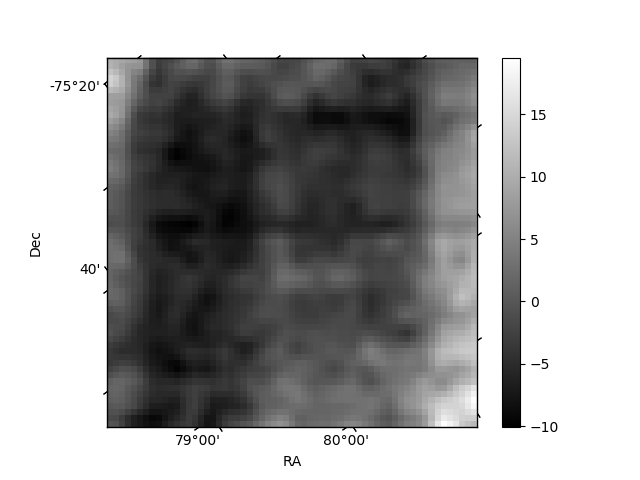
Histogram calculated using DETX and DETY for each event in the final _common_clean file
| Quadrant A | 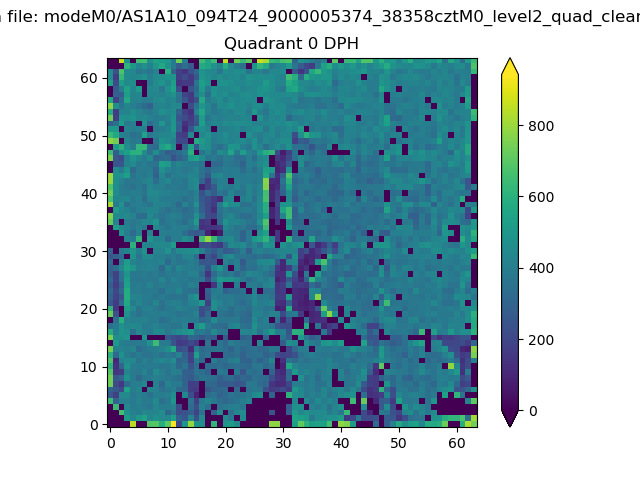 |
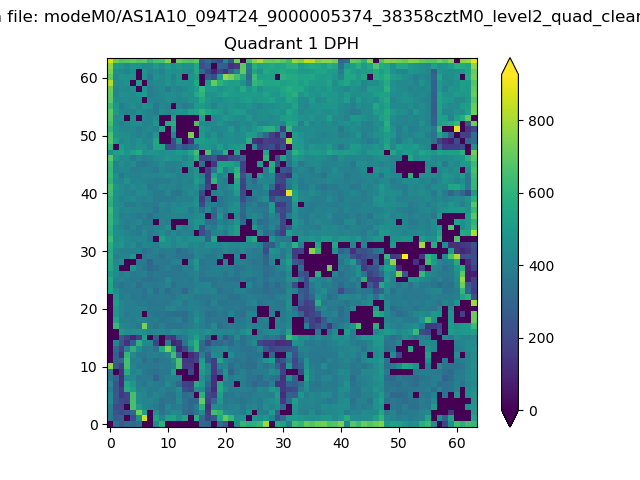 |
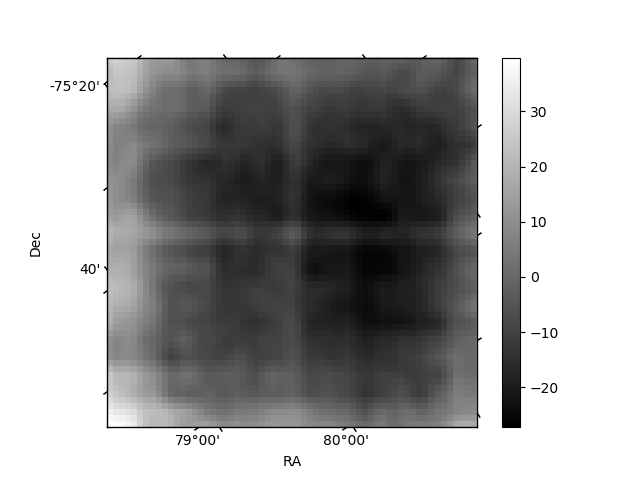
Quadrant B |
|---|---|---|---|
| Quadrant D | 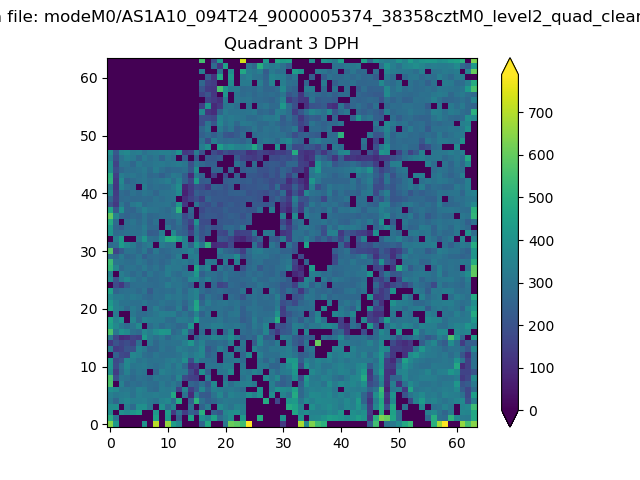 |
 |
Quadrant C |
| Plot type | Count rate plots | Images |
|---|---|---|
| Comparison with Poisson distribution Blue bars denote a histogram of data divided into 1 sec bins. Red curve is a Poisson curve with rate = median count rate of data. |
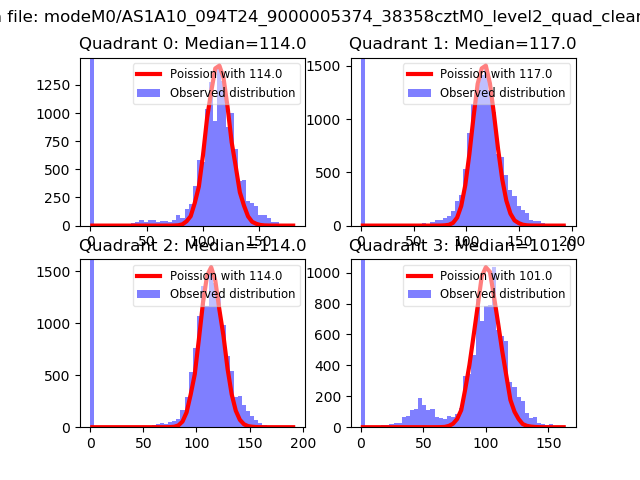 |
 |
| Quadrant-wise count rates Data is divided into 100 sec bins |
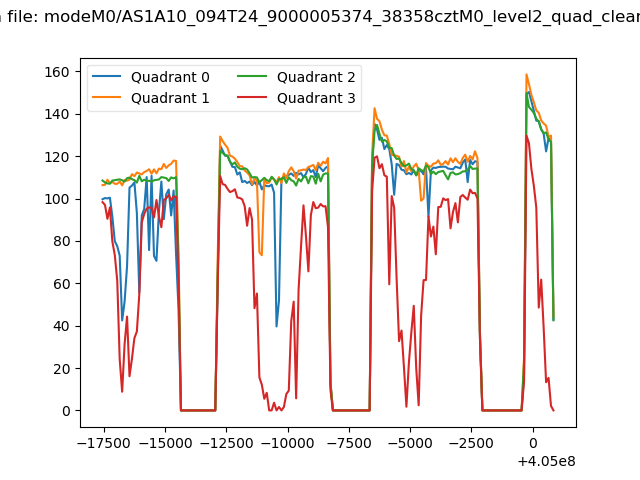 |
|
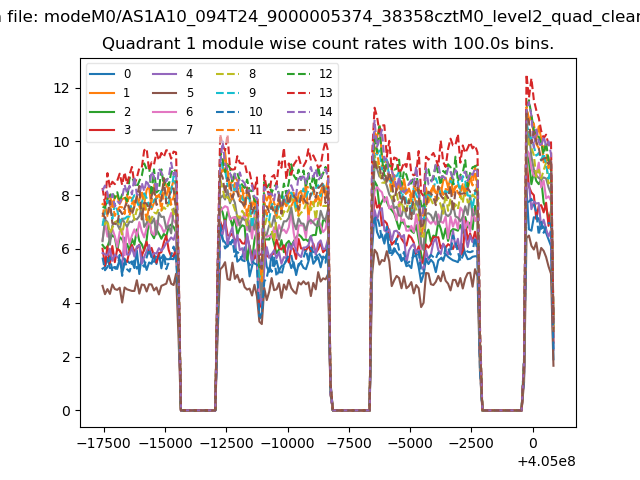
| Module-wise count rates for Quadrant A Data is divided into 100 sec bins |
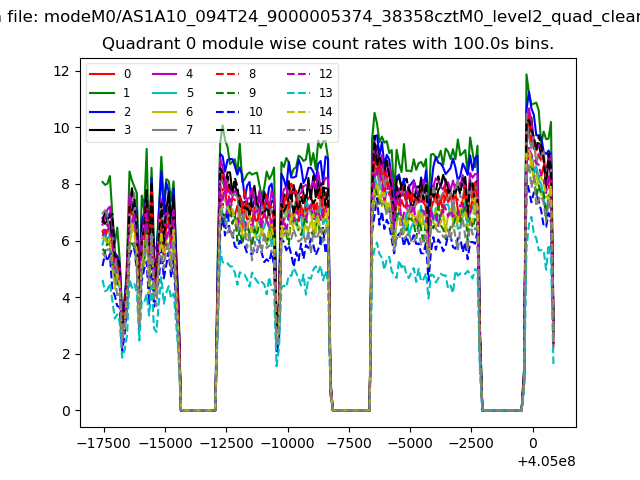 |
 |
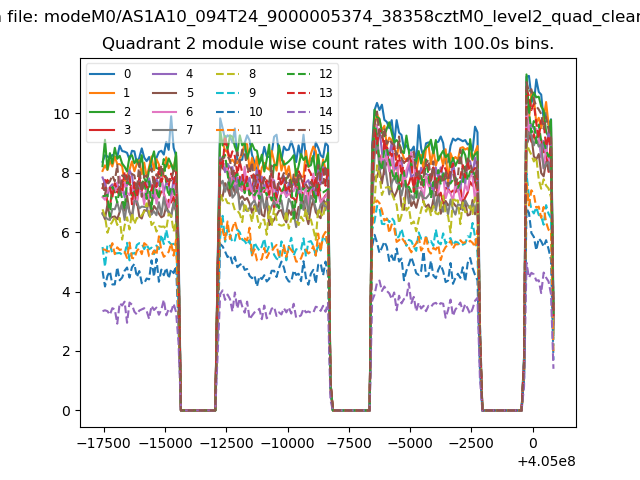
| Module-wise count rates for Quadrant B Data is divided into 100 sec bins |
 |
 |
| Module-wise count rates for Quadrant C Data is divided into 100 sec bins |
 |
 |
| Module-wise count rates for Quadrant D Data is divided into 100 sec bins |
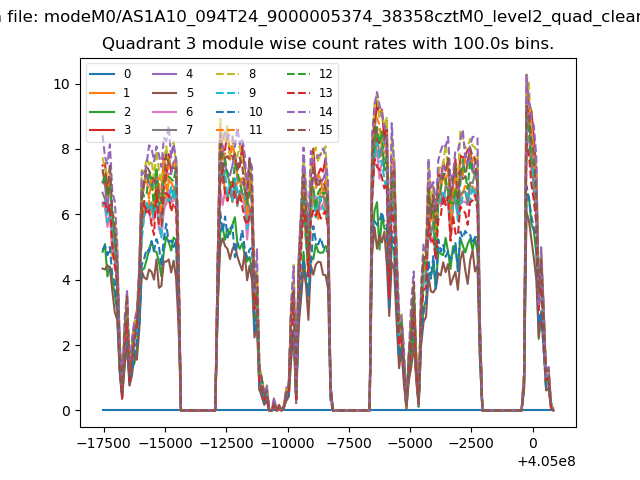 |
 |
| Parameter | Plot |
|---|---|
| CZT HV Monitor | 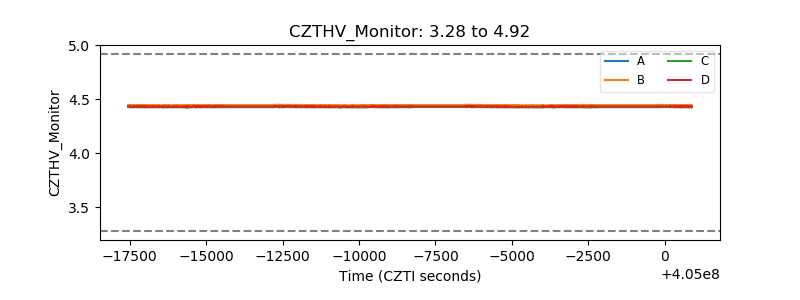 |
| D_VDD | 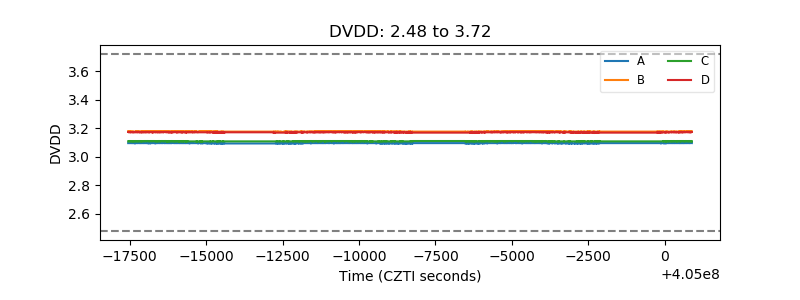 |
| Temperature 1 | 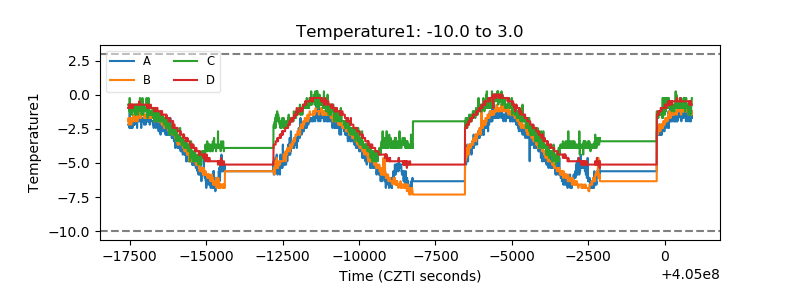 |
| Veto HV Monitor | 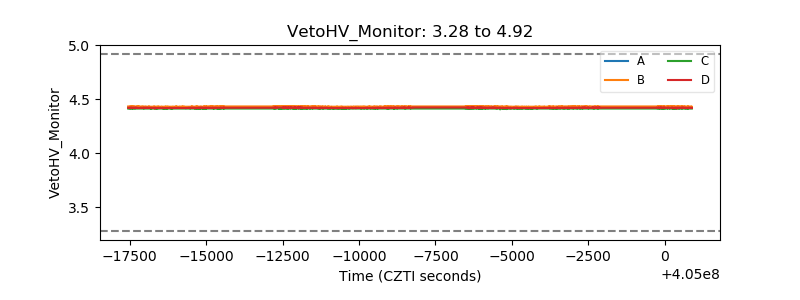 |
| Veto LLD | 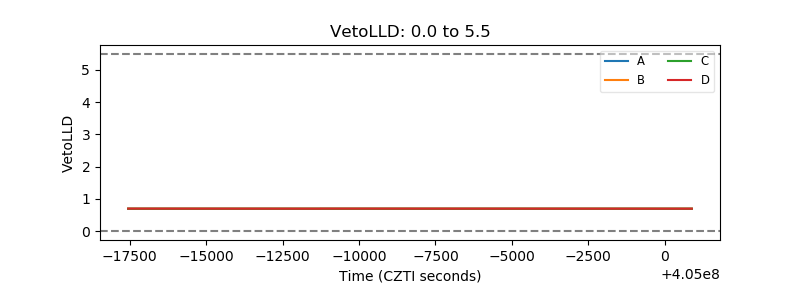 |
| Alpha Counter | 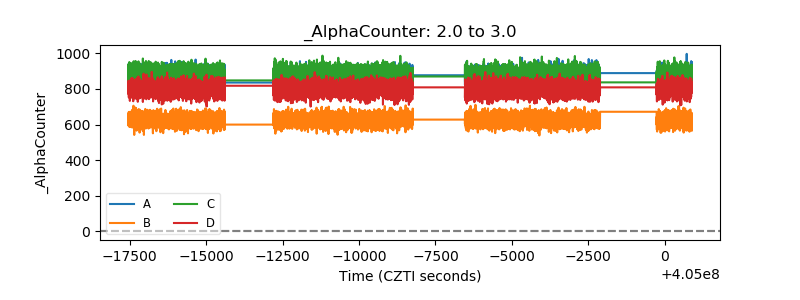 |
| _CPM_Rate | 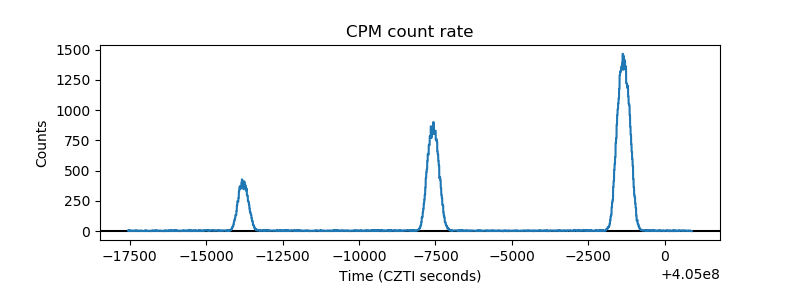 |
| CZT Counter | 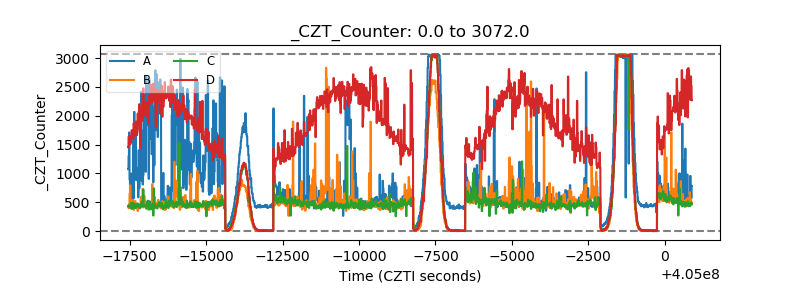 |
| +2.5 Volts monitor | 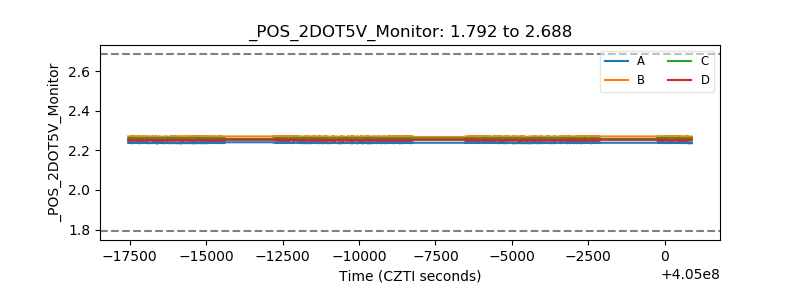 |
| +5 Volts monitor | 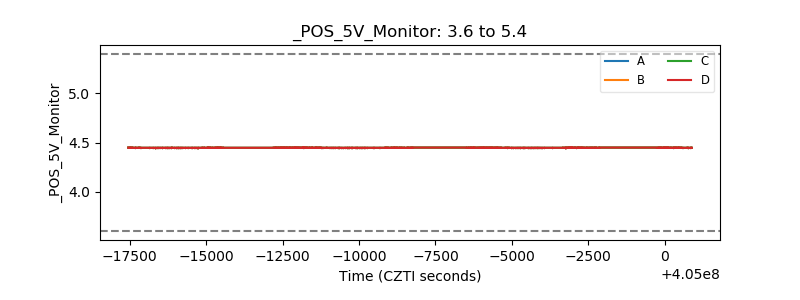 |
| _ROLL_ROT | 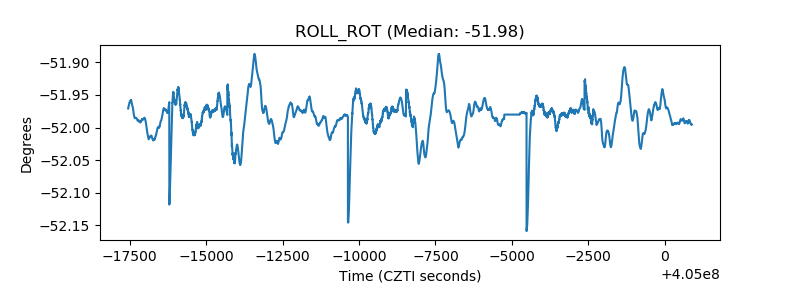 |
| _Roll_DEC | 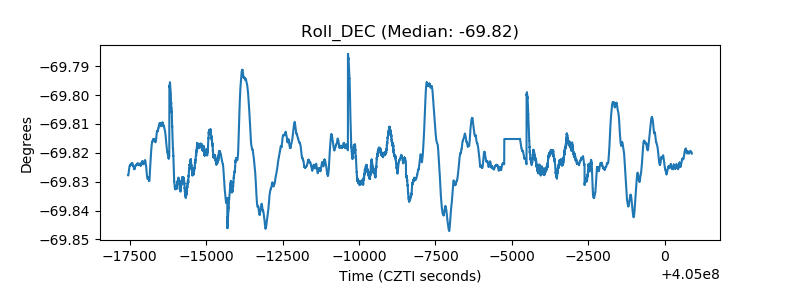 |
| _Roll_RA | 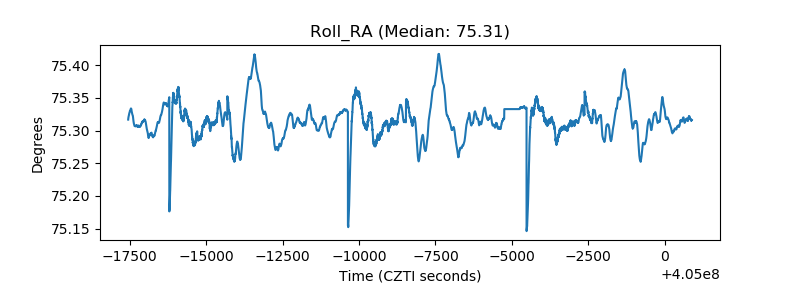 |
| Veto Counter | 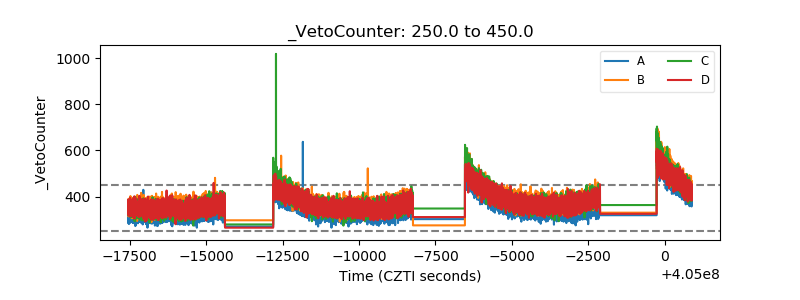 |