| Param | Original file | Final file |
|---|---|---|
| Filename | modeM0/AS1A10_094T24_9000005374_38359cztM0_level2.fits | modeM0/AS1A10_094T24_9000005374_38359cztM0_level2_quad_clean.evt |
| Size (bytes) | 880,819,200 | 151,165,440 |
| Size | 840.0 MB | 144.2 MB |
| Events in quadrant A | 5,685,111 | 1,096,810 |
| Events in quadrant B | 4,875,767 | 1,121,129 |
| Events in quadrant C | 4,336,657 | 1,079,174 |
| Events in quadrant D | 17,023,074 | 665,729 |
| Mode SS | |||
|---|---|---|---|
| Quadrant | BADHDUFLAG | Total packets | Discarded packets |
| A | 0 | 180 | 0 |
| B | 0 | 180 | 0 |
| C | 0 | 180 | 0 |
| D | 0 | 180 | 0 |
| Mode M0 | |||
|---|---|---|---|
| Quadrant | BADHDUFLAG | Total packets | Discarded packets |
| A | 0 | 22662 | 3 |
| B | 0 | 20103 | 2 |
| C | 0 | 18358 | 2 |
| D | 0 | 56707 | 2 |
| Mode M9 | |||
|---|---|---|---|
| Quadrant | BADHDUFLAG | Total packets | Discarded packets |
| A | 0 | 38 | 0 |
| B | 0 | 38 | 0 |
| C | 0 | 38 | 0 |
| D | 0 | 38 | 0 |
| Quadrant | Total seconds | Saturated seconds | Saturation percentage |
|---|---|---|---|
| A | 8854 | 94 | 1.061667% |
| B | 8854 | 86 | 0.971312% |
| C | 8854 | 12 | 0.135532% |
| D | 8854 | 3553 | 40.128755% |
Noise dominated data is calculated using 1-second bins in cleaned event files. If a bin has >2000 counts, and if more than 50% of those come from <1% of pixels, then it is considered to be noise-dominated and hence unusable.
| Quadrant | # 1 sec bins | Bins with >0 counts | Bins with >2000 counts | High rate bins dominated by noise | Noise dominated (total time) | Noise dominated (detector-on time) | Marked lightcurve |
|---|---|---|---|---|---|---|---|
| A | 12648 | 8856 | 54 | 54 | 0.43% | 0.61% | 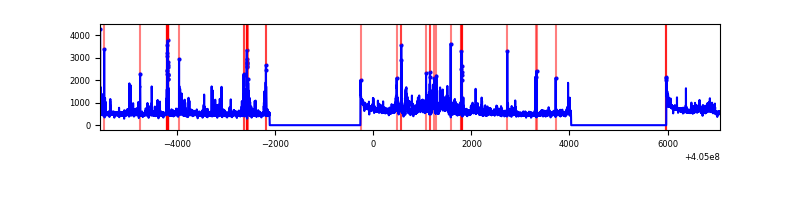 |
| B | 12648 | 8856 | 45 | 45 | 0.36% | 0.51% | 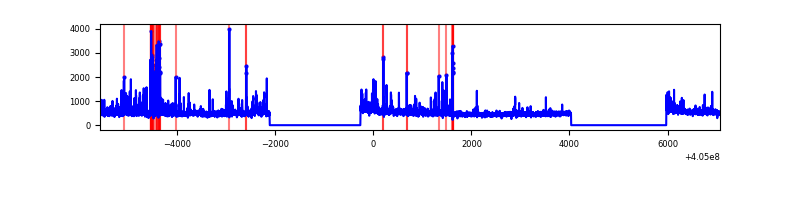 |
| C | 12648 | 8856 | 11 | 11 | 0.09% | 0.12% | 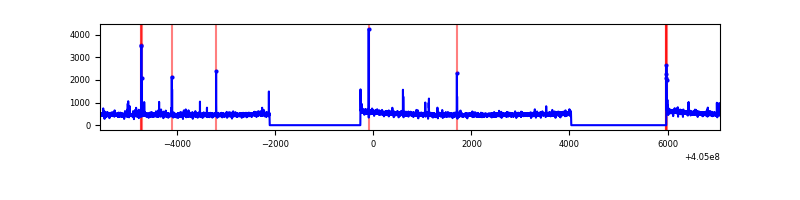 |
| D | 12648 | 8856 | 4140 | 4140 | 32.73% | 46.75% | 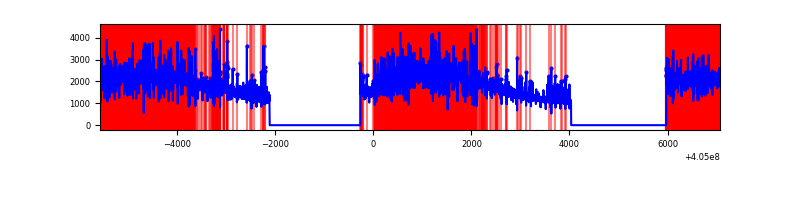 |
Top three noisy pixels from each quadrant. If the there are fewer than three noisy pixels in the level2.evt file, extra rows are filled as -1
| Pixel properties | Quadrant properties | ||||||
|---|---|---|---|---|---|---|---|
| Quadrant | DetID | PixID | Counts | Sigma | Mean | Median | Sigma |
| A | 10 | 83 | 602442 | 2934.56 | 1026 | 1009 | 204.9 |
| A | 12 | 16 | 473309 | 2304.49 | 1026 | 1009 | 204.9 |
| A | 9 | 143 | 337250 | 1640.62 | 1026 | 1009 | 204.9 |
| B | 4 | 170 | 235527 | 1238.78 | 1024 | 1000 | 189.3 |
| B | 5 | 172 | 152572 | 800.61 | 1024 | 1000 | 189.3 |
| B | 0 | 183 | 132095 | 692.45 | 1024 | 1000 | 189.3 |
| C | 15 | 214 | 372910 | 1636.65 | 992 | 1002 | 227.2 |
| C | 15 | 159 | 33632 | 143.59 | 992 | 1002 | 227.2 |
| C | 0 | 10 | 20542 | 85.99 | 992 | 1002 | 227.2 |
| D | 10 | 203 | 11425154 | 50674.24 | 905 | 878 | 225.4 |
| D | 2 | 16 | 566613 | 2509.41 | 905 | 878 | 225.4 |
| D | 12 | 227 | 432357 | 1913.9 | 905 | 878 | 225.4 |
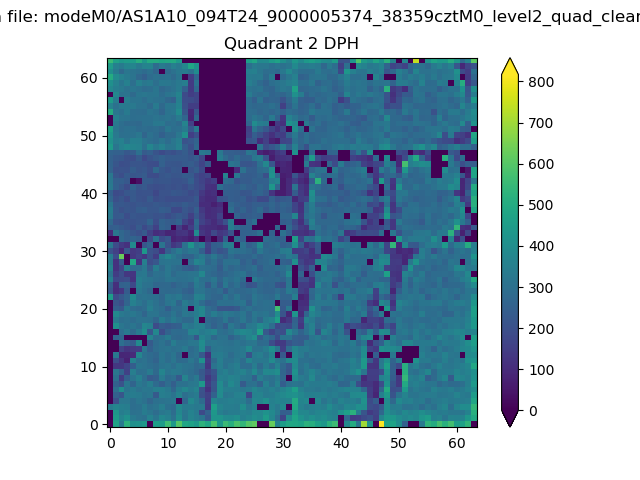
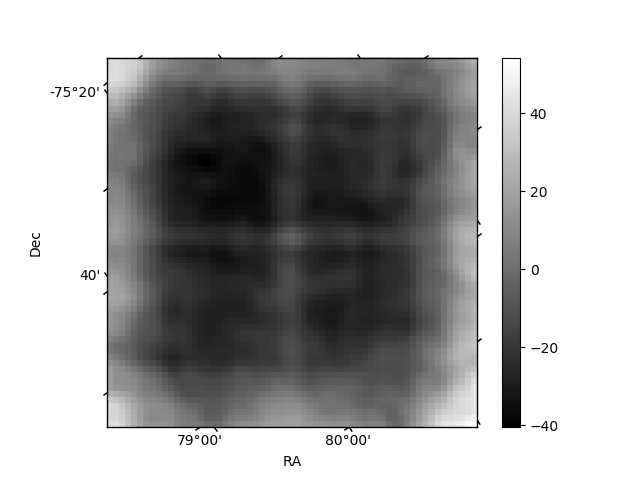
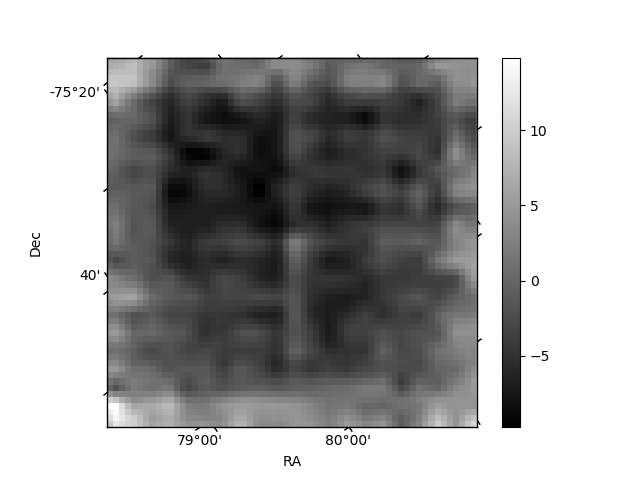
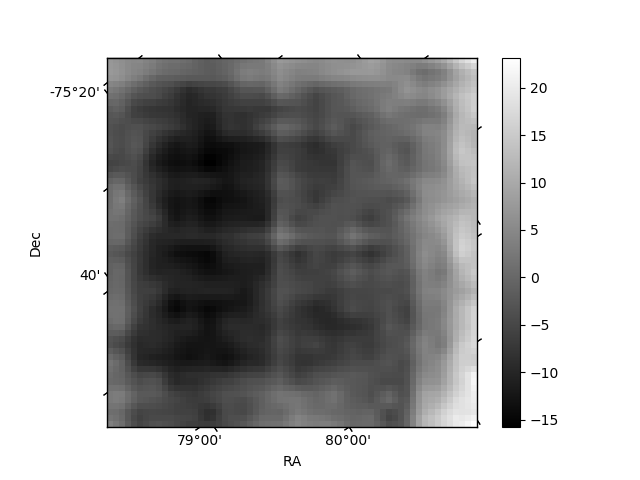
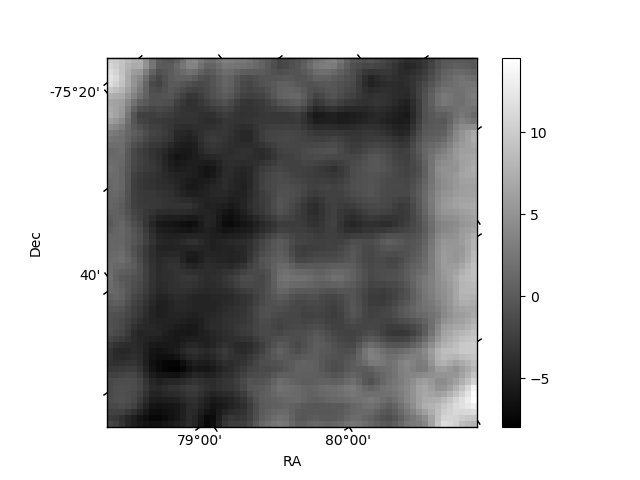
Histogram calculated using DETX and DETY for each event in the final _common_clean file
| Quadrant A | 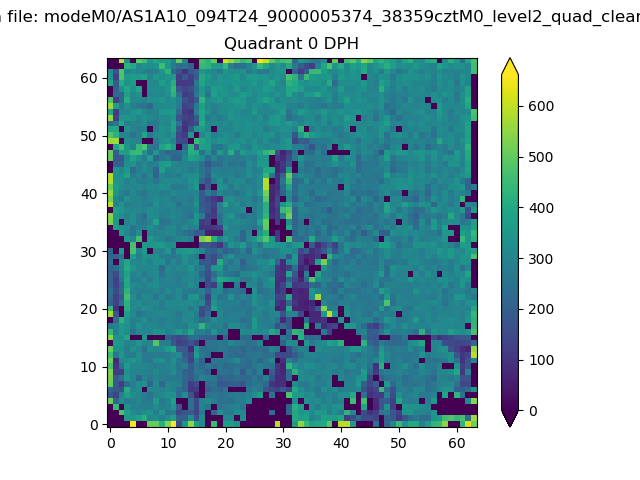 |
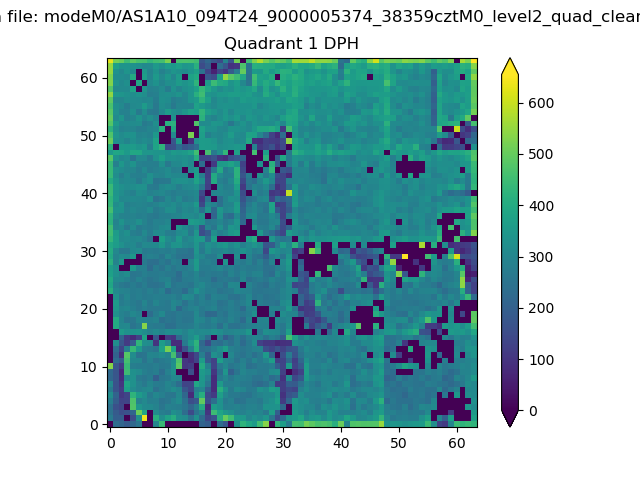 |
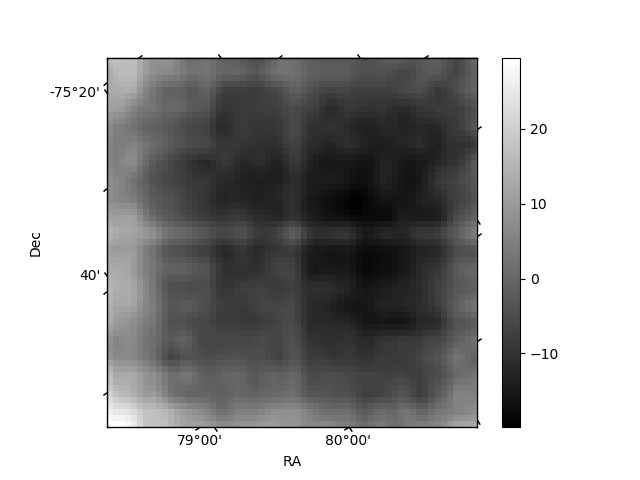
Quadrant B |
|---|---|---|---|
| Quadrant D | 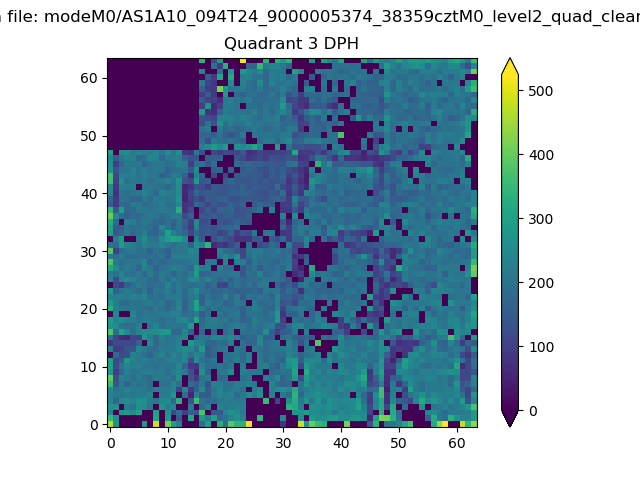 |
 |
Quadrant C |
| Plot type | Count rate plots | Images |
|---|---|---|
| Comparison with Poisson distribution Blue bars denote a histogram of data divided into 1 sec bins. Red curve is a Poisson curve with rate = median count rate of data. |
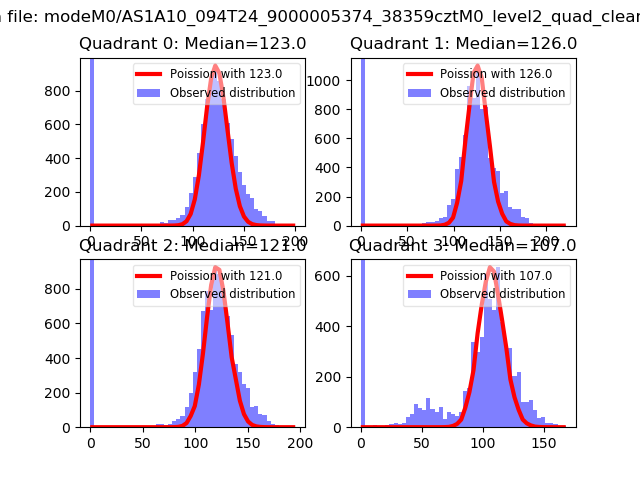 |
 |
| Quadrant-wise count rates Data is divided into 100 sec bins |
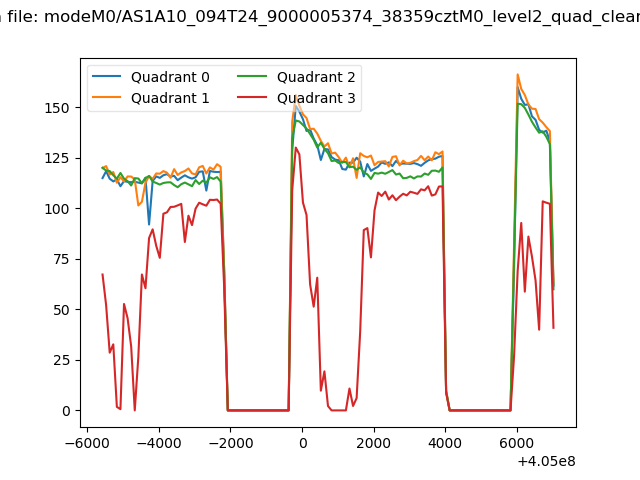 |
|
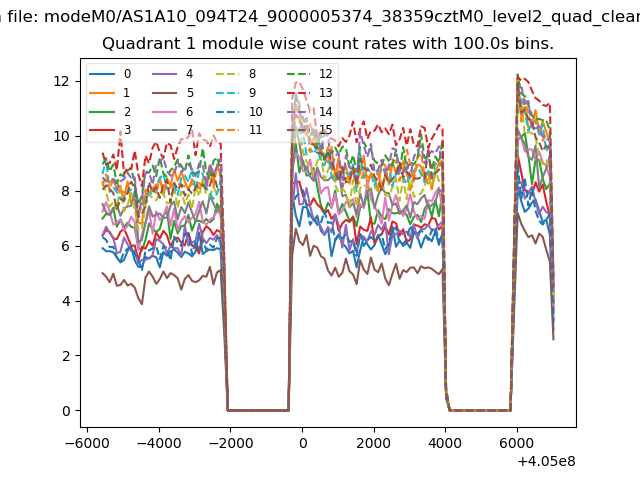
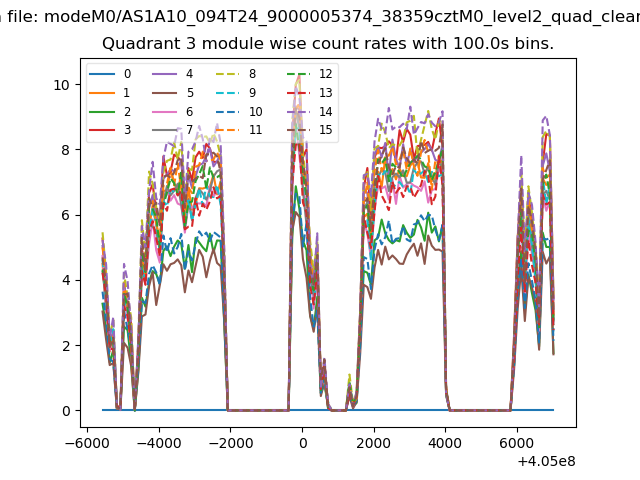
| Module-wise count rates for Quadrant A Data is divided into 100 sec bins |
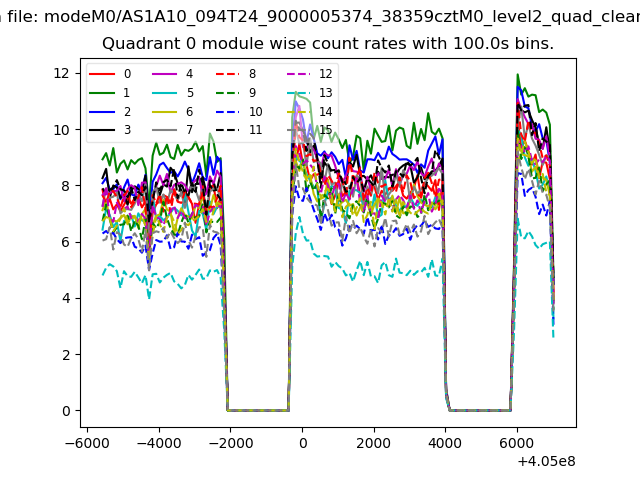 |
 |
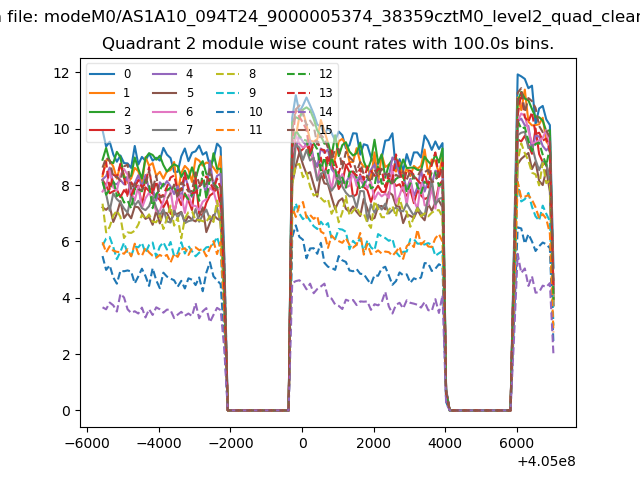
| Module-wise count rates for Quadrant B Data is divided into 100 sec bins |
 |
 |
| Module-wise count rates for Quadrant C Data is divided into 100 sec bins |
 |
 |
| Module-wise count rates for Quadrant D Data is divided into 100 sec bins |
 |
 |
| Parameter | Plot |
|---|---|
| CZT HV Monitor | 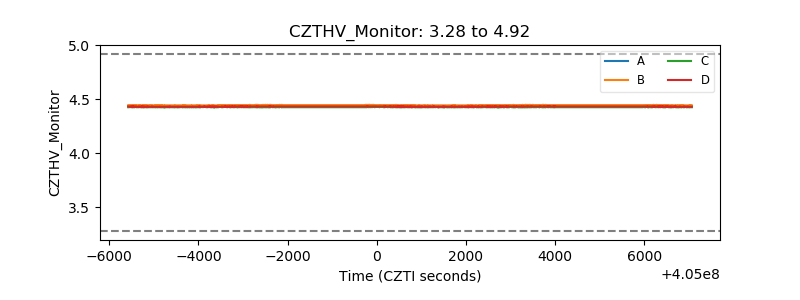 |
| D_VDD | 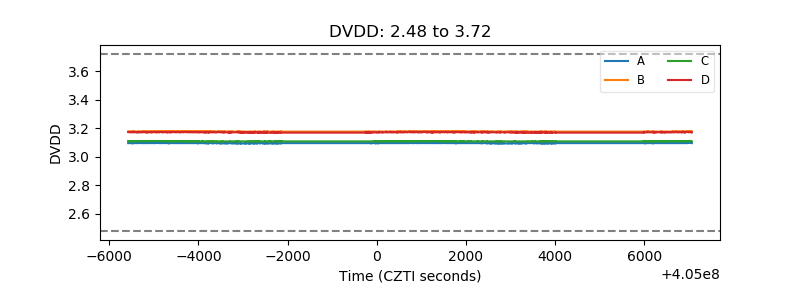 |
| Temperature 1 | 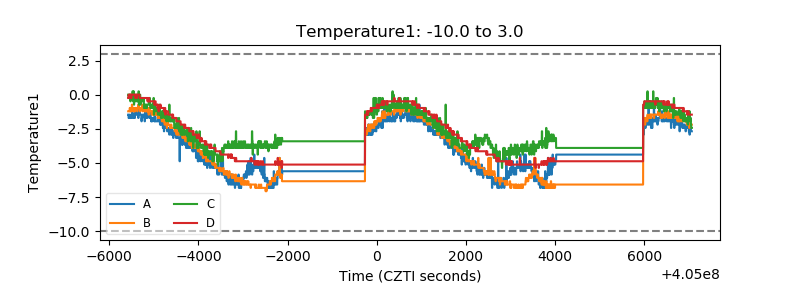 |
| Veto HV Monitor | 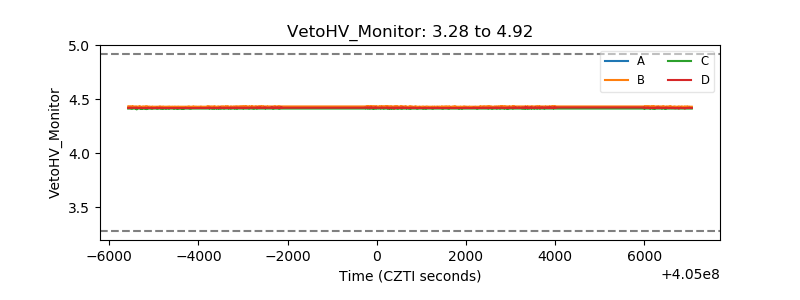 |
| Veto LLD | 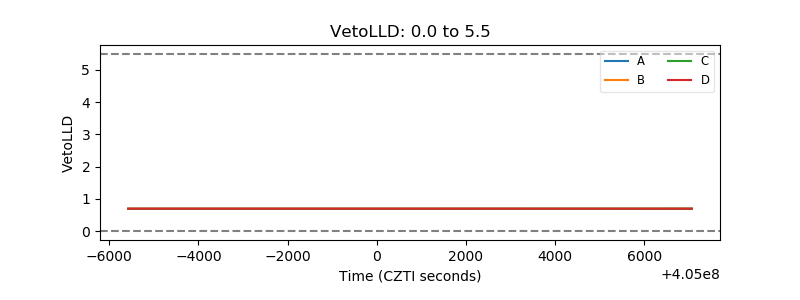 |
| Alpha Counter | 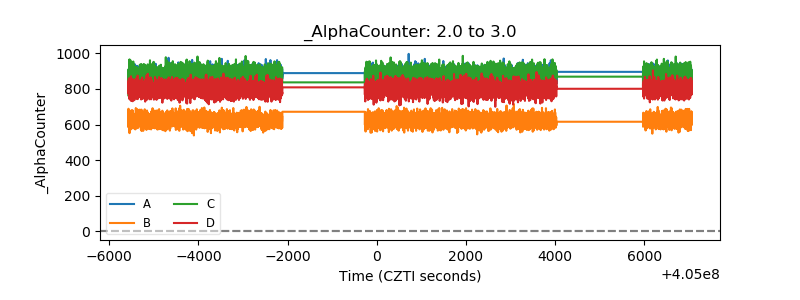 |
| _CPM_Rate | 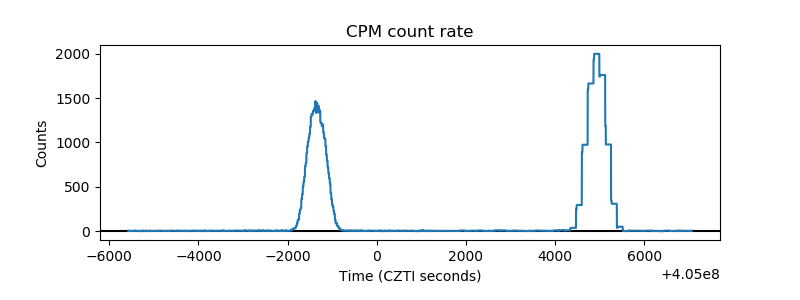 |
| CZT Counter | 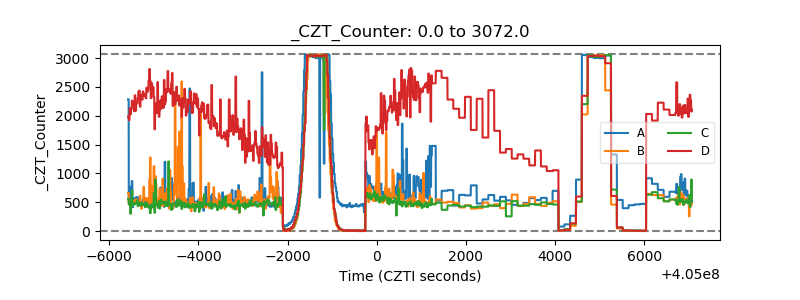 |
| +2.5 Volts monitor | 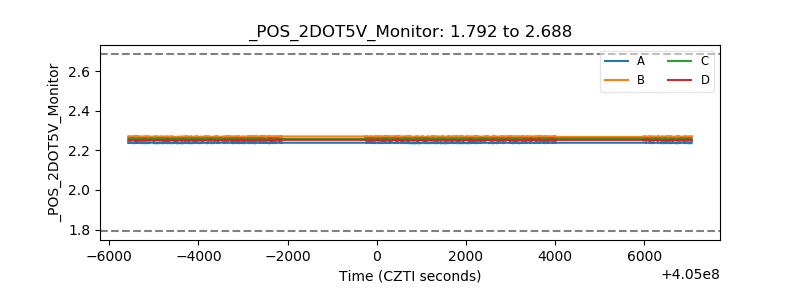 |
| +5 Volts monitor | 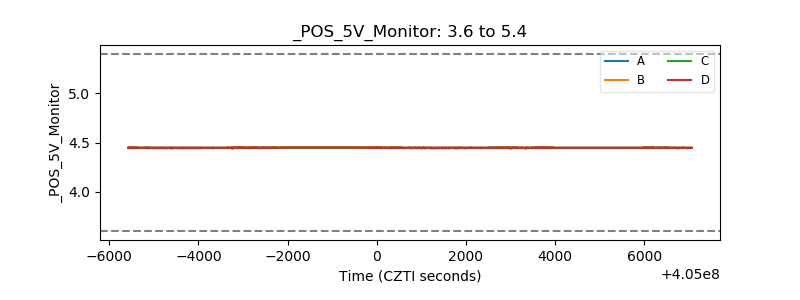 |
| _ROLL_ROT | 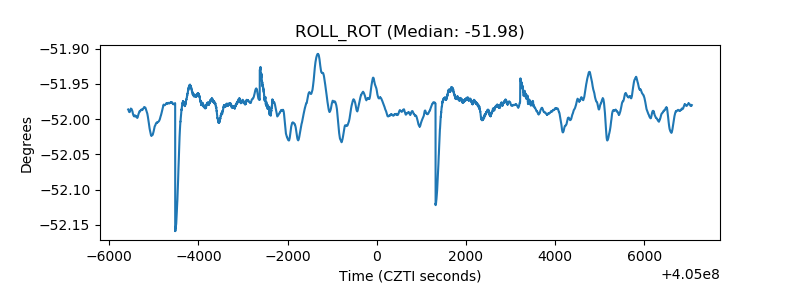 |
| _Roll_DEC | 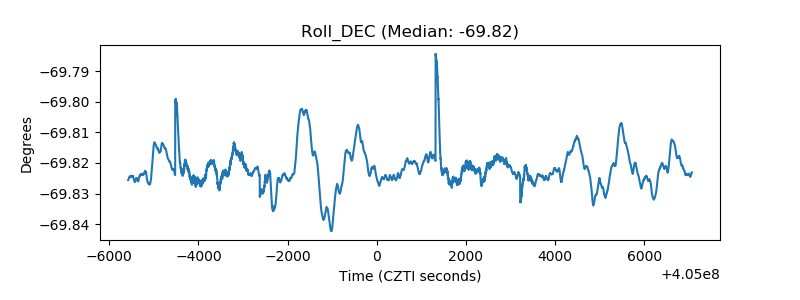 |
| _Roll_RA | 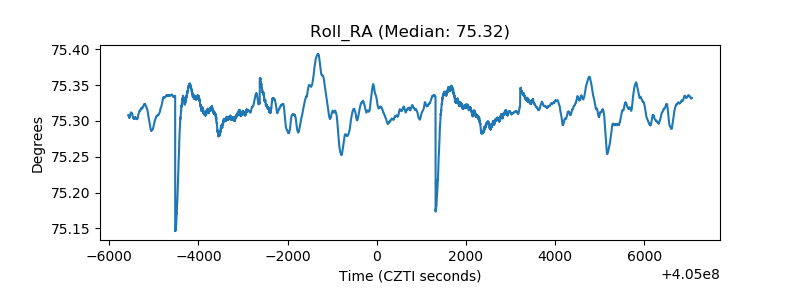 |
| Veto Counter | 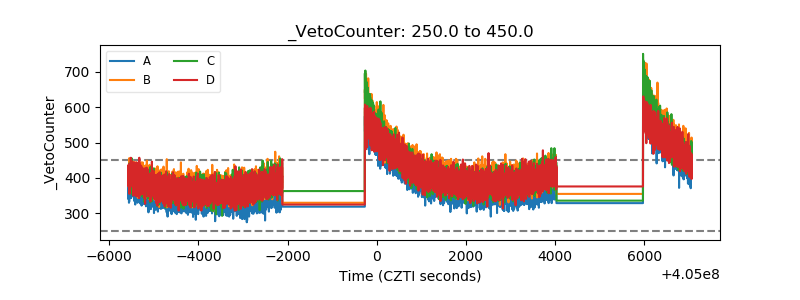 |