| Param | Original file | Final file |
|---|---|---|
| Filename | modeM0/AS1A10_094T24_9000005374_38360cztM0_level2.fits | modeM0/AS1A10_094T24_9000005374_38360cztM0_level2_quad_clean.evt |
| Size (bytes) | 1,297,307,520 | 227,816,640 |
| Size | 1.2 GB | 217.3 MB |
| Events in quadrant A | 8,195,743 | 1,661,701 |
| Events in quadrant B | 7,118,173 | 1,697,736 |
| Events in quadrant C | 6,651,024 | 1,619,903 |
| Events in quadrant D | 25,040,740 | 1,008,839 |
| Mode SS | |||
|---|---|---|---|
| Quadrant | BADHDUFLAG | Total packets | Discarded packets |
| A | 0 | 268 | 0 |
| B | 0 | 268 | 0 |
| C | 0 | 268 | 0 |
| D | 0 | 268 | 0 |
| Mode M0 | |||
|---|---|---|---|
| Quadrant | BADHDUFLAG | Total packets | Discarded packets |
| A | 0 | 32675 | 6 |
| B | 0 | 29488 | 3 |
| C | 0 | 27799 | 3 |
| D | 0 | 83648 | 3 |
| Mode M9 | |||
|---|---|---|---|
| Quadrant | BADHDUFLAG | Total packets | Discarded packets |
| A | 0 | 59 | 0 |
| B | 0 | 59 | 0 |
| C | 0 | 59 | 0 |
| D | 0 | 59 | 0 |
| Quadrant | Total seconds | Saturated seconds | Saturation percentage |
|---|---|---|---|
| A | 13173 | 113 | 0.857815% |
| B | 13174 | 97 | 0.736299% |
| C | 13174 | 22 | 0.166996% |
| D | 13174 | 5058 | 38.393806% |
Noise dominated data is calculated using 1-second bins in cleaned event files. If a bin has >2000 counts, and if more than 50% of those come from <1% of pixels, then it is considered to be noise-dominated and hence unusable.
| Quadrant | # 1 sec bins | Bins with >0 counts | Bins with >2000 counts | High rate bins dominated by noise | Noise dominated (total time) | Noise dominated (detector-on time) | Marked lightcurve |
|---|---|---|---|---|---|---|---|
| A | 19001 | 13177 | 57 | 57 | 0.30% | 0.43% | 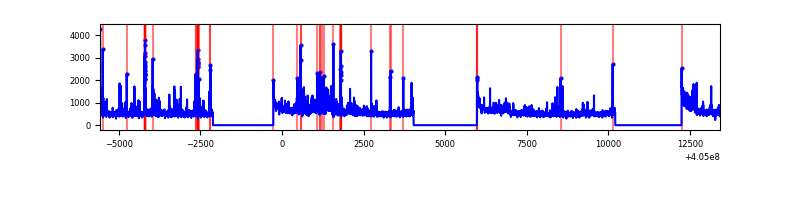 |
| B | 19001 | 13177 | 48 | 48 | 0.25% | 0.36% | 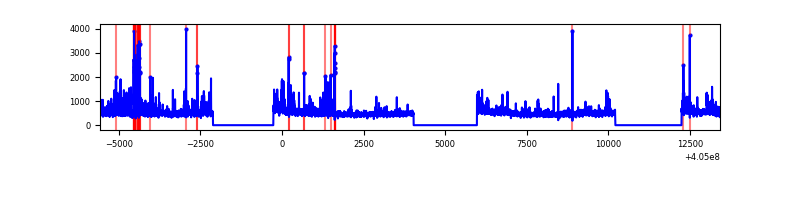 |
| C | 19001 | 13177 | 16 | 16 | 0.08% | 0.12% | 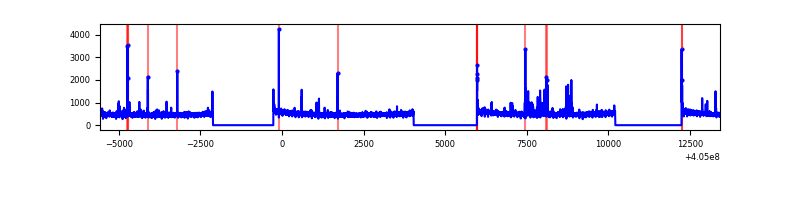 |
| D | 19001 | 13177 | 6042 | 6042 | 31.80% | 45.85% | 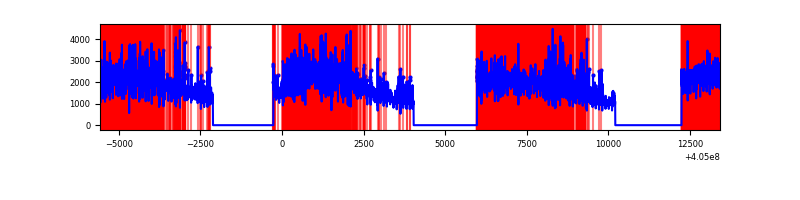 |
Top three noisy pixels from each quadrant. If the there are fewer than three noisy pixels in the level2.evt file, extra rows are filled as -1
| Pixel properties | Quadrant properties | ||||||
|---|---|---|---|---|---|---|---|
| Quadrant | DetID | PixID | Counts | Sigma | Mean | Median | Sigma |
| A | 10 | 83 | 895573 | 2922.43 | 1537 | 1509 | 305.9 |
| A | 12 | 16 | 604289 | 1970.31 | 1537 | 1509 | 305.9 |
| A | 9 | 143 | 379343 | 1235.03 | 1537 | 1509 | 305.9 |
| B | 4 | 170 | 238067 | 841.17 | 1537 | 1500 | 281.2 |
| B | 0 | 183 | 230427 | 814.01 | 1537 | 1500 | 281.2 |
| B | 5 | 172 | 156656 | 551.7 | 1537 | 1500 | 281.2 |
| C | 15 | 214 | 553263 | 1626.81 | 1484 | 1499 | 339.2 |
| C | 15 | 159 | 181658 | 531.18 | 1484 | 1499 | 339.2 |
| C | 14 | 254 | 45810 | 130.65 | 1484 | 1499 | 339.2 |
| D | 10 | 203 | 16628230 | 49621.5 | 1362 | 1324 | 335.1 |
| D | 2 | 16 | 992501 | 2958.08 | 1362 | 1324 | 335.1 |
| D | 12 | 227 | 751075 | 2237.56 | 1362 | 1324 | 335.1 |
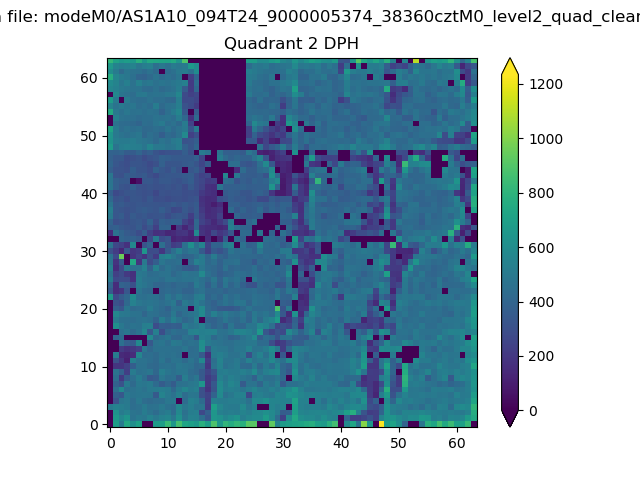
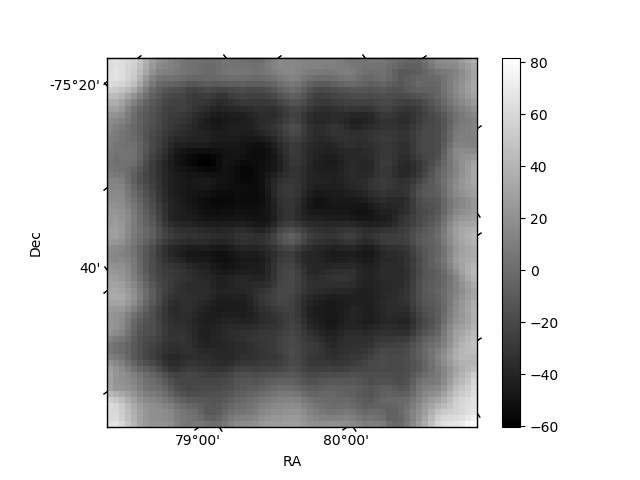
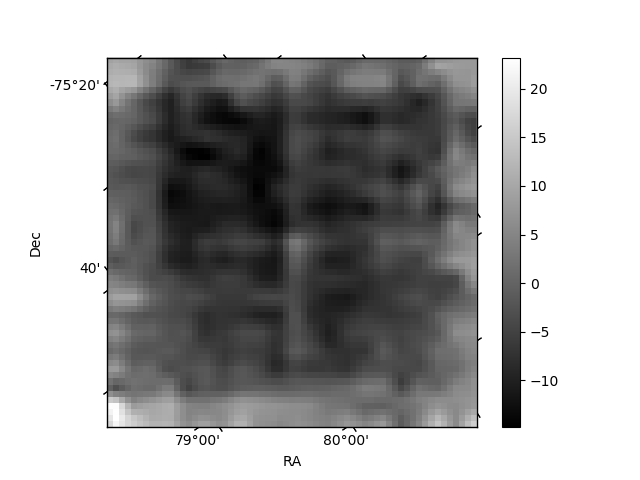
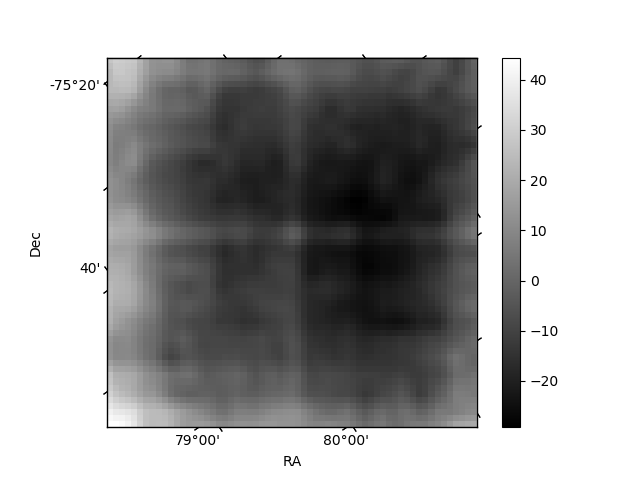
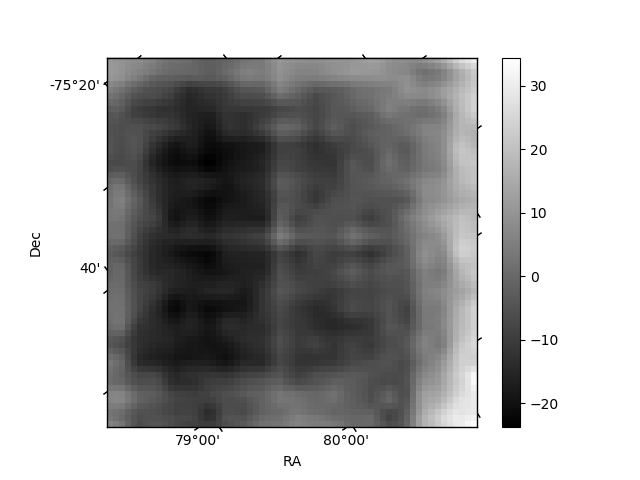
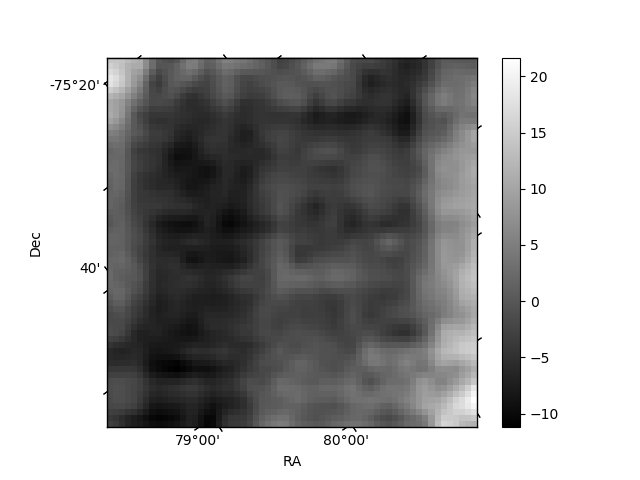
Histogram calculated using DETX and DETY for each event in the final _common_clean file
| Quadrant A | 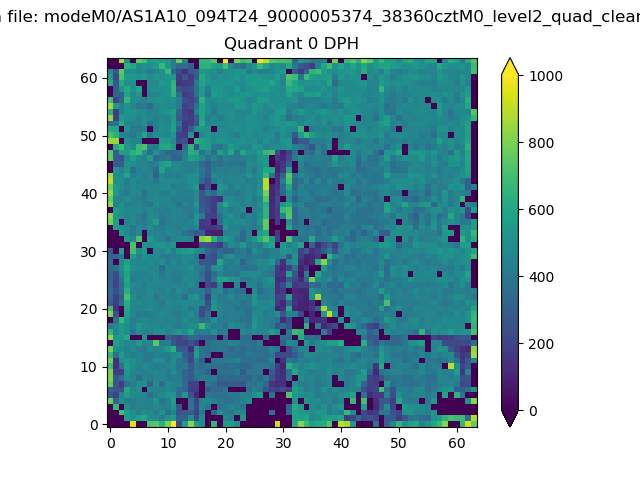 |
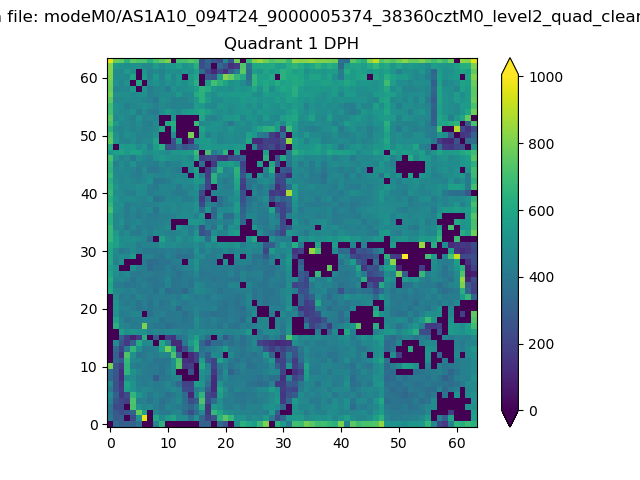 |
Quadrant B |
|---|---|---|---|
| Quadrant D | 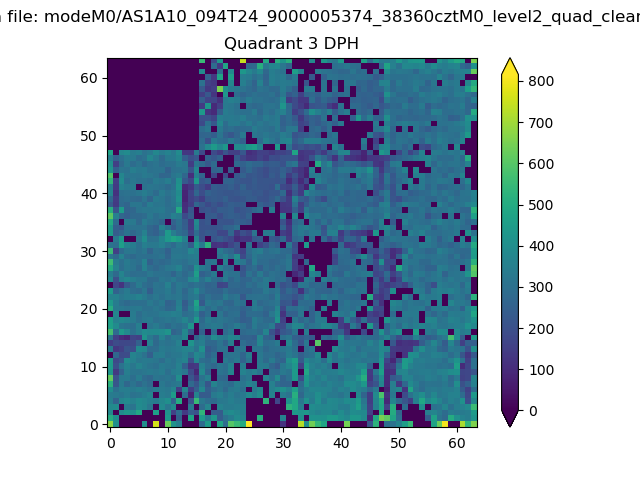 |
 |
Quadrant C |
| Plot type | Count rate plots | Images |
|---|---|---|
| Comparison with Poisson distribution Blue bars denote a histogram of data divided into 1 sec bins. Red curve is a Poisson curve with rate = median count rate of data. |
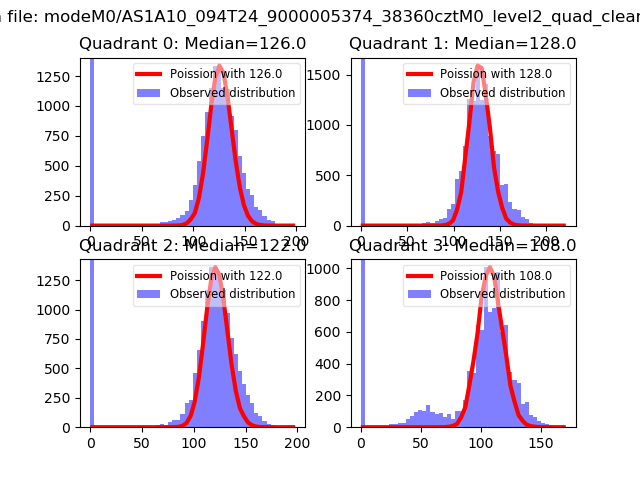 |
 |
| Quadrant-wise count rates Data is divided into 100 sec bins |
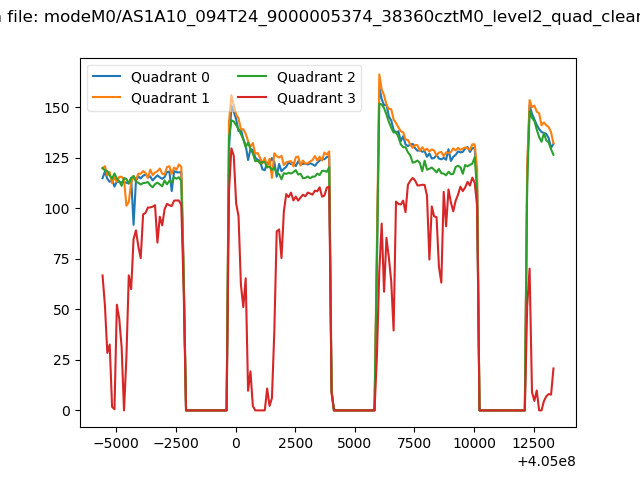 |
|
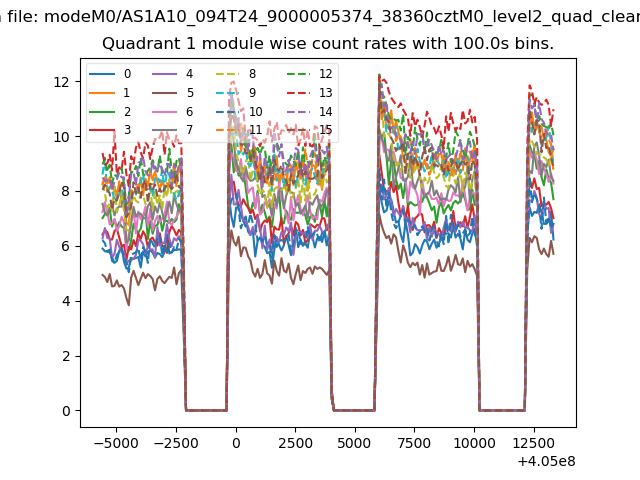
| Module-wise count rates for Quadrant A Data is divided into 100 sec bins |
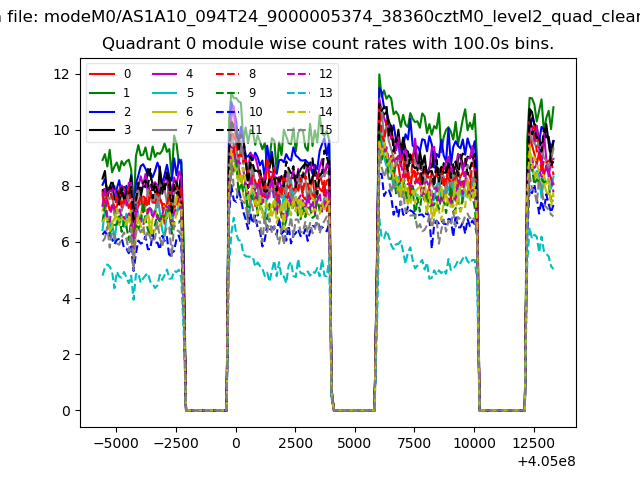 |
 |
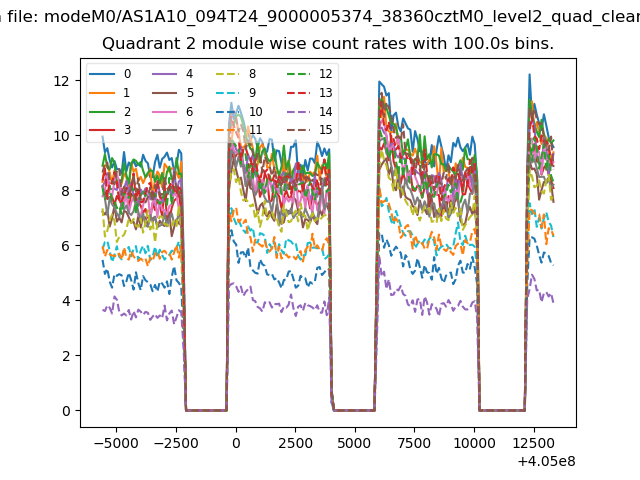
| Module-wise count rates for Quadrant B Data is divided into 100 sec bins |
 |
 |
| Module-wise count rates for Quadrant C Data is divided into 100 sec bins |
 |
 |
| Module-wise count rates for Quadrant D Data is divided into 100 sec bins |
 |
 |
| Parameter | Plot |
|---|---|
| CZT HV Monitor | 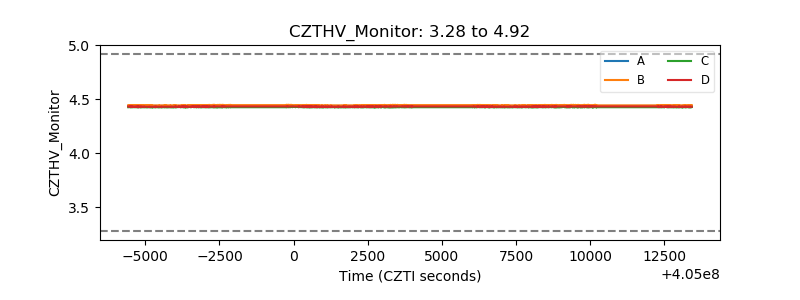 |
| D_VDD | 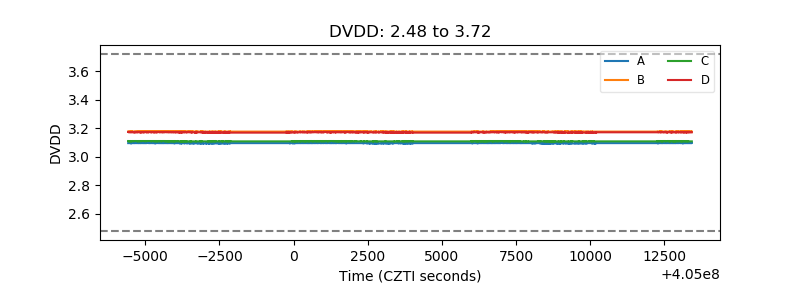 |
| Temperature 1 | 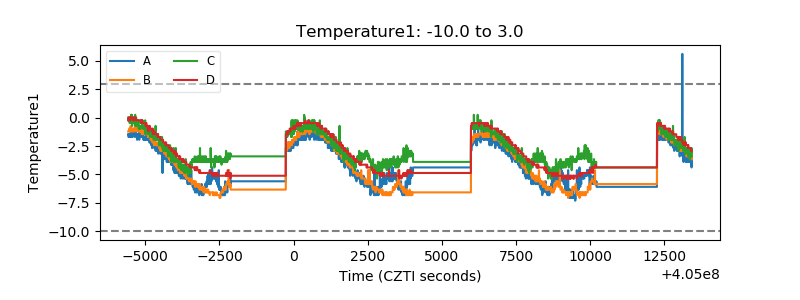 |
| Veto HV Monitor | 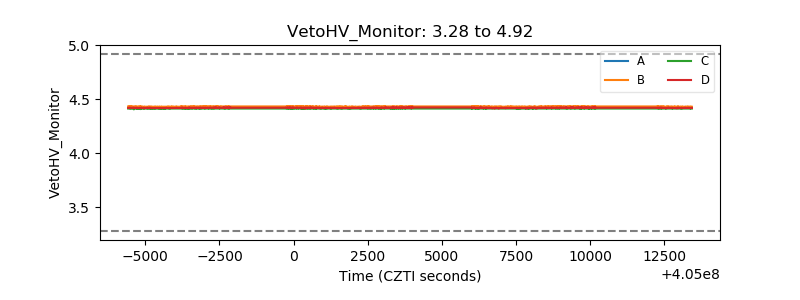 |
| Veto LLD | 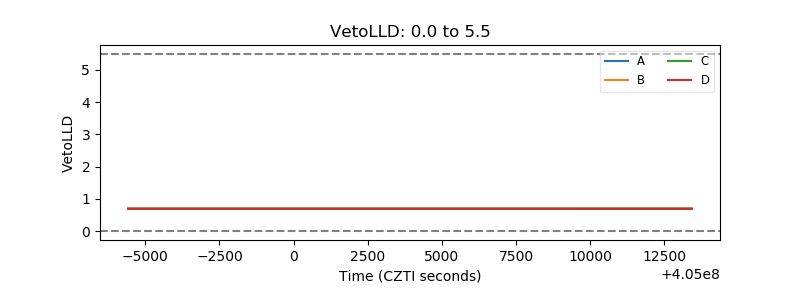 |
| Alpha Counter | 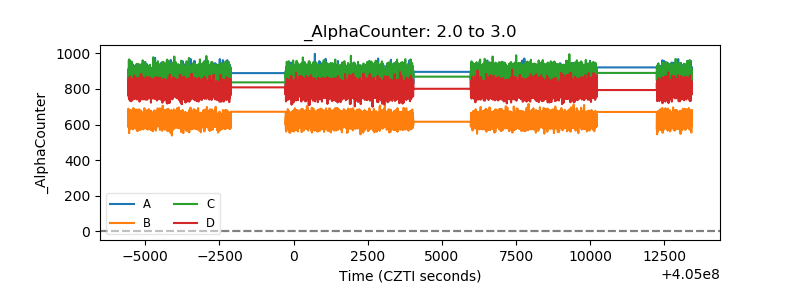 |
| _CPM_Rate |  |
| CZT Counter | 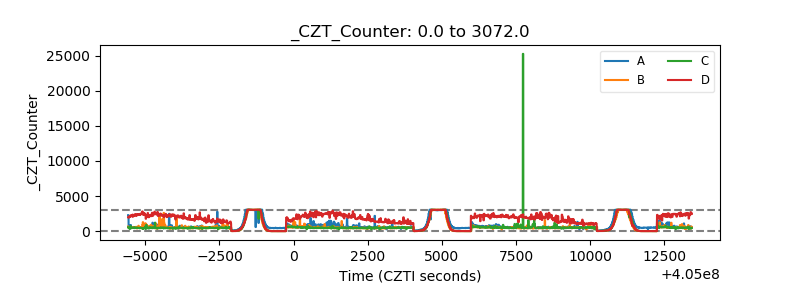 |
| +2.5 Volts monitor | 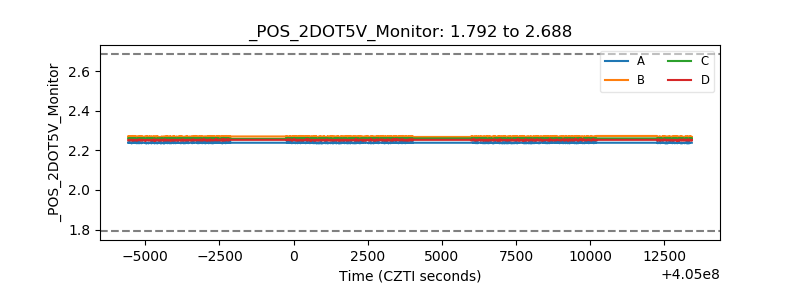 |
| +5 Volts monitor | 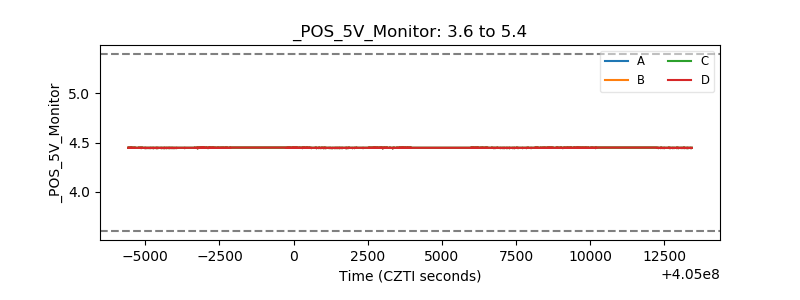 |
| _ROLL_ROT | 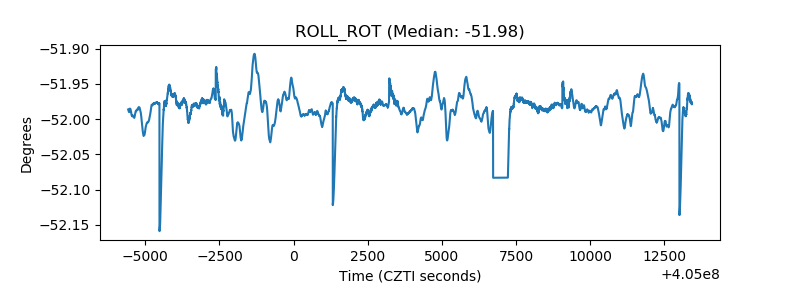 |
| _Roll_DEC | 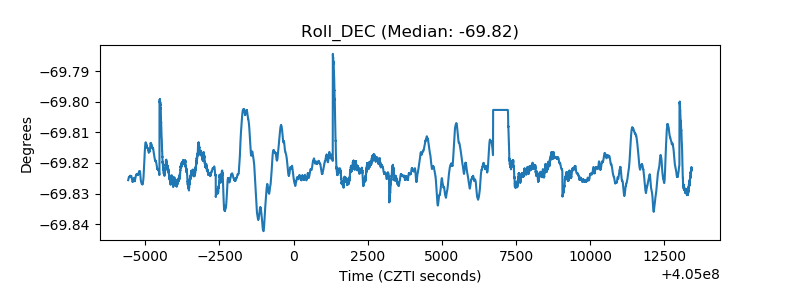 |
| _Roll_RA | 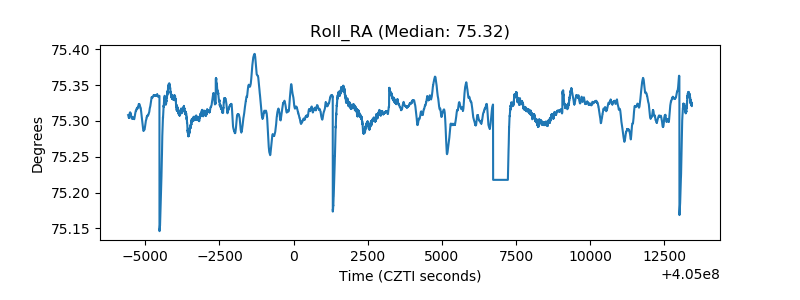 |
| Veto Counter | 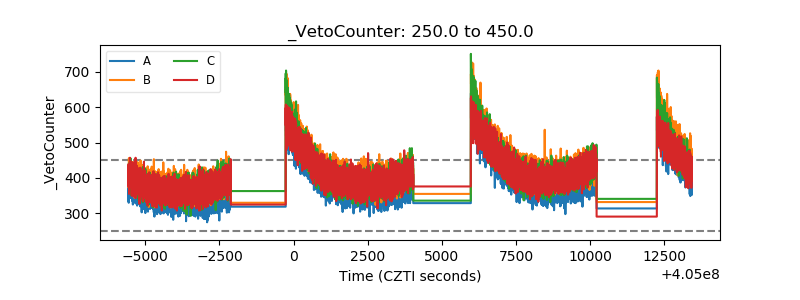 |