| Param | Original file | Final file |
|---|---|---|
| Filename | modeM0/AS1A10_094T24_9000005374_38361cztM0_level2.fits | modeM0/AS1A10_094T24_9000005374_38361cztM0_level2_quad_clean.evt |
| Size (bytes) | 498,775,680 | 90,072,000 |
| Size | 475.7 MB | 85.9 MB |
| Events in quadrant A | 3,098,568 | 669,040 |
| Events in quadrant B | 2,833,397 | 678,221 |
| Events in quadrant C | 2,544,038 | 640,227 |
| Events in quadrant D | 9,592,697 | 383,999 |
| Mode SS | |||
|---|---|---|---|
| Quadrant | BADHDUFLAG | Total packets | Discarded packets |
| A | 0 | 104 | 0 |
| B | 0 | 104 | 0 |
| C | 0 | 104 | 0 |
| D | 0 | 104 | 0 |
| Mode M0 | |||
|---|---|---|---|
| Quadrant | BADHDUFLAG | Total packets | Discarded packets |
| A | 0 | 12304 | 3 |
| B | 0 | 11731 | 2 |
| C | 0 | 10529 | 2 |
| D | 0 | 31984 | 2 |
| Mode M9 | |||
|---|---|---|---|
| Quadrant | BADHDUFLAG | Total packets | Discarded packets |
| A | 0 | 24 | 0 |
| B | 0 | 24 | 0 |
| C | 0 | 24 | 0 |
| D | 0 | 25 | 0 |
| Quadrant | Total seconds | Saturated seconds | Saturation percentage |
|---|---|---|---|
| A | 5079 | 29 | 0.570979% |
| B | 5079 | 57 | 1.122268% |
| C | 5079 | 14 | 0.275645% |
| D | 5079 | 2015 | 39.673164% |
Noise dominated data is calculated using 1-second bins in cleaned event files. If a bin has >2000 counts, and if more than 50% of those come from <1% of pixels, then it is considered to be noise-dominated and hence unusable.
| Quadrant | # 1 sec bins | Bins with >0 counts | Bins with >2000 counts | High rate bins dominated by noise | Noise dominated (total time) | Noise dominated (detector-on time) | Marked lightcurve |
|---|---|---|---|---|---|---|---|
| A | 7203 | 5080 | 4 | 4 | 0.06% | 0.08% | 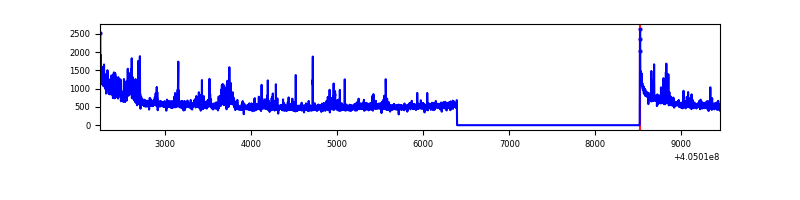 |
| B | 7203 | 5080 | 27 | 27 | 0.37% | 0.53% | 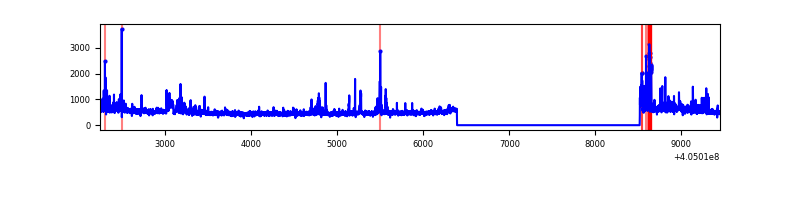 |
| C | 7203 | 5080 | 6 | 6 | 0.08% | 0.12% | 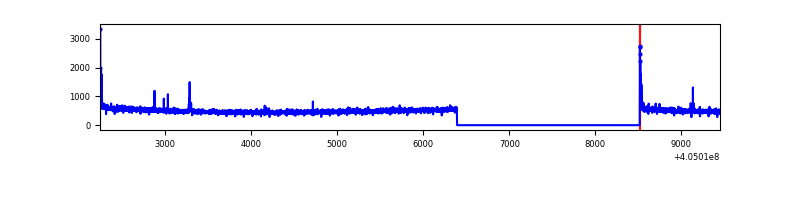 |
| D | 7203 | 5079 | 2573 | 2573 | 35.72% | 50.66% | 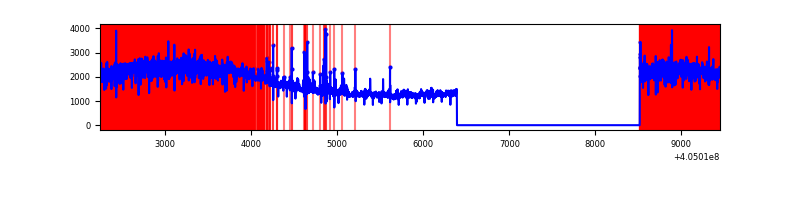 |
Top three noisy pixels from each quadrant. If the there are fewer than three noisy pixels in the level2.evt file, extra rows are filled as -1
| Pixel properties | Quadrant properties | ||||||
|---|---|---|---|---|---|---|---|
| Quadrant | DetID | PixID | Counts | Sigma | Mean | Median | Sigma |
| A | 10 | 83 | 410594 | 3370.62 | 602 | 593 | 121.6 |
| A | 12 | 16 | 212548 | 1742.48 | 602 | 593 | 121.6 |
| A | 9 | 143 | 56733 | 461.53 | 602 | 593 | 121.6 |
| B | 0 | 183 | 151694 | 1349.14 | 601 | 587 | 112.0 |
| B | 5 | 172 | 93132 | 826.28 | 601 | 587 | 112.0 |
| B | 15 | 35 | 48766 | 430.16 | 601 | 587 | 112.0 |
| C | 15 | 214 | 215213 | 1598.65 | 580 | 584 | 134.3 |
| C | 0 | 10 | 47680 | 350.79 | 580 | 584 | 134.3 |
| C | 0 | 207 | 7872 | 54.28 | 580 | 584 | 134.3 |
| D | 10 | 203 | 6937096 | 52904.01 | 539 | 523 | 131.1 |
| D | 2 | 16 | 246440 | 1875.56 | 539 | 523 | 131.1 |
| D | 12 | 235 | 147878 | 1123.85 | 539 | 523 | 131.1 |
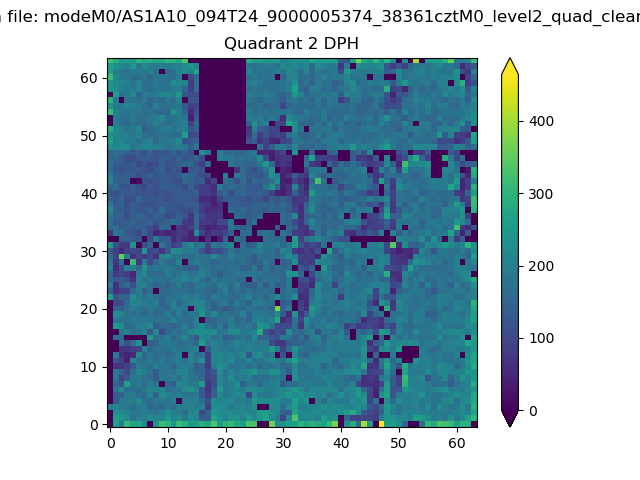
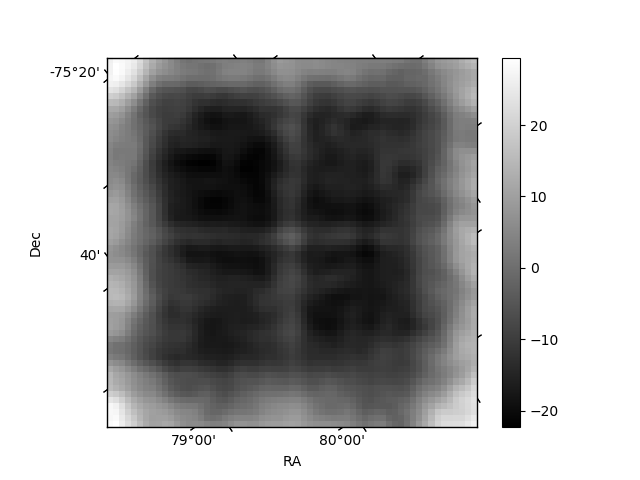
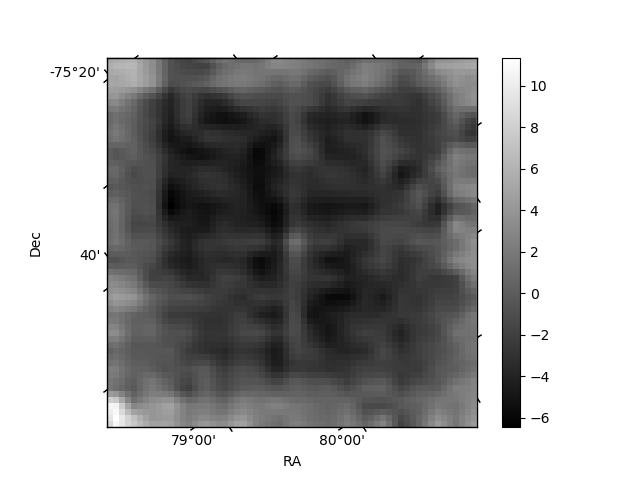
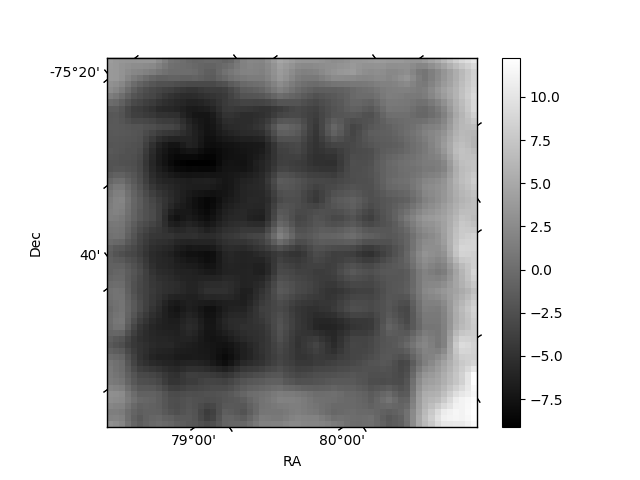
Histogram calculated using DETX and DETY for each event in the final _common_clean file
| Quadrant A | 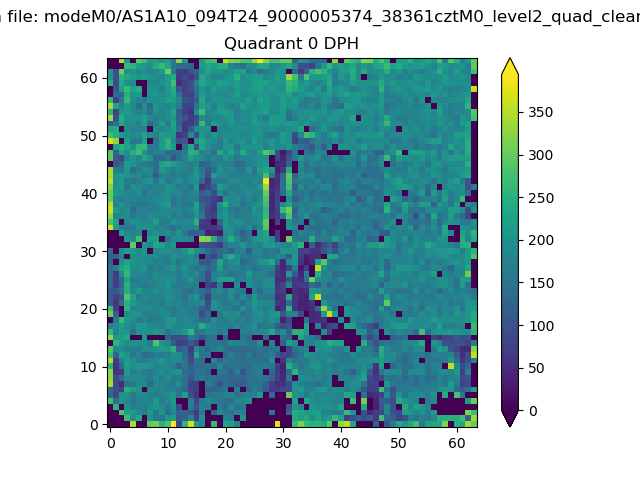 |
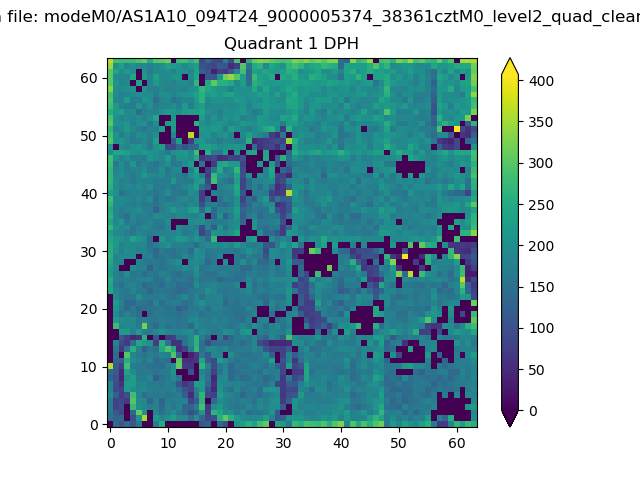 |
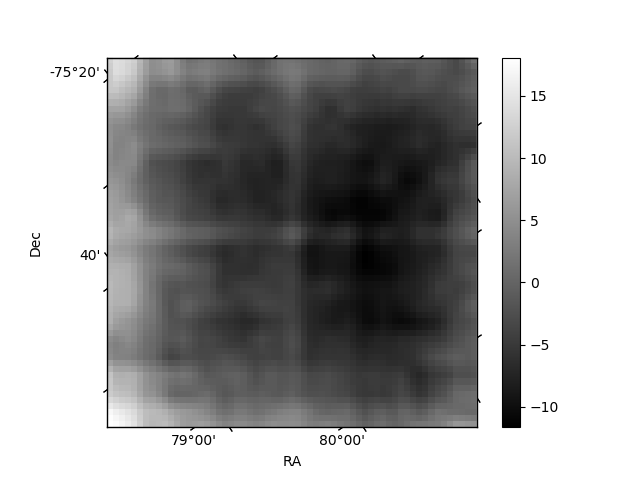
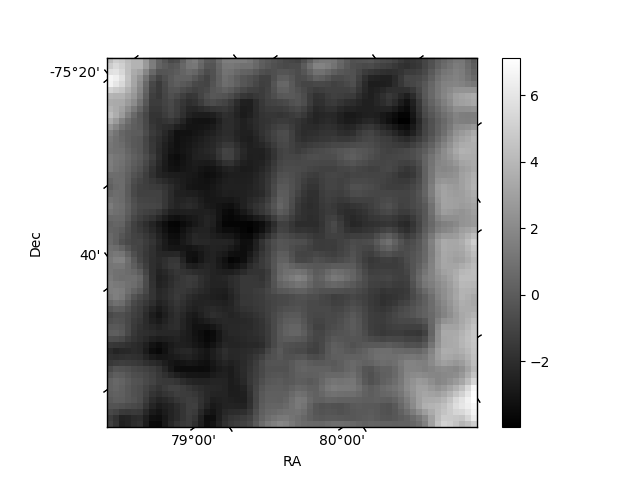
Quadrant B |
|---|---|---|---|
| Quadrant D | 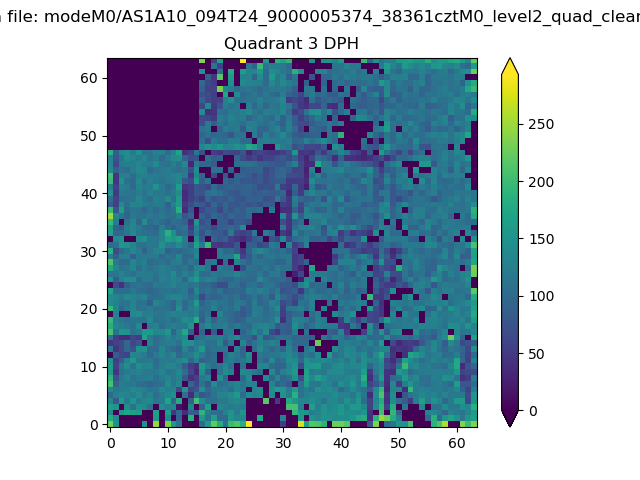 |
 |
Quadrant C |
| Plot type | Count rate plots | Images |
|---|---|---|
| Comparison with Poisson distribution Blue bars denote a histogram of data divided into 1 sec bins. Red curve is a Poisson curve with rate = median count rate of data. |
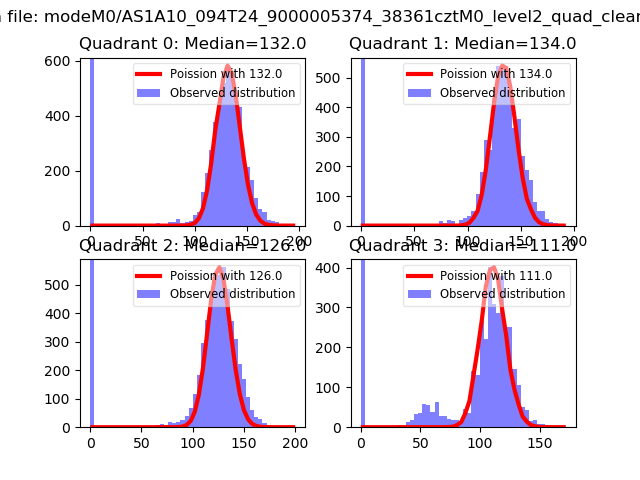 |
 |
| Quadrant-wise count rates Data is divided into 100 sec bins |
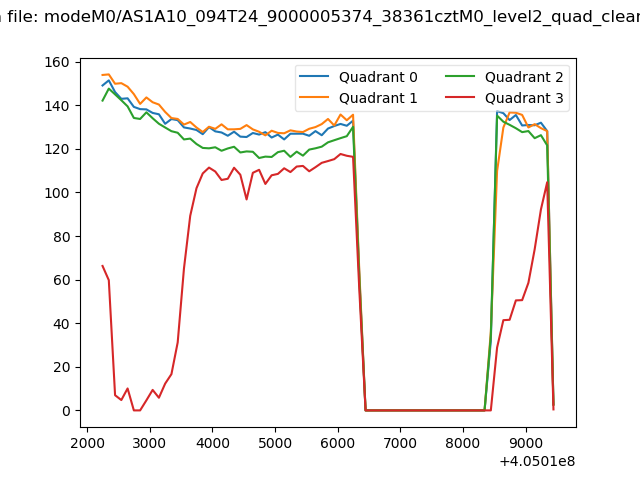 |
|
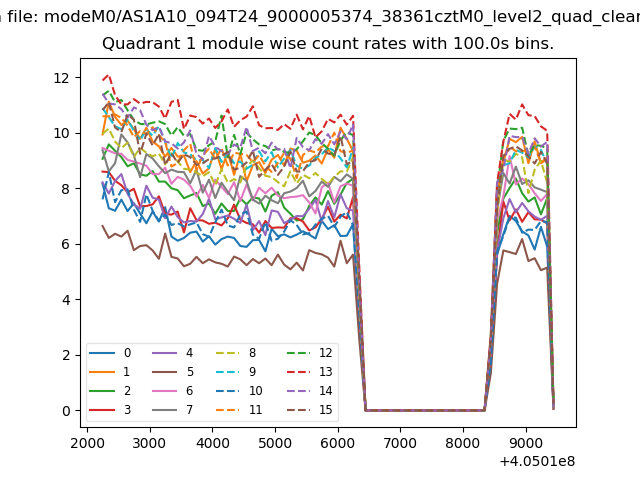
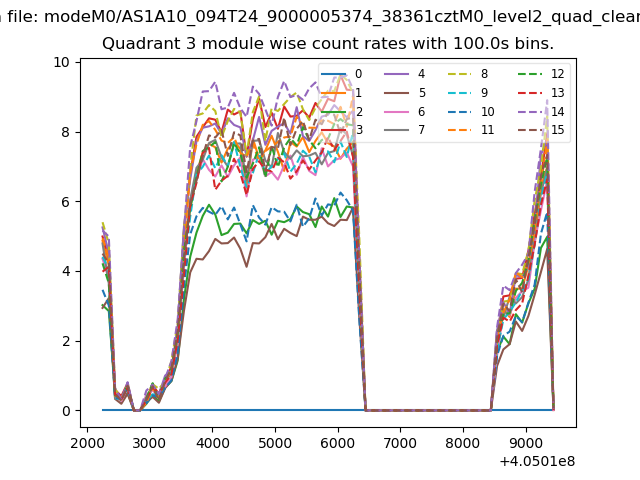
| Module-wise count rates for Quadrant A Data is divided into 100 sec bins |
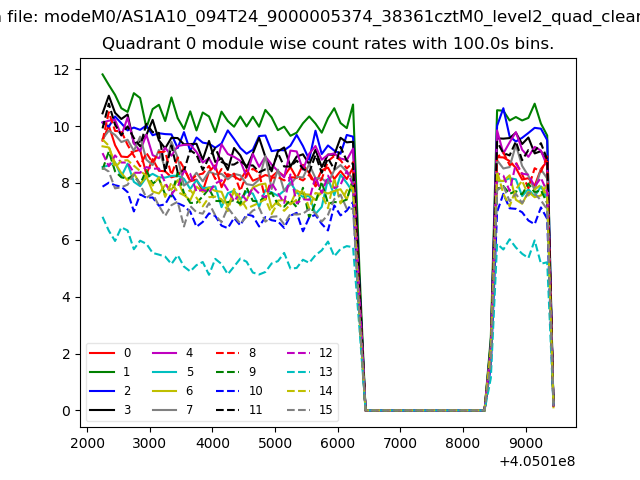 |
 |
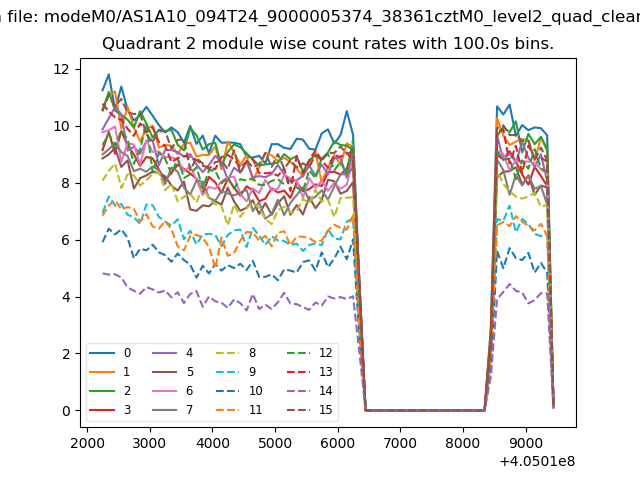
| Module-wise count rates for Quadrant B Data is divided into 100 sec bins |
 |
 |
| Module-wise count rates for Quadrant C Data is divided into 100 sec bins |
 |
 |
| Module-wise count rates for Quadrant D Data is divided into 100 sec bins |
 |
 |
| Parameter | Plot |
|---|---|
| CZT HV Monitor | 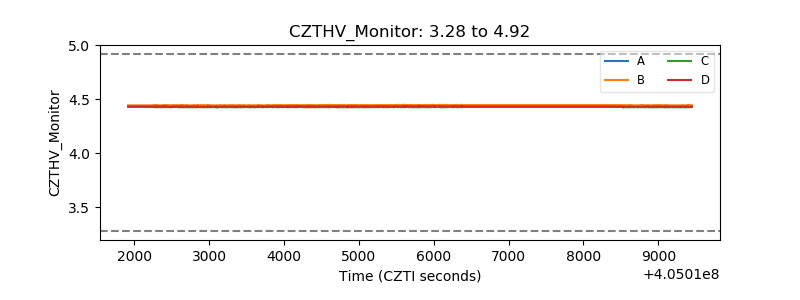 |
| D_VDD | 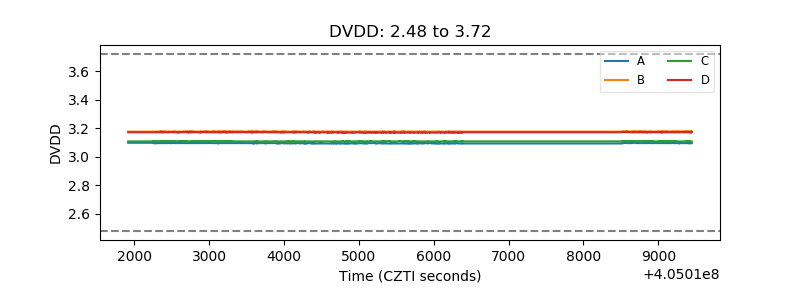 |
| Temperature 1 | 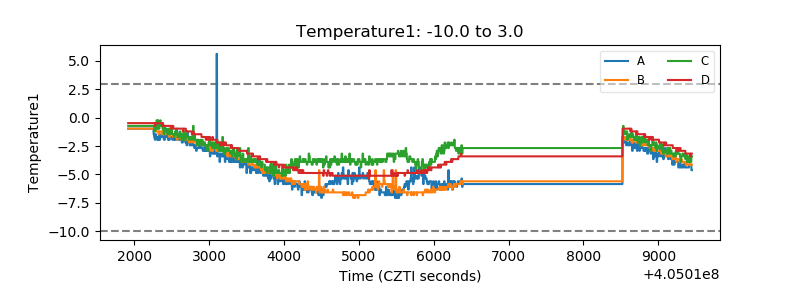 |
| Veto HV Monitor | 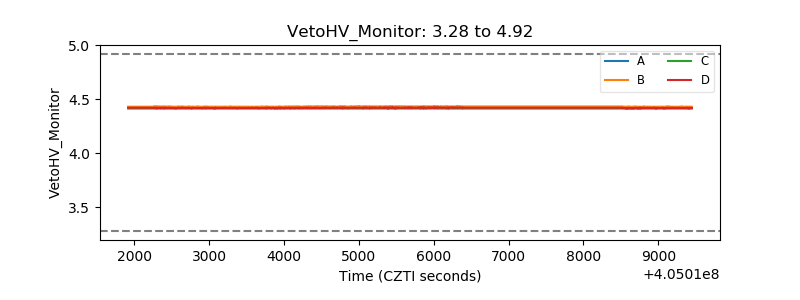 |
| Veto LLD | 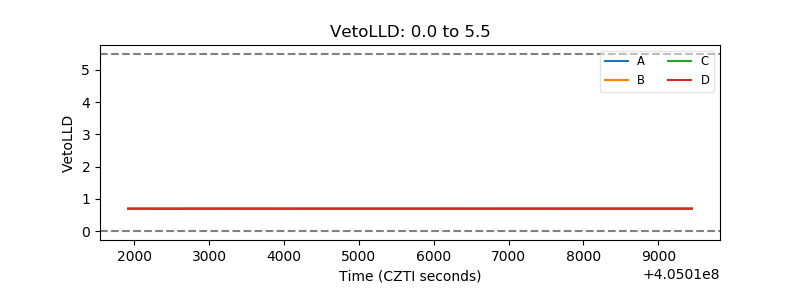 |
| Alpha Counter | 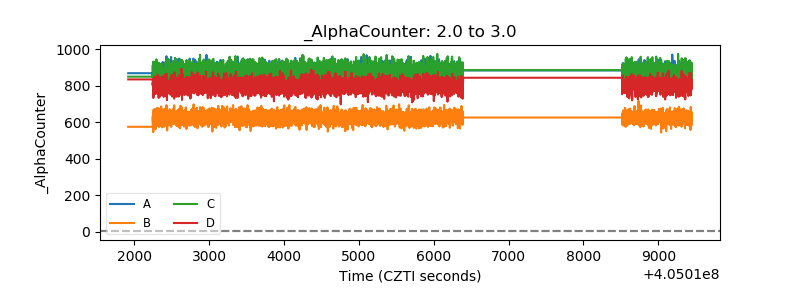 |
| _CPM_Rate | 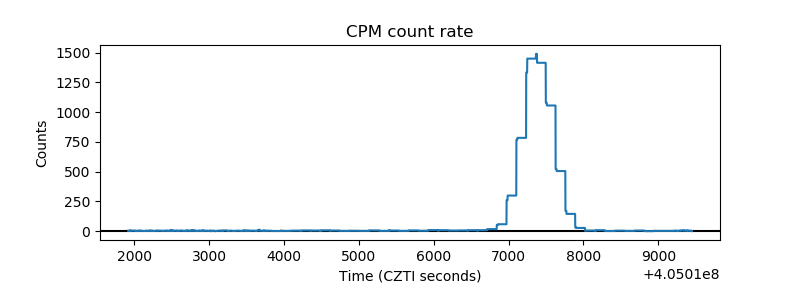 |
| CZT Counter | 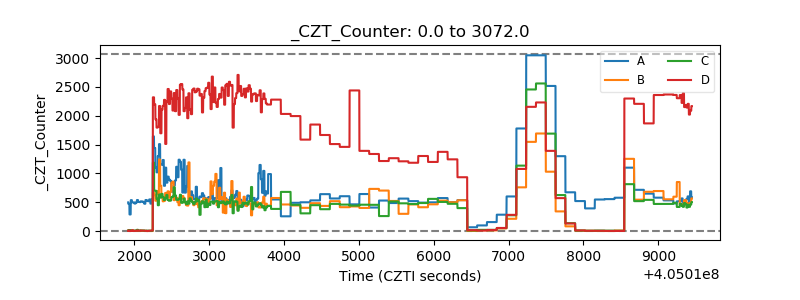 |
| +2.5 Volts monitor | 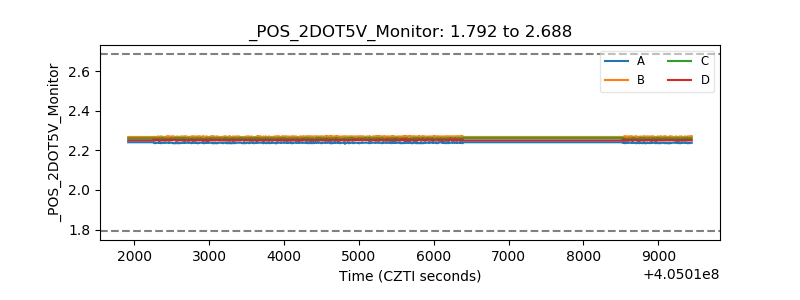 |
| +5 Volts monitor | 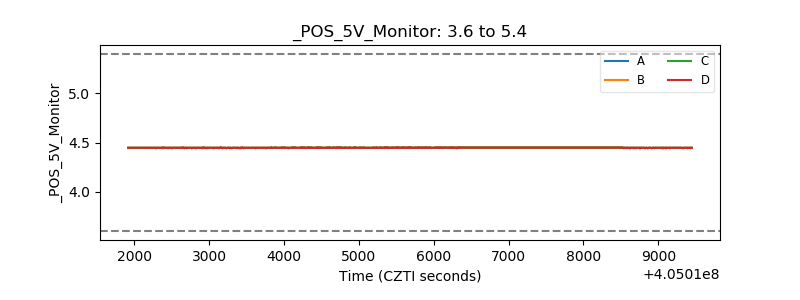 |
| _ROLL_ROT | 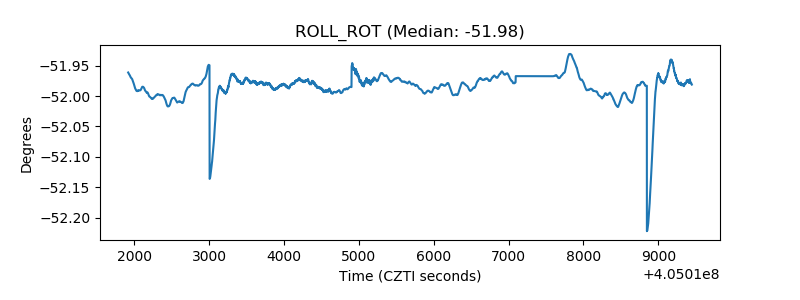 |
| _Roll_DEC | 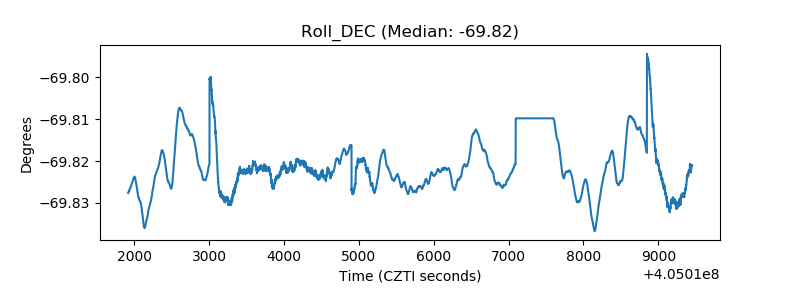 |
| _Roll_RA | 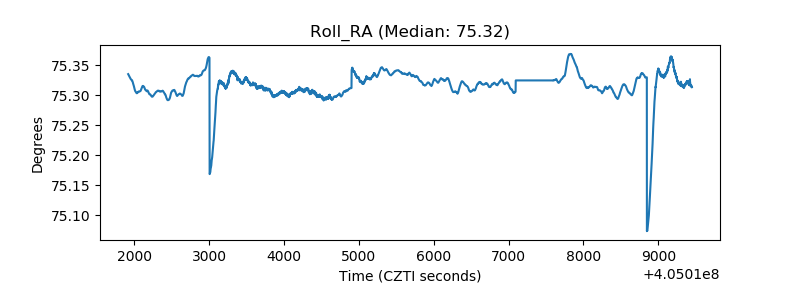 |
| Veto Counter | 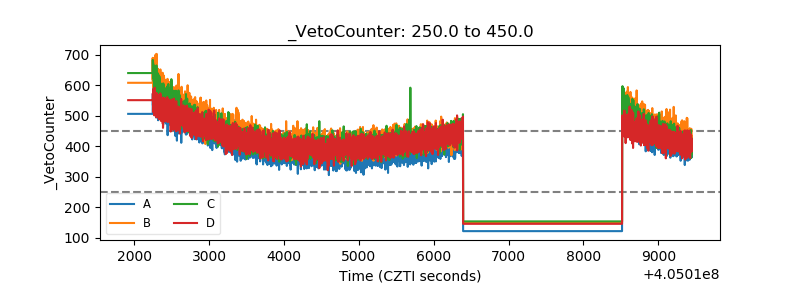 |