| Param | Original file | Final file |
|---|---|---|
| Filename | modeM0/AS1A10_094T24_9000005374_38362cztM0_level2.fits | modeM0/AS1A10_094T24_9000005374_38362cztM0_level2_quad_clean.evt |
| Size (bytes) | 450,875,520 | 86,477,760 |
| Size | 430.0 MB | 82.5 MB |
| Events in quadrant A | 2,997,087 | 611,865 |
| Events in quadrant B | 2,658,108 | 624,023 |
| Events in quadrant C | 2,396,066 | 589,688 |
| Events in quadrant D | 8,255,575 | 446,474 |
| Mode SS | |||
|---|---|---|---|
| Quadrant | BADHDUFLAG | Total packets | Discarded packets |
| A | 0 | 102 | 0 |
| B | 0 | 102 | 0 |
| C | 0 | 102 | 0 |
| D | 0 | 102 | 0 |
| Mode M0 | |||
|---|---|---|---|
| Quadrant | BADHDUFLAG | Total packets | Discarded packets |
| A | 0 | 12128 | 3 |
| B | 0 | 11158 | 2 |
| C | 0 | 10137 | 2 |
| D | 0 | 27964 | 2 |
| Mode M9 | |||
|---|---|---|---|
| Quadrant | BADHDUFLAG | Total packets | Discarded packets |
| A | 0 | 29 | 0 |
| B | 0 | 29 | 0 |
| C | 0 | 29 | 0 |
| D | 0 | 30 | 0 |
| Quadrant | Total seconds | Saturated seconds | Saturation percentage |
|---|---|---|---|
| A | 4937 | 38 | 0.769698% |
| B | 4937 | 56 | 1.134292% |
| C | 4937 | 15 | 0.303828% |
| D | 4937 | 1155 | 23.394774% |
Noise dominated data is calculated using 1-second bins in cleaned event files. If a bin has >2000 counts, and if more than 50% of those come from <1% of pixels, then it is considered to be noise-dominated and hence unusable.
| Quadrant | # 1 sec bins | Bins with >0 counts | Bins with >2000 counts | High rate bins dominated by noise | Noise dominated (total time) | Noise dominated (detector-on time) | Marked lightcurve |
|---|---|---|---|---|---|---|---|
| A | 7060 | 4938 | 19 | 19 | 0.27% | 0.38% | 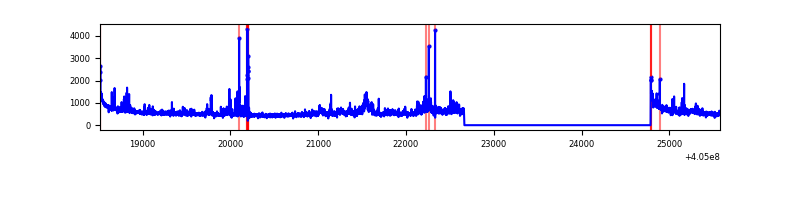 |
| B | 7060 | 4938 | 29 | 29 | 0.41% | 0.59% | 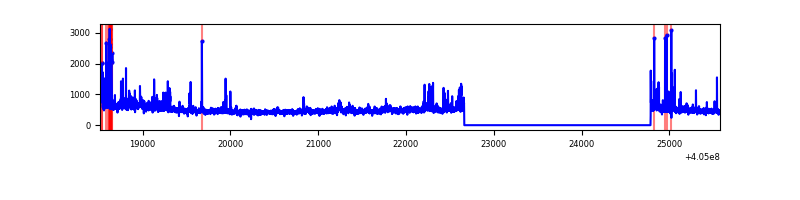 |
| C | 7060 | 4938 | 8 | 8 | 0.11% | 0.16% | 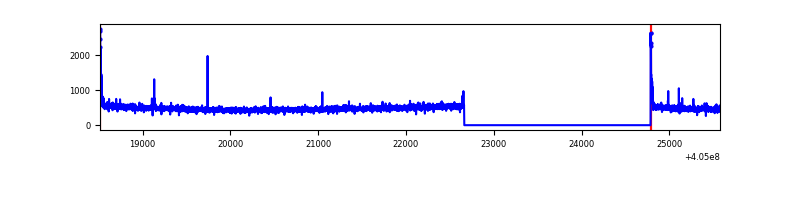 |
| D | 7060 | 4938 | 1764 | 1764 | 24.99% | 35.72% | 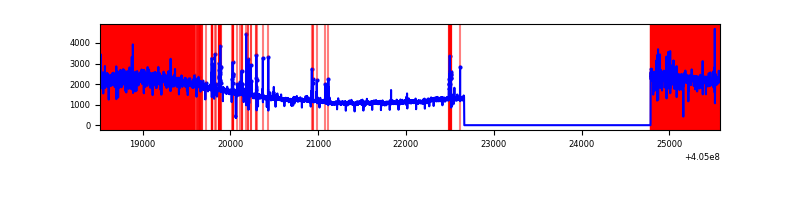 |
Top three noisy pixels from each quadrant. If the there are fewer than three noisy pixels in the level2.evt file, extra rows are filled as -1
| Pixel properties | Quadrant properties | ||||||
|---|---|---|---|---|---|---|---|
| Quadrant | DetID | PixID | Counts | Sigma | Mean | Median | Sigma |
| A | 10 | 83 | 396847 | 3499.34 | 560 | 551 | 113.2 |
| A | 12 | 16 | 203066 | 1788.23 | 560 | 551 | 113.2 |
| A | 9 | 143 | 112136 | 985.31 | 560 | 551 | 113.2 |
| B | 5 | 172 | 117342 | 1108.66 | 560 | 546 | 105.3 |
| B | 15 | 35 | 103561 | 977.85 | 560 | 546 | 105.3 |
| B | 0 | 183 | 85010 | 801.76 | 560 | 546 | 105.3 |
| C | 15 | 214 | 209579 | 1661.31 | 543 | 546 | 125.8 |
| C | 0 | 10 | 47819 | 375.71 | 543 | 546 | 125.8 |
| C | 14 | 254 | 6265 | 45.45 | 543 | 546 | 125.8 |
| D | 10 | 203 | 5854972 | 46337.82 | 516 | 501 | 126.3 |
| D | 12 | 227 | 99251 | 781.6 | 516 | 501 | 126.3 |
| D | 12 | 235 | 76868 | 604.44 | 516 | 501 | 126.3 |
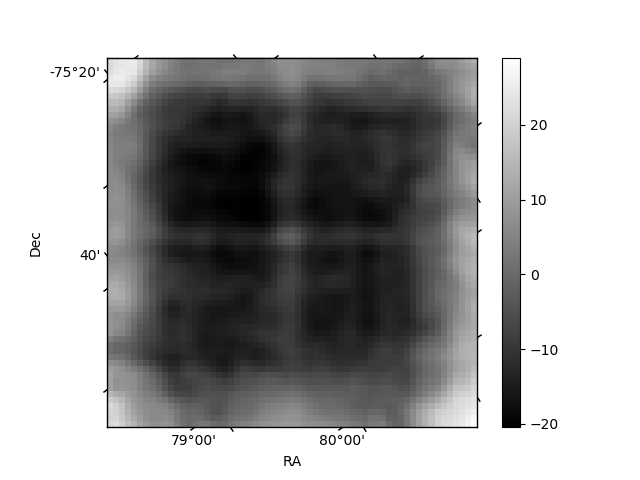
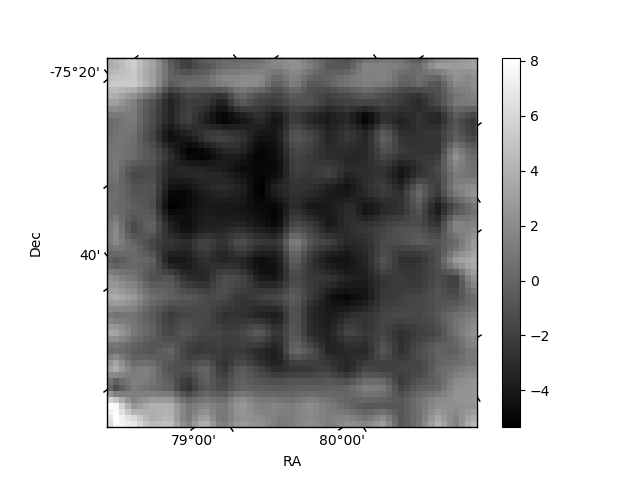
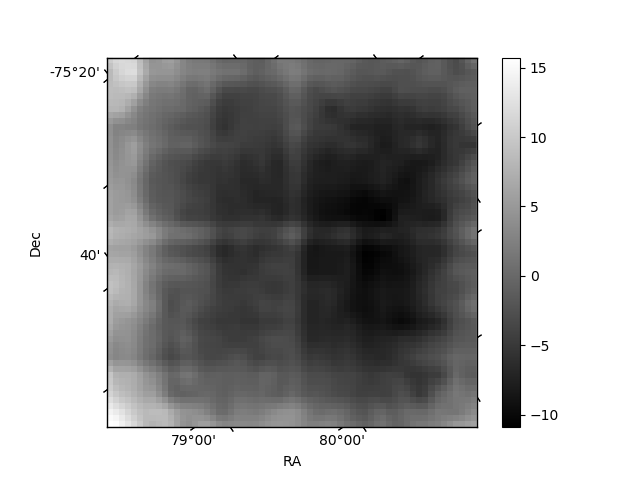
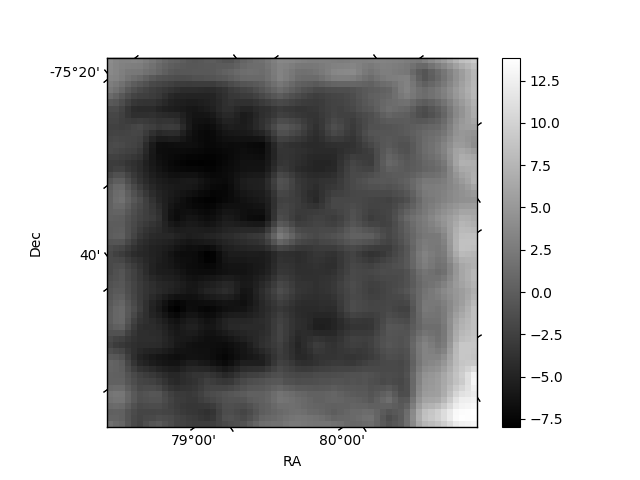
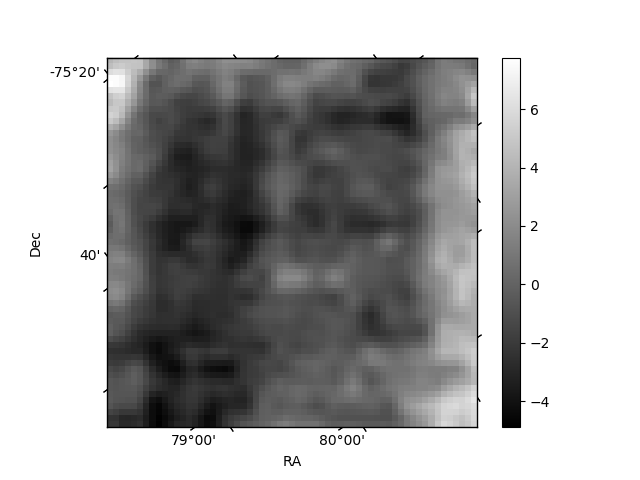
Histogram calculated using DETX and DETY for each event in the final _common_clean file
| Quadrant A | 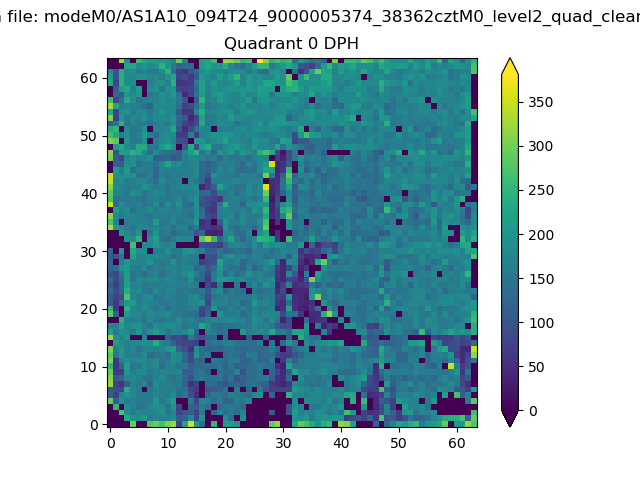 |
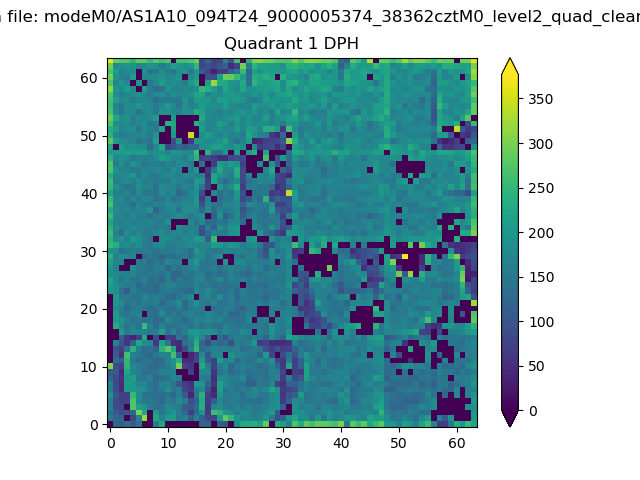 |
Quadrant B |
|---|---|---|---|
| Quadrant D | 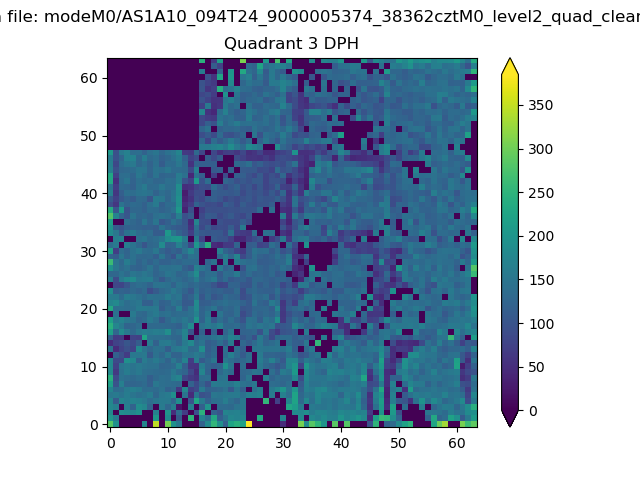 |
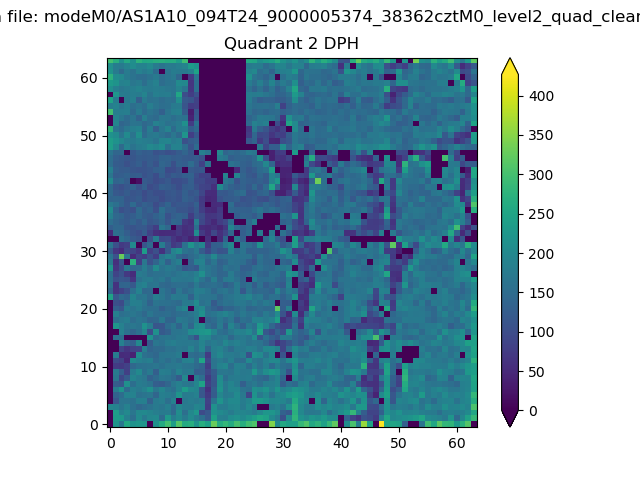 |
Quadrant C |
| Plot type | Count rate plots | Images |
|---|---|---|
| Comparison with Poisson distribution Blue bars denote a histogram of data divided into 1 sec bins. Red curve is a Poisson curve with rate = median count rate of data. |
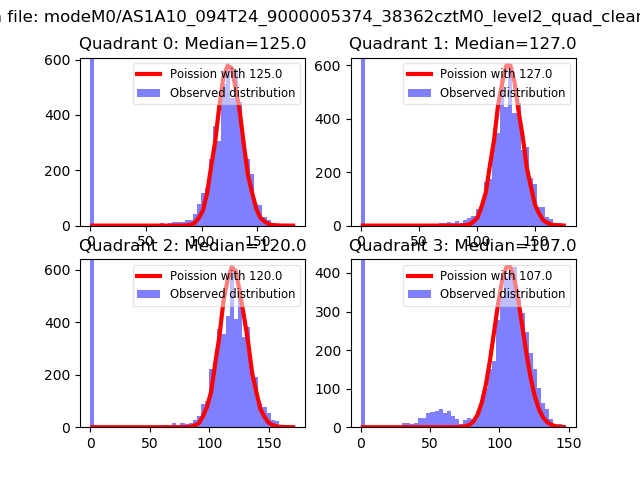 |
 |
| Quadrant-wise count rates Data is divided into 100 sec bins |
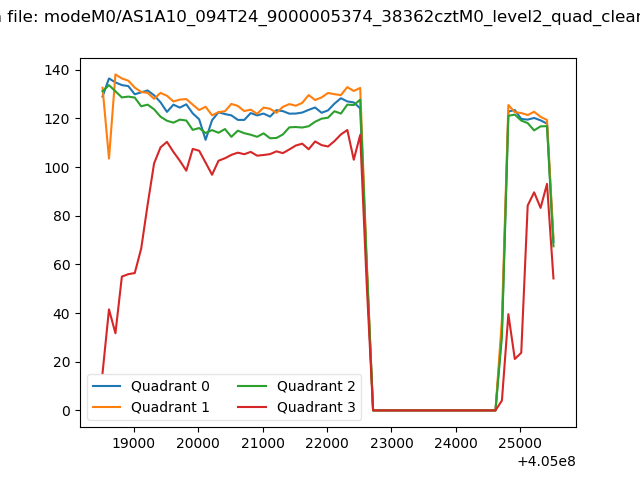 |
|
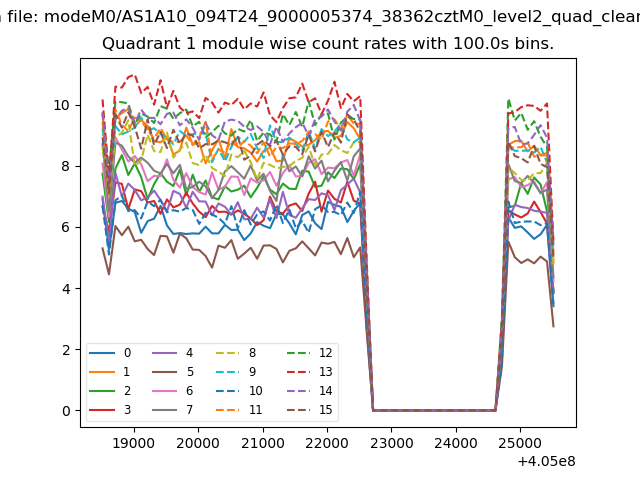
| Module-wise count rates for Quadrant A Data is divided into 100 sec bins |
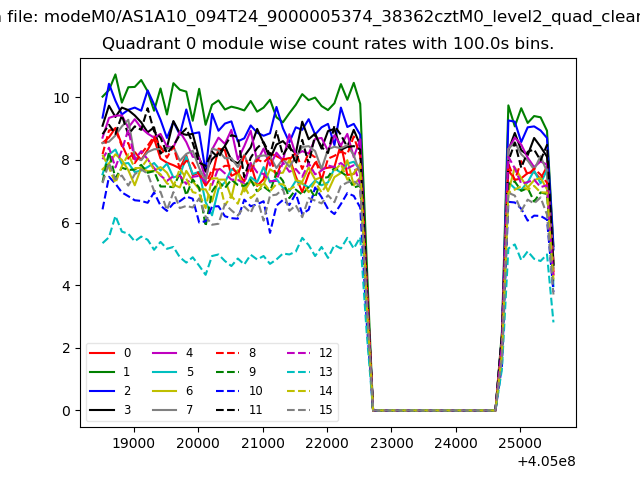 |
 |
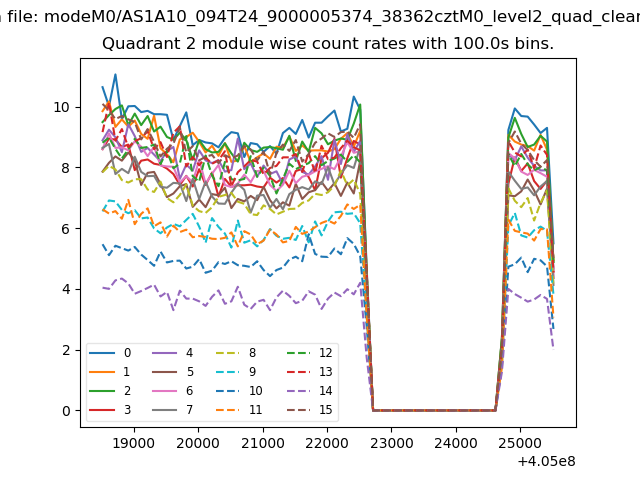
| Module-wise count rates for Quadrant B Data is divided into 100 sec bins |
 |
 |
| Module-wise count rates for Quadrant C Data is divided into 100 sec bins |
 |
 |
| Module-wise count rates for Quadrant D Data is divided into 100 sec bins |
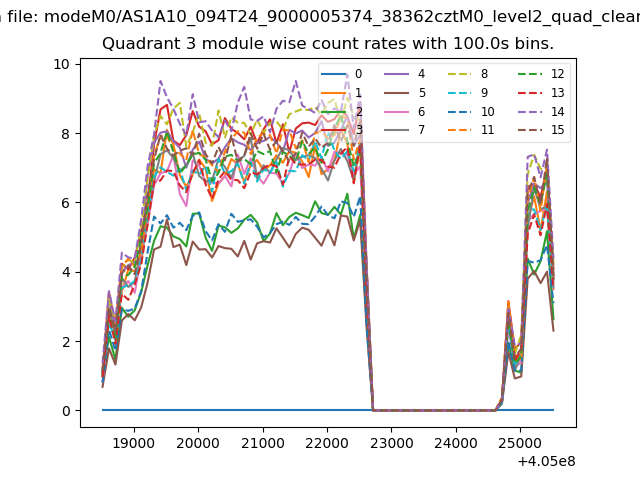 |
 |
| Parameter | Plot |
|---|---|
| CZT HV Monitor |  |
| D_VDD | 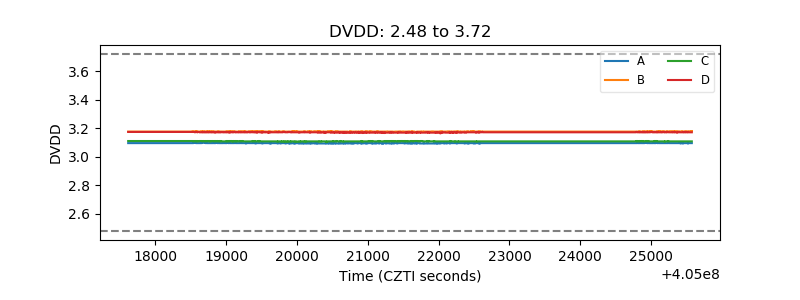 |
| Temperature 1 | 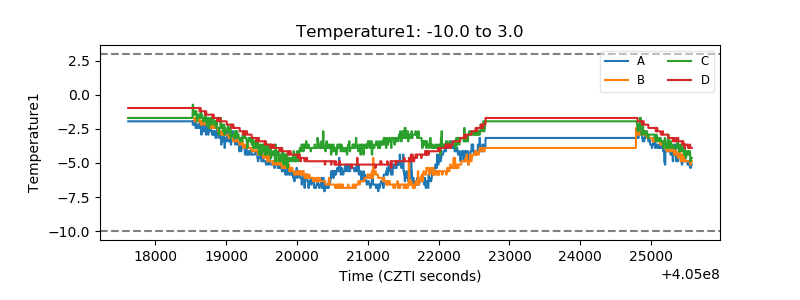 |
| Veto HV Monitor | 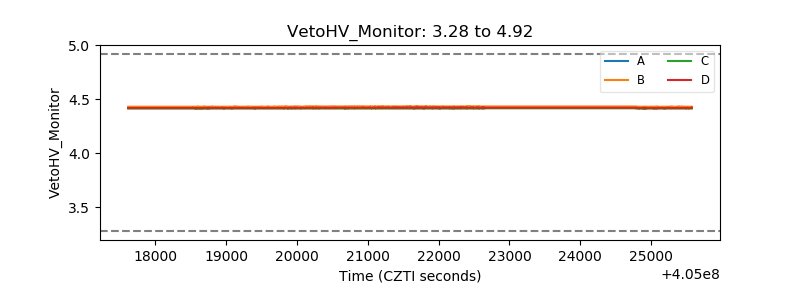 |
| Veto LLD | 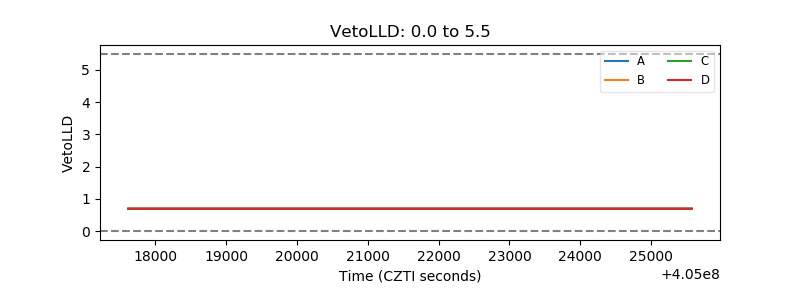 |
| Alpha Counter | 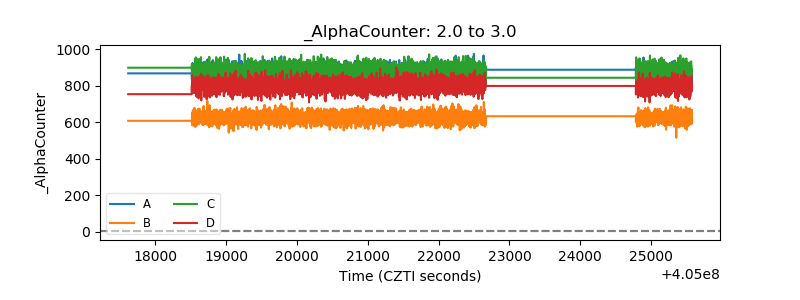 |
| _CPM_Rate | 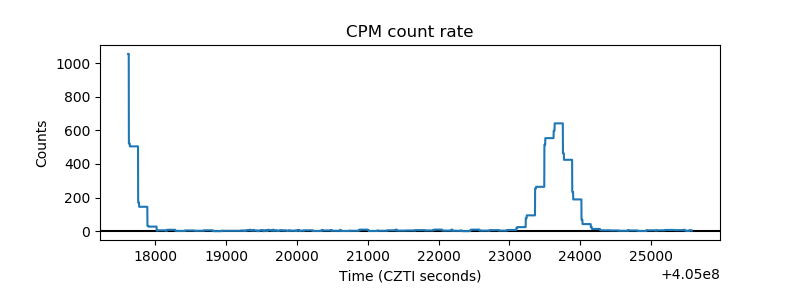 |
| CZT Counter | 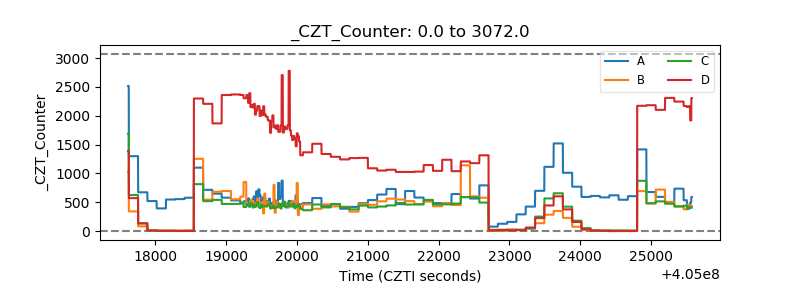 |
| +2.5 Volts monitor | 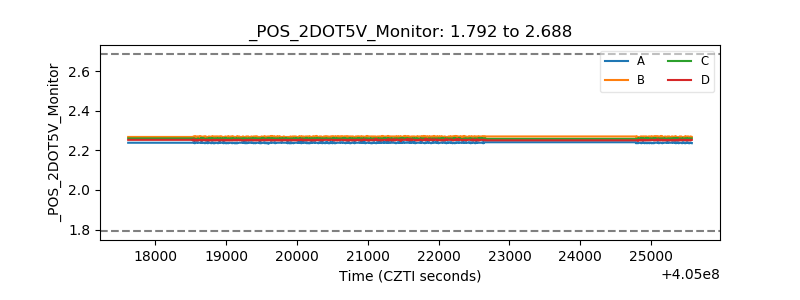 |
| +5 Volts monitor | 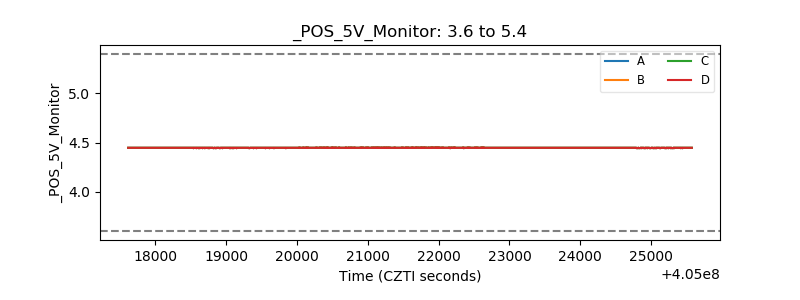 |
| _ROLL_ROT | 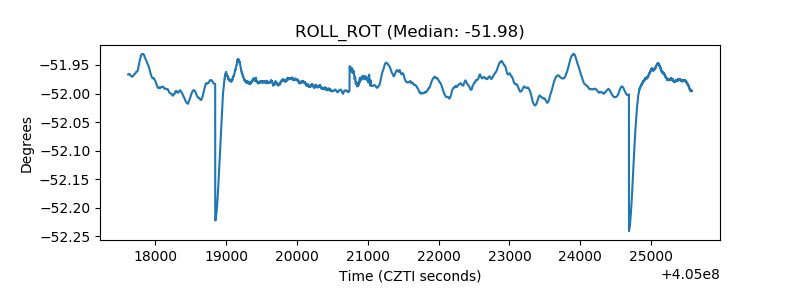 |
| _Roll_DEC |  |
| _Roll_RA | 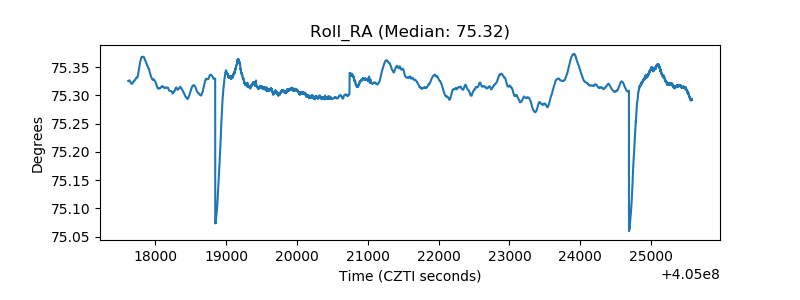 |
| Veto Counter | 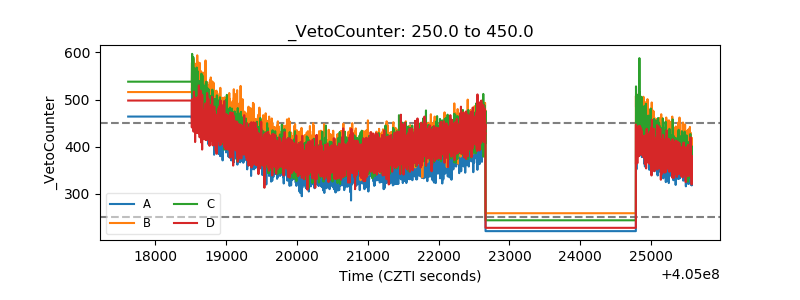 |