| Param | Original file | Final file |
|---|---|---|
| Filename | modeM0/AS1A10_094T24_9000005374_38363cztM0_level2.fits | modeM0/AS1A10_094T24_9000005374_38363cztM0_level2_quad_clean.evt |
| Size (bytes) | 450,797,760 | 84,617,280 |
| Size | 429.9 MB | 80.7 MB |
| Events in quadrant A | 2,758,471 | 591,085 |
| Events in quadrant B | 2,448,729 | 607,294 |
| Events in quadrant C | 2,463,113 | 571,131 |
| Events in quadrant D | 8,625,748 | 439,443 |
| Mode SS | |||
|---|---|---|---|
| Quadrant | BADHDUFLAG | Total packets | Discarded packets |
| A | 0 | 102 | 0 |
| B | 0 | 102 | 0 |
| C | 0 | 102 | 0 |
| D | 0 | 102 | 0 |
| Mode M0 | |||
|---|---|---|---|
| Quadrant | BADHDUFLAG | Total packets | Discarded packets |
| A | 0 | 11328 | 3 |
| B | 0 | 10690 | 2 |
| C | 0 | 10492 | 2 |
| D | 0 | 29065 | 2 |
| Mode M9 | |||
|---|---|---|---|
| Quadrant | BADHDUFLAG | Total packets | Discarded packets |
| A | 0 | 32 | 0 |
| B | 0 | 32 | 0 |
| C | 0 | 32 | 0 |
| D | 0 | 33 | 0 |
| Quadrant | Total seconds | Saturated seconds | Saturation percentage |
|---|---|---|---|
| A | 5040 | 18 | 0.357143% |
| B | 5040 | 24 | 0.476190% |
| C | 5040 | 34 | 0.674603% |
| D | 5040 | 1117 | 22.162698% |
Noise dominated data is calculated using 1-second bins in cleaned event files. If a bin has >2000 counts, and if more than 50% of those come from <1% of pixels, then it is considered to be noise-dominated and hence unusable.
| Quadrant | # 1 sec bins | Bins with >0 counts | Bins with >2000 counts | High rate bins dominated by noise | Noise dominated (total time) | Noise dominated (detector-on time) | Marked lightcurve |
|---|---|---|---|---|---|---|---|
| A | 7012 | 5041 | 9 | 9 | 0.13% | 0.18% | 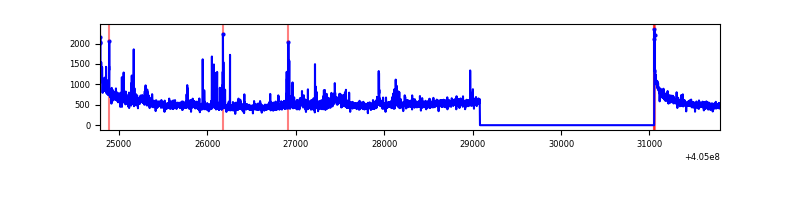 |
| B | 7012 | 5041 | 10 | 10 | 0.14% | 0.20% | 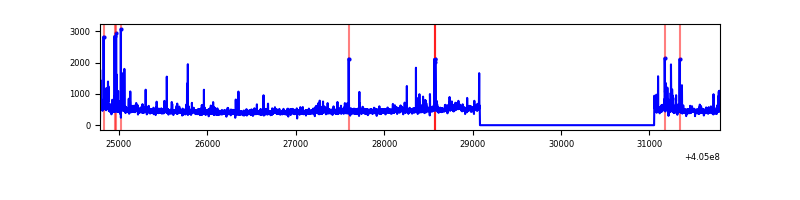 |
| C | 7012 | 5041 | 21 | 21 | 0.30% | 0.42% | 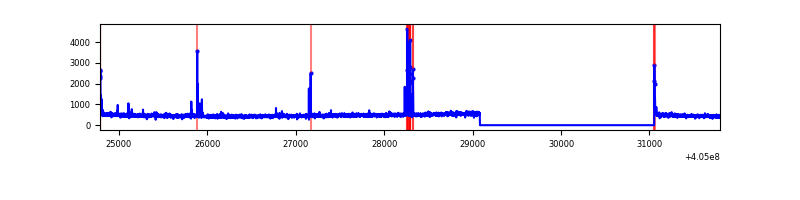 |
| D | 7012 | 5041 | 1468 | 1468 | 20.94% | 29.12% | 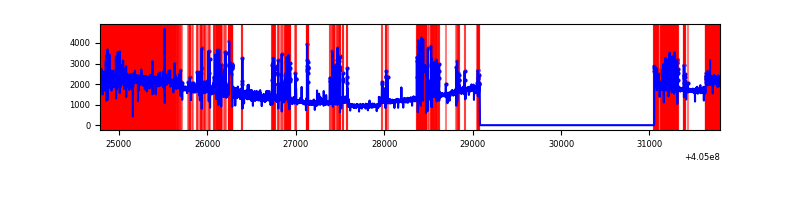 |
Top three noisy pixels from each quadrant. If the there are fewer than three noisy pixels in the level2.evt file, extra rows are filled as -1
| Pixel properties | Quadrant properties | ||||||
|---|---|---|---|---|---|---|---|
| Quadrant | DetID | PixID | Counts | Sigma | Mean | Median | Sigma |
| A | 10 | 83 | 387037 | 3447.09 | 553 | 543 | 112.1 |
| A | 12 | 189 | 99160 | 879.55 | 553 | 543 | 112.1 |
| A | 9 | 143 | 51571 | 455.11 | 553 | 543 | 112.1 |
| B | 0 | 183 | 81865 | 777.16 | 556 | 542 | 104.6 |
| B | 4 | 21 | 33968 | 319.43 | 556 | 542 | 104.6 |
| B | 5 | 172 | 24899 | 232.77 | 556 | 542 | 104.6 |
| C | 15 | 214 | 213627 | 1683.86 | 542 | 545 | 126.5 |
| C | 1 | 23 | 65930 | 516.7 | 542 | 545 | 126.5 |
| C | 0 | 10 | 36139 | 281.28 | 542 | 545 | 126.5 |
| D | 10 | 203 | 5410373 | 43393.42 | 501 | 485 | 124.7 |
| D | 12 | 227 | 740963 | 5939.47 | 501 | 485 | 124.7 |
| D | 2 | 16 | 171793 | 1374.08 | 501 | 485 | 124.7 |
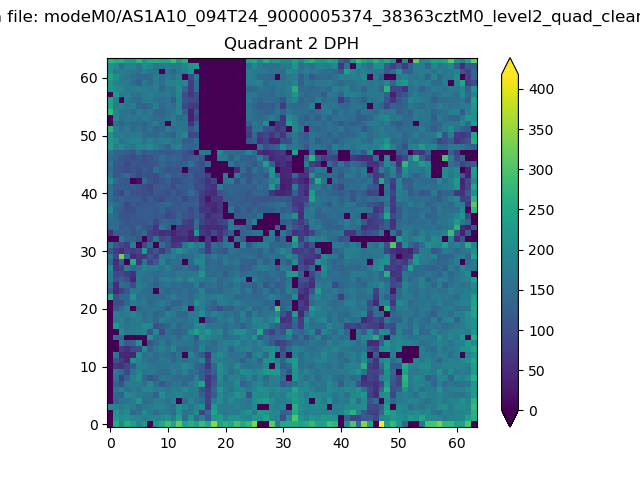
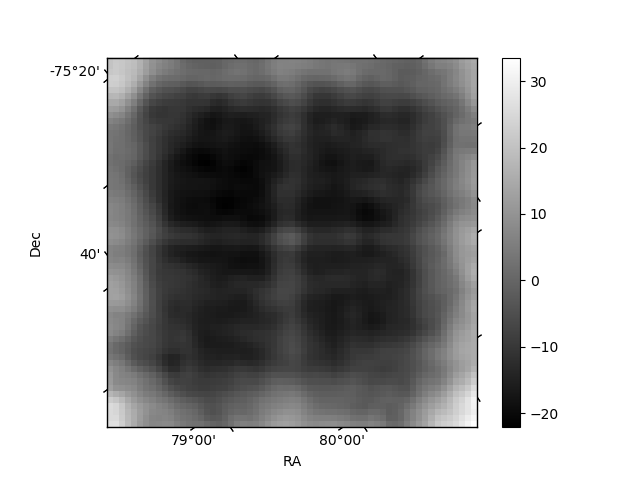
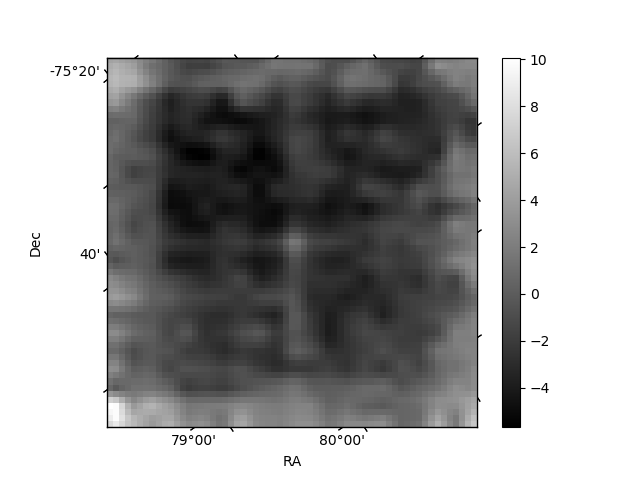
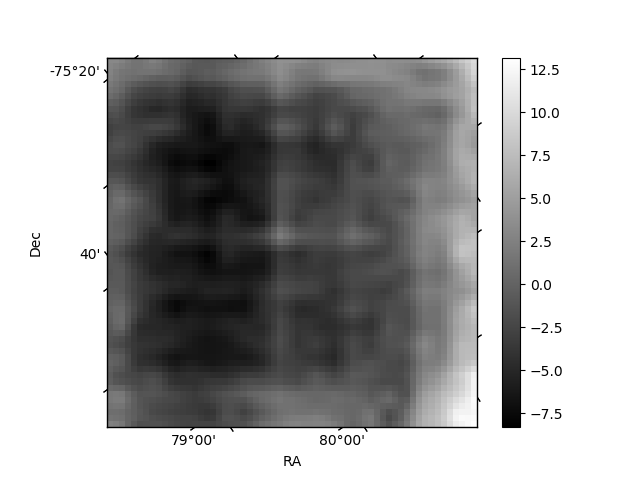
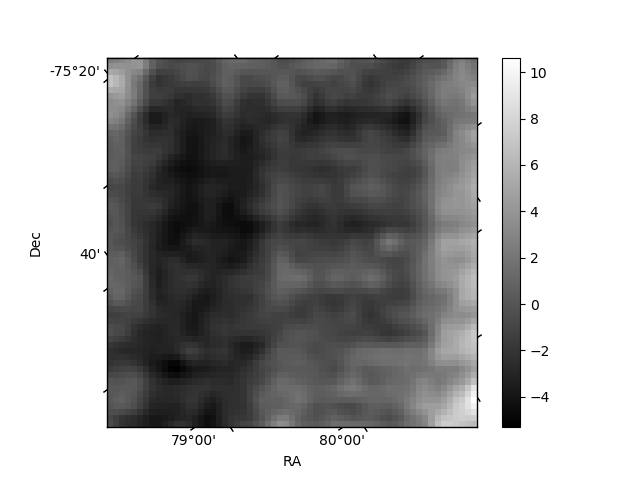
Histogram calculated using DETX and DETY for each event in the final _common_clean file
| Quadrant A | 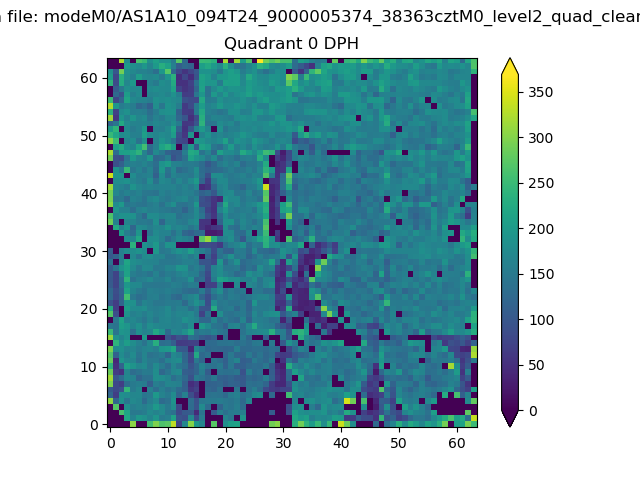 |
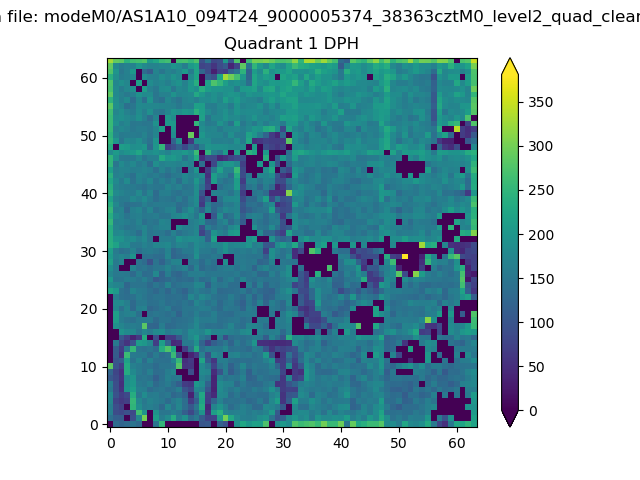 |
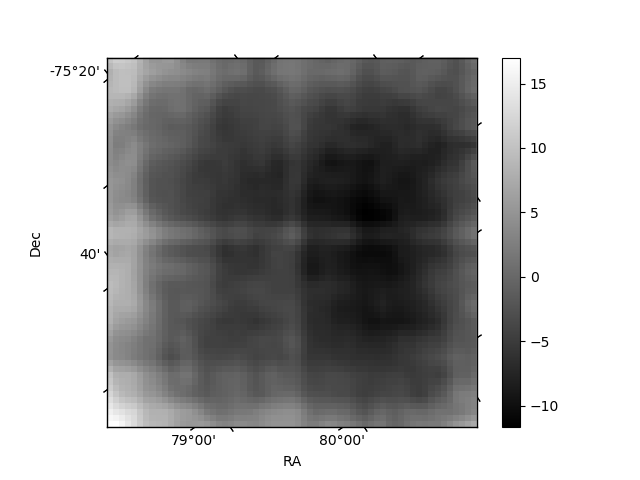
Quadrant B |
|---|---|---|---|
| Quadrant D | 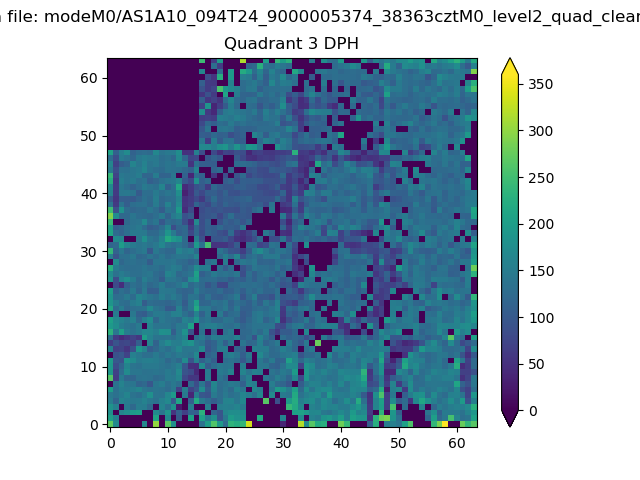 |
 |
Quadrant C |
| Plot type | Count rate plots | Images |
|---|---|---|
| Comparison with Poisson distribution Blue bars denote a histogram of data divided into 1 sec bins. Red curve is a Poisson curve with rate = median count rate of data. |
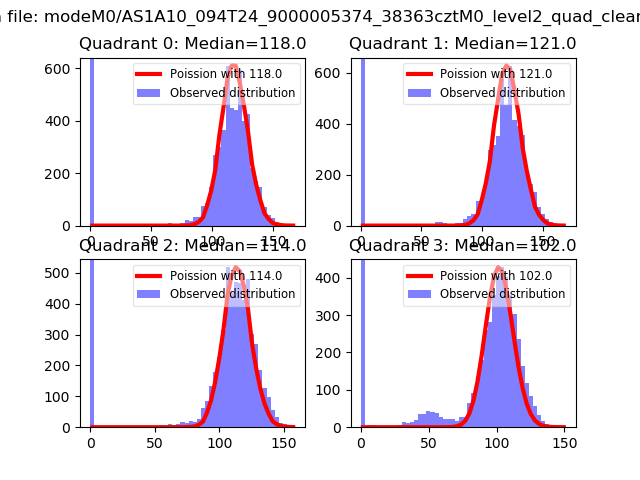 |
 |
| Quadrant-wise count rates Data is divided into 100 sec bins |
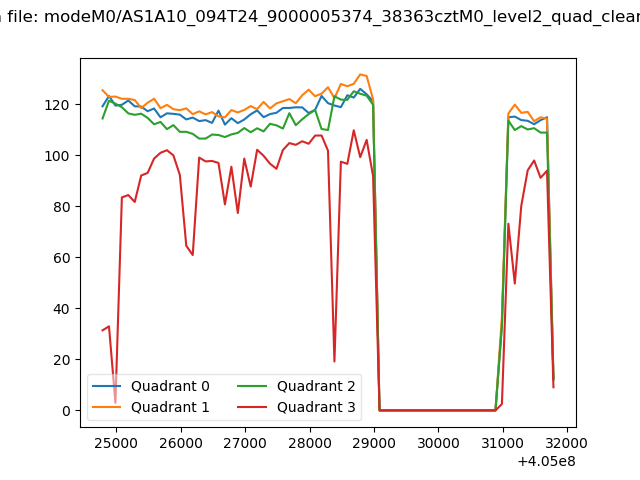 |
|
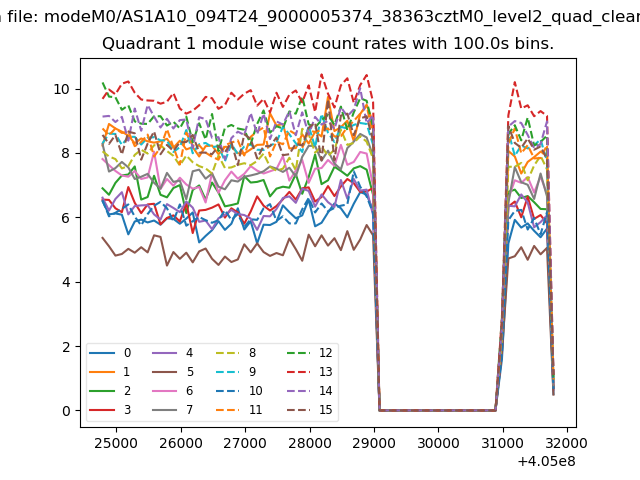
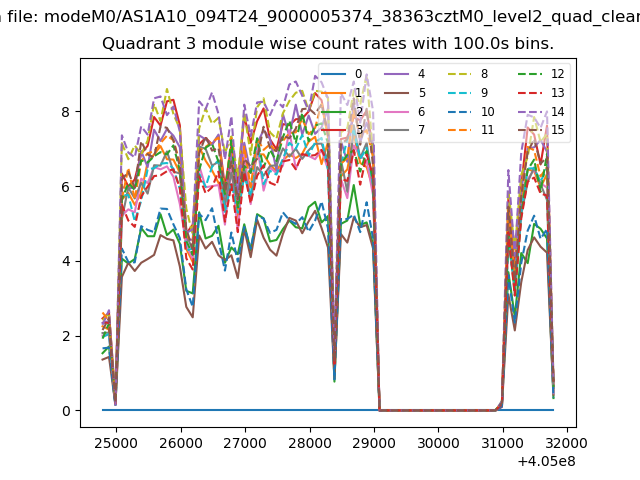
| Module-wise count rates for Quadrant A Data is divided into 100 sec bins |
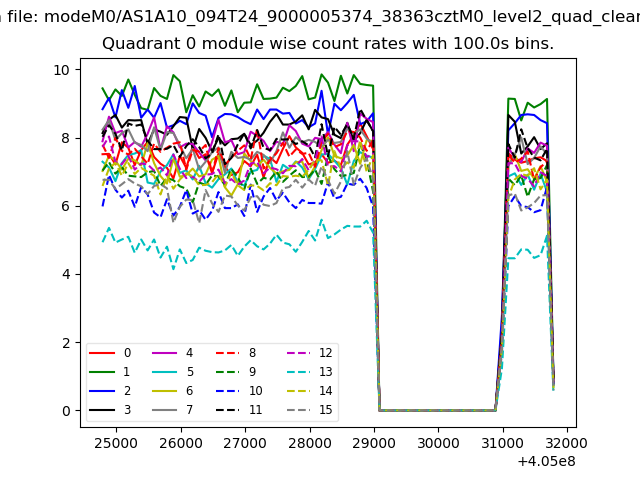 |
 |
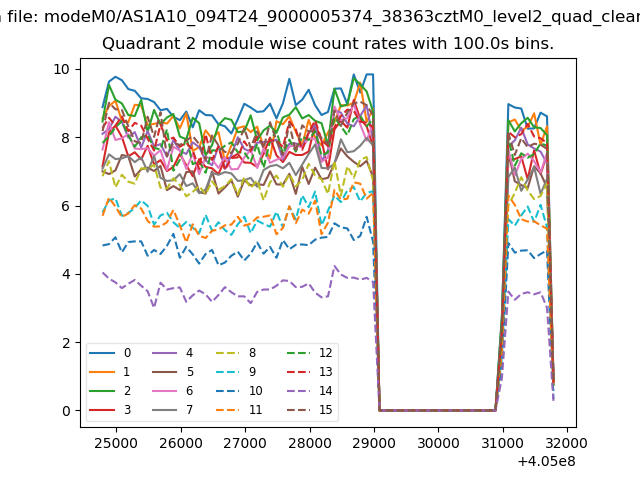
| Module-wise count rates for Quadrant B Data is divided into 100 sec bins |
 |
 |
| Module-wise count rates for Quadrant C Data is divided into 100 sec bins |
 |
 |
| Module-wise count rates for Quadrant D Data is divided into 100 sec bins |
 |
 |
| Parameter | Plot |
|---|---|
| CZT HV Monitor | 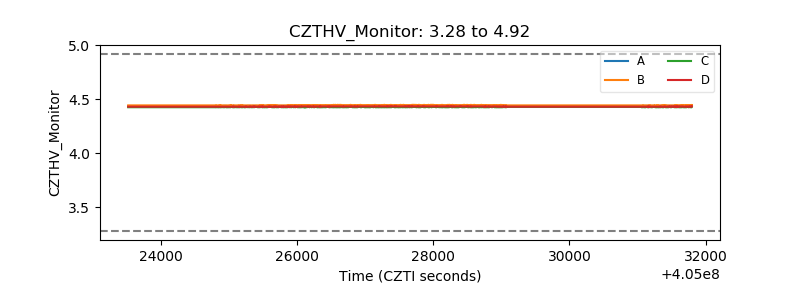 |
| D_VDD | 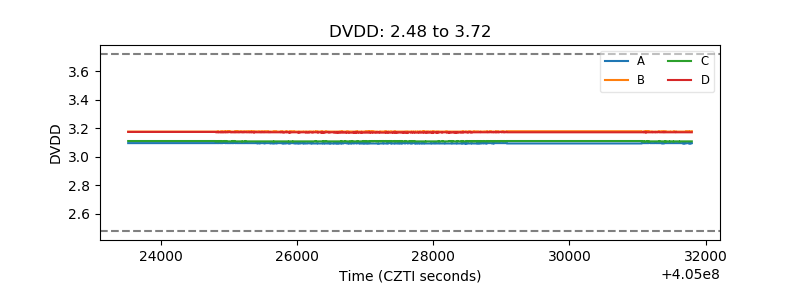 |
| Temperature 1 | 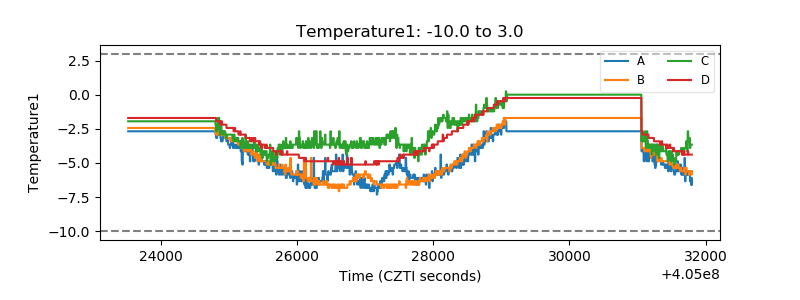 |
| Veto HV Monitor | 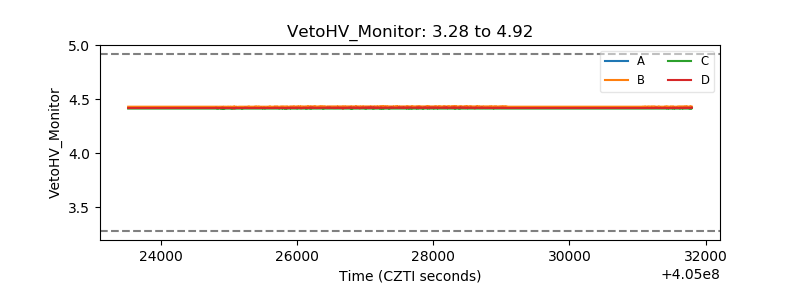 |
| Veto LLD | 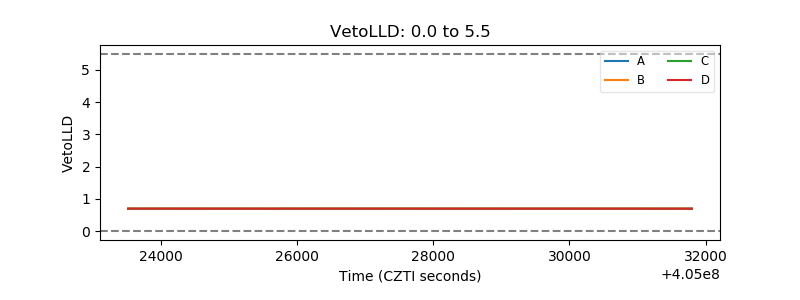 |
| Alpha Counter | 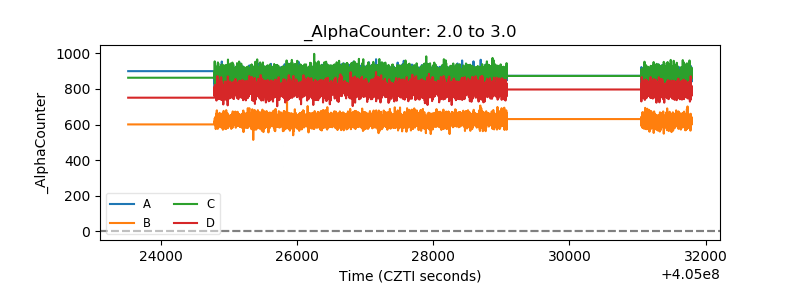 |
| _CPM_Rate | 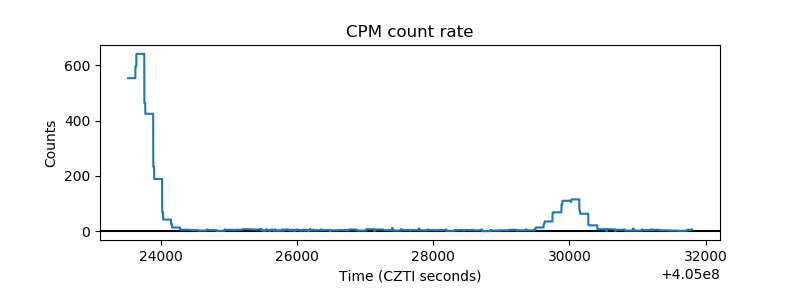 |
| CZT Counter | 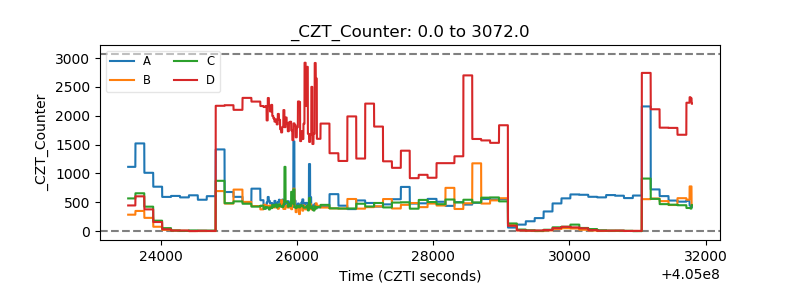 |
| +2.5 Volts monitor | 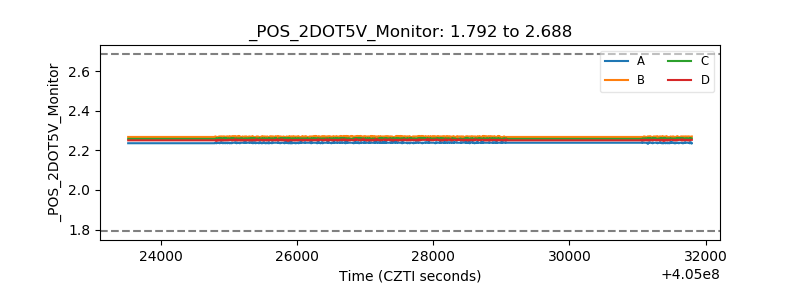 |
| +5 Volts monitor | 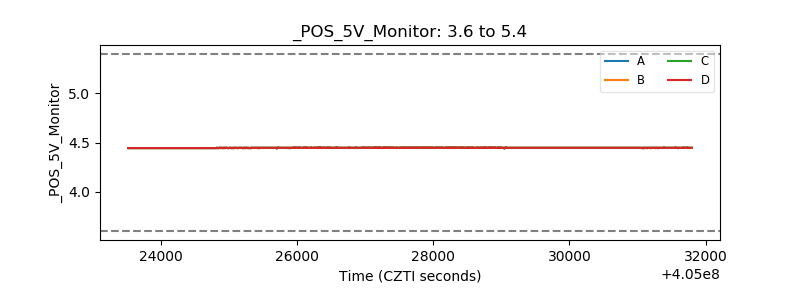 |
| _ROLL_ROT | 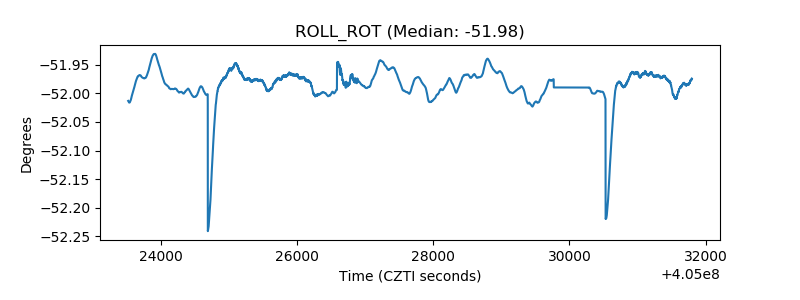 |
| _Roll_DEC | 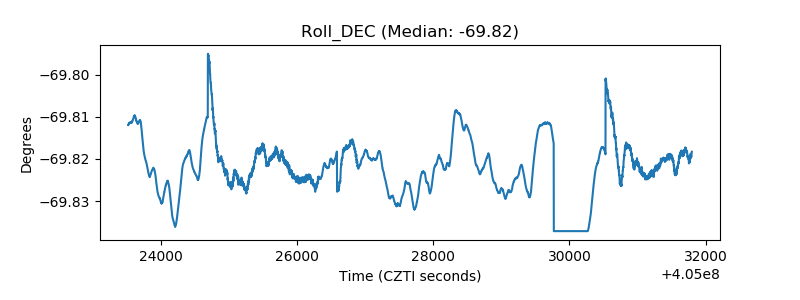 |
| _Roll_RA | 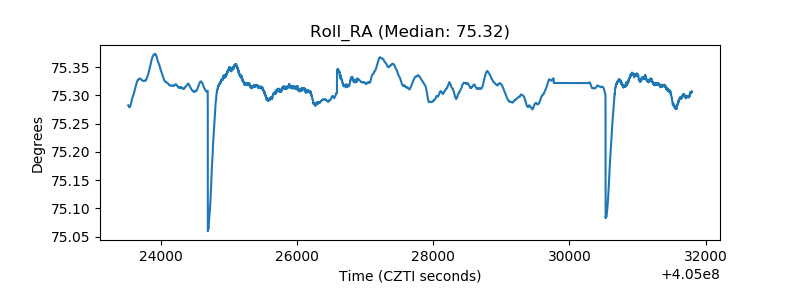 |
| Veto Counter | 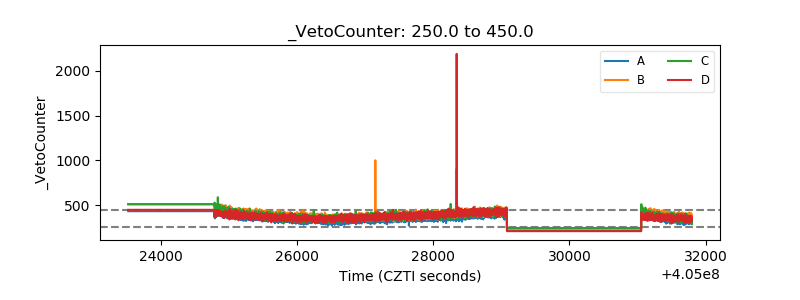 |