| Param | Original file | Final file |
|---|---|---|
| Filename | modeM0/AS1A10_094T24_9000005374_38364cztM0_level2.fits | modeM0/AS1A10_094T24_9000005374_38364cztM0_level2_quad_clean.evt |
| Size (bytes) | 455,791,680 | 87,946,560 |
| Size | 434.7 MB | 83.9 MB |
| Events in quadrant A | 2,816,842 | 605,194 |
| Events in quadrant B | 2,811,953 | 616,433 |
| Events in quadrant C | 2,717,460 | 583,832 |
| Events in quadrant D | 8,112,256 | 484,283 |
| Mode SS | |||
|---|---|---|---|
| Quadrant | BADHDUFLAG | Total packets | Discarded packets |
| A | 0 | 108 | 0 |
| B | 0 | 108 | 0 |
| C | 0 | 108 | 0 |
| D | 0 | 108 | 0 |
| Mode M0 | |||
|---|---|---|---|
| Quadrant | BADHDUFLAG | Total packets | Discarded packets |
| A | 0 | 11750 | 3 |
| B | 0 | 12078 | 2 |
| C | 0 | 11499 | 2 |
| D | 0 | 28007 | 2 |
| Mode M9 | |||
|---|---|---|---|
| Quadrant | BADHDUFLAG | Total packets | Discarded packets |
| A | 0 | 24 | 0 |
| B | 0 | 24 | 0 |
| C | 0 | 24 | 0 |
| D | 0 | 25 | 0 |
| Quadrant | Total seconds | Saturated seconds | Saturation percentage |
|---|---|---|---|
| A | 5331 | 32 | 0.600263% |
| B | 5331 | 70 | 1.313074% |
| C | 5331 | 66 | 1.238042% |
| D | 5331 | 732 | 13.731007% |
Noise dominated data is calculated using 1-second bins in cleaned event files. If a bin has >2000 counts, and if more than 50% of those come from <1% of pixels, then it is considered to be noise-dominated and hence unusable.
| Quadrant | # 1 sec bins | Bins with >0 counts | Bins with >2000 counts | High rate bins dominated by noise | Noise dominated (total time) | Noise dominated (detector-on time) | Marked lightcurve |
|---|---|---|---|---|---|---|---|
| A | 6973 | 5332 | 14 | 14 | 0.20% | 0.26% | 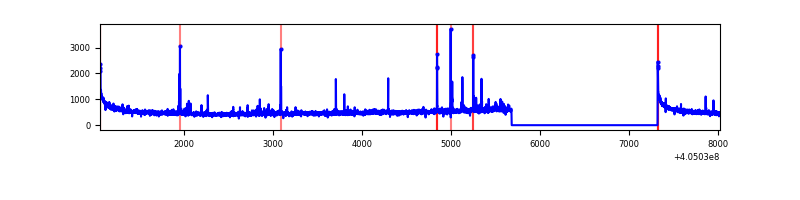 |
| B | 6973 | 5332 | 36 | 36 | 0.52% | 0.68% | 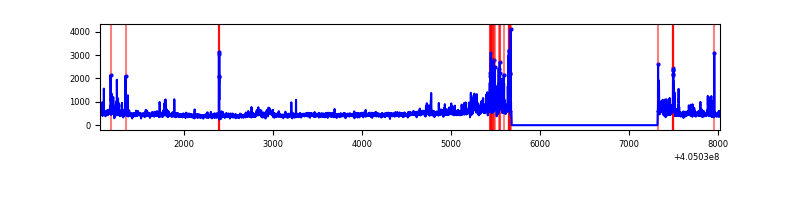 |
| C | 6973 | 5332 | 48 | 48 | 0.69% | 0.90% | 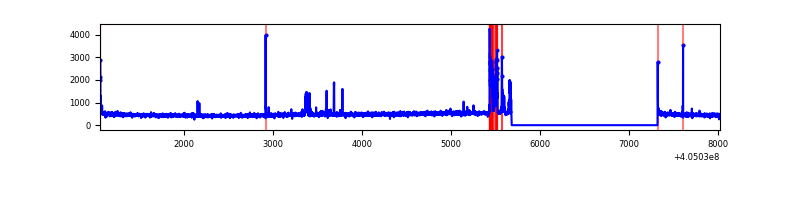 |
| D | 6973 | 5332 | 794 | 794 | 11.39% | 14.89% | 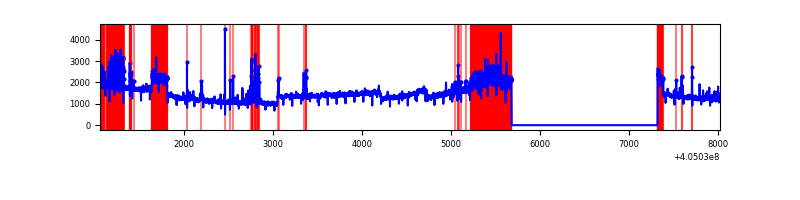 |
Top three noisy pixels from each quadrant. If the there are fewer than three noisy pixels in the level2.evt file, extra rows are filled as -1
| Pixel properties | Quadrant properties | ||||||
|---|---|---|---|---|---|---|---|
| Quadrant | DetID | PixID | Counts | Sigma | Mean | Median | Sigma |
| A | 10 | 83 | 404014 | 3365.48 | 583 | 569 | 119.9 |
| A | 9 | 143 | 80157 | 663.91 | 583 | 569 | 119.9 |
| A | 12 | 189 | 42972 | 353.72 | 583 | 569 | 119.9 |
| B | 0 | 183 | 163122 | 1463.14 | 584 | 567 | 111.1 |
| B | 15 | 35 | 96531 | 863.76 | 584 | 567 | 111.1 |
| B | 0 | 186 | 50079 | 445.65 | 584 | 567 | 111.1 |
| C | 15 | 214 | 224779 | 1687.94 | 571 | 573 | 132.8 |
| C | 0 | 207 | 181926 | 1365.32 | 571 | 573 | 132.8 |
| C | 14 | 254 | 37135 | 275.26 | 571 | 573 | 132.8 |
| D | 10 | 203 | 5539126 | 41210.93 | 548 | 533 | 134.4 |
| D | 12 | 227 | 142007 | 1052.66 | 548 | 533 | 134.4 |
| D | 13 | 138 | 61015 | 450.03 | 548 | 533 | 134.4 |
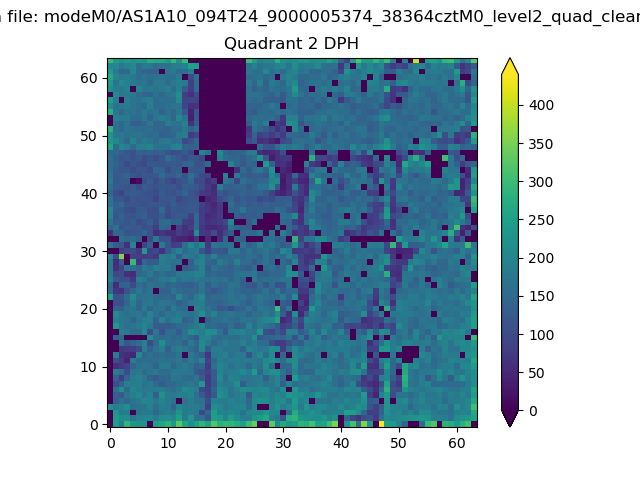
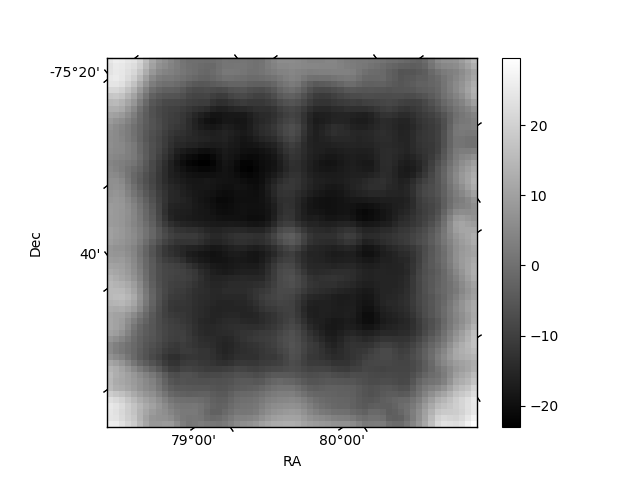
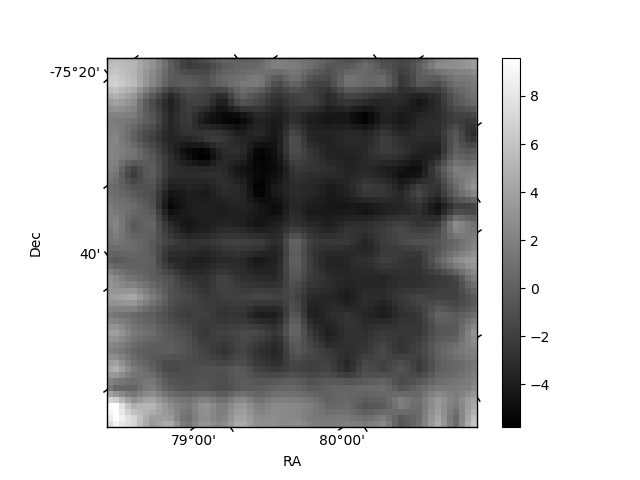
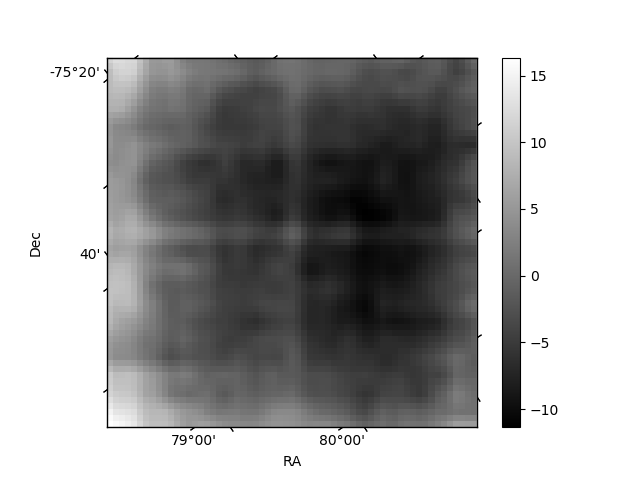
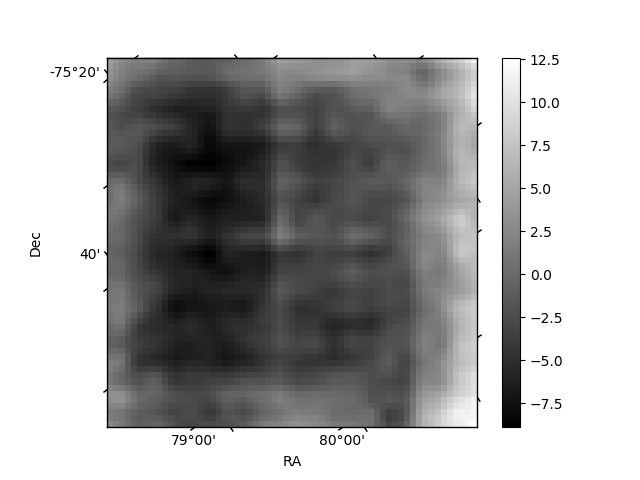
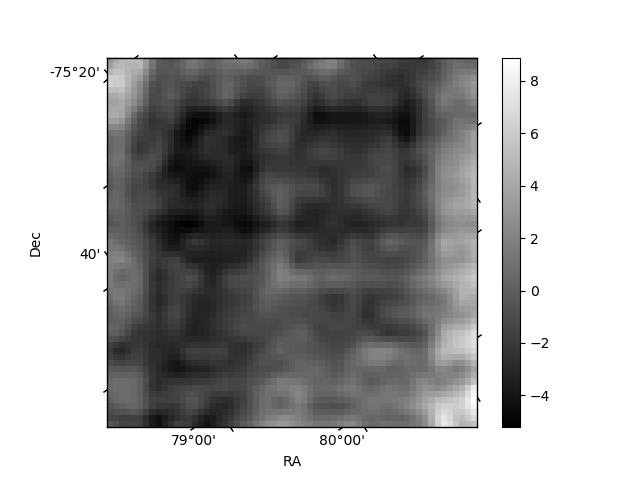
Histogram calculated using DETX and DETY for each event in the final _common_clean file
| Quadrant A | 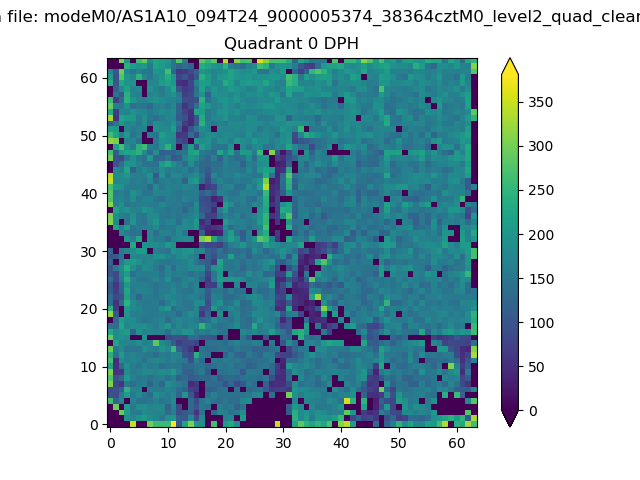 |
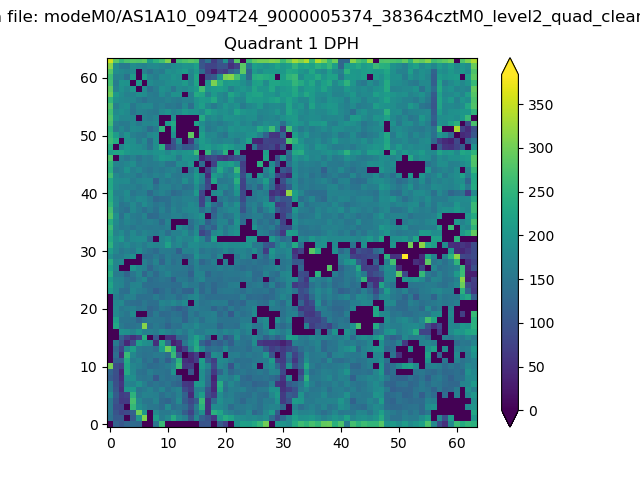 |
Quadrant B |
|---|---|---|---|
| Quadrant D | 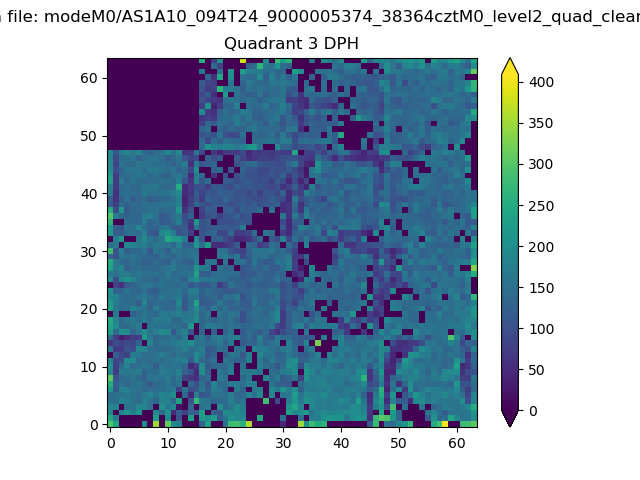 |
 |
Quadrant C |
| Plot type | Count rate plots | Images |
|---|---|---|
| Comparison with Poisson distribution Blue bars denote a histogram of data divided into 1 sec bins. Red curve is a Poisson curve with rate = median count rate of data. |
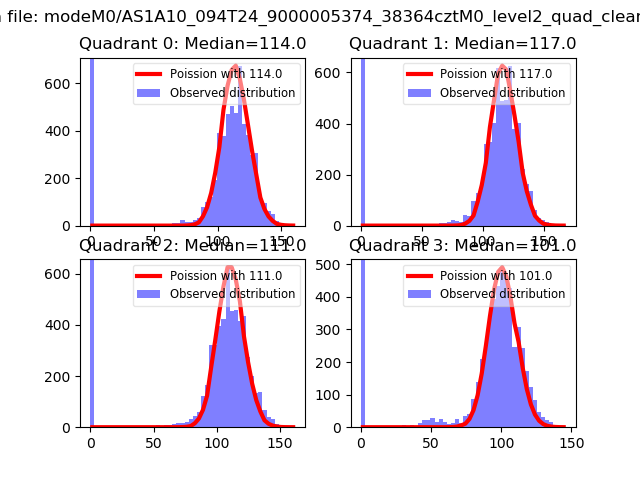 |
 |
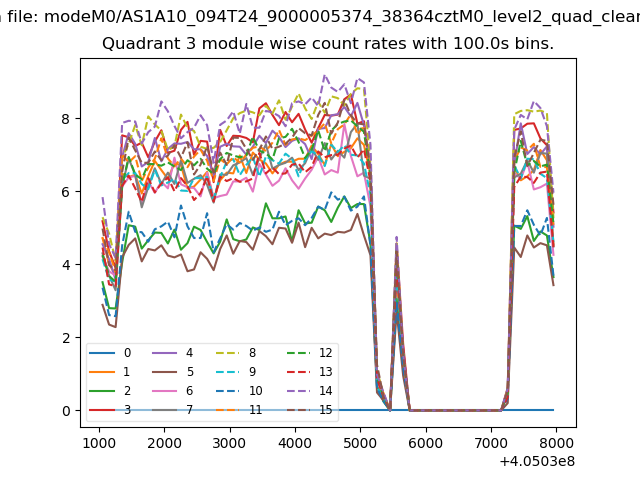
| Quadrant-wise count rates Data is divided into 100 sec bins |
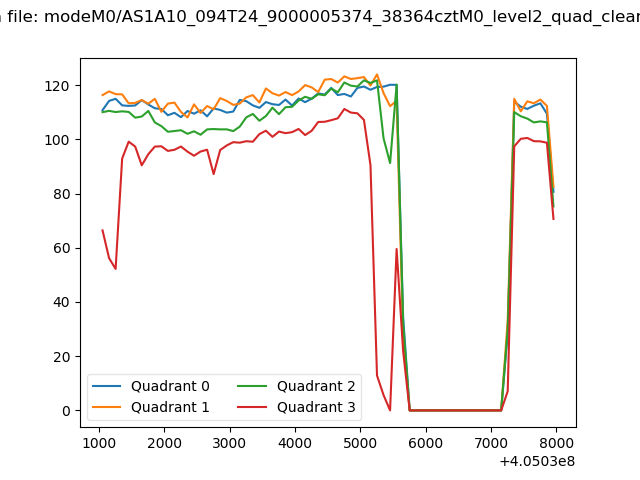 |
|
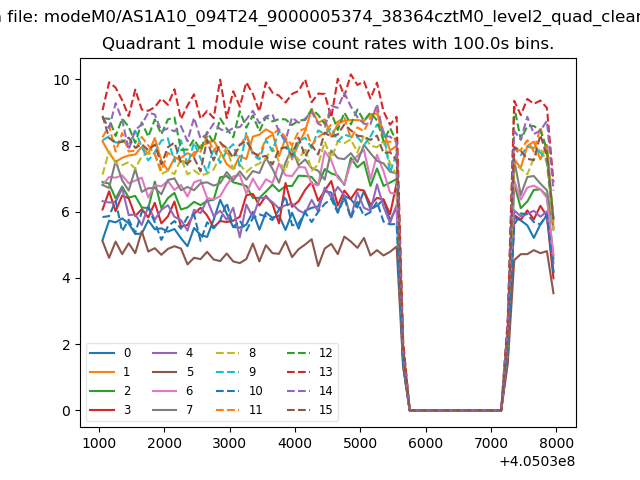
| Module-wise count rates for Quadrant A Data is divided into 100 sec bins |
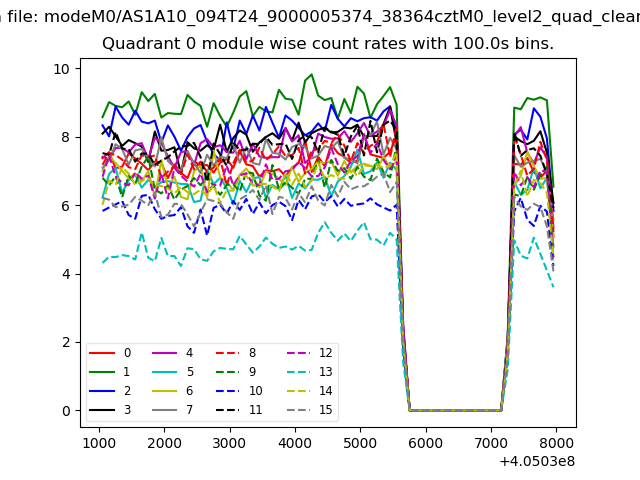 |
 |
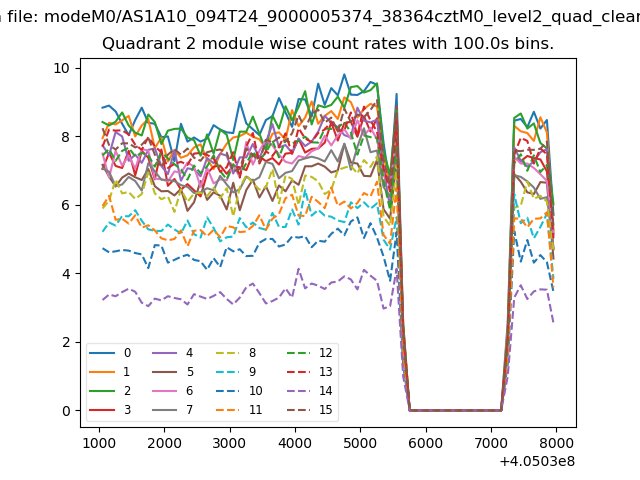
| Module-wise count rates for Quadrant B Data is divided into 100 sec bins |
 |
 |
| Module-wise count rates for Quadrant C Data is divided into 100 sec bins |
 |
 |
| Module-wise count rates for Quadrant D Data is divided into 100 sec bins |
 |
 |
| Parameter | Plot |
|---|---|
| CZT HV Monitor | 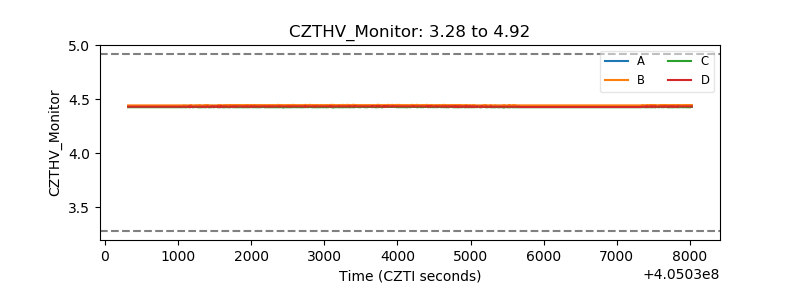 |
| D_VDD | 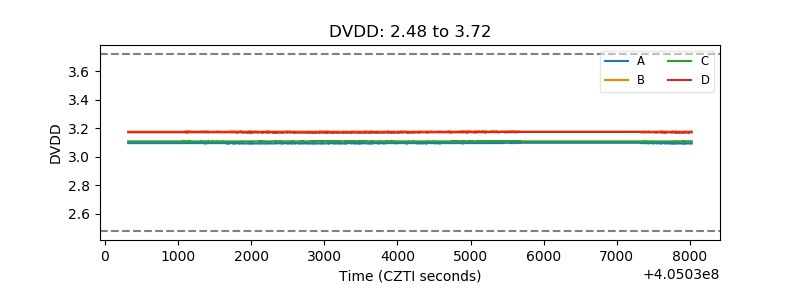 |
| Temperature 1 | 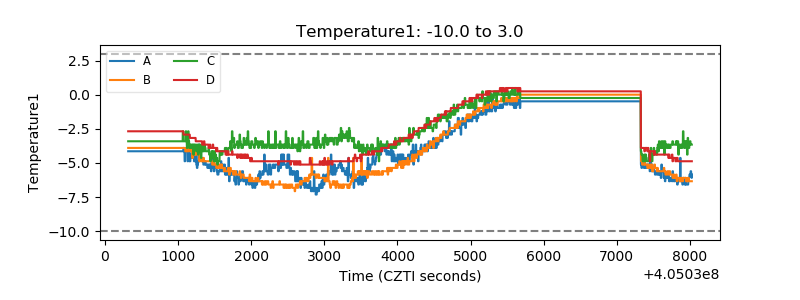 |
| Veto HV Monitor | 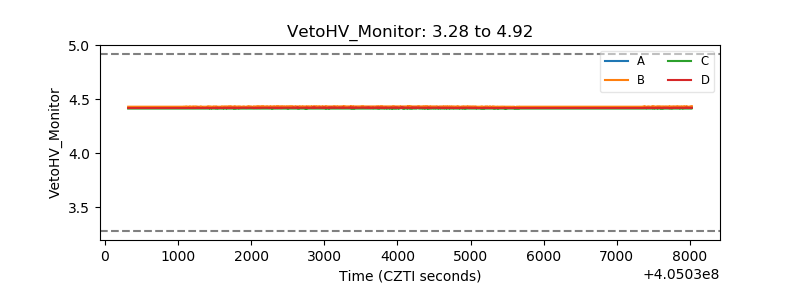 |
| Veto LLD | 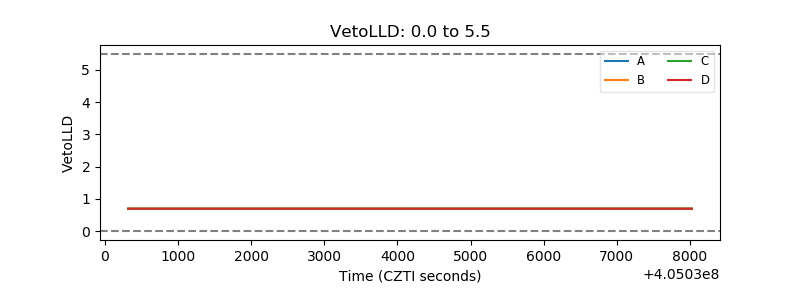 |
| Alpha Counter | 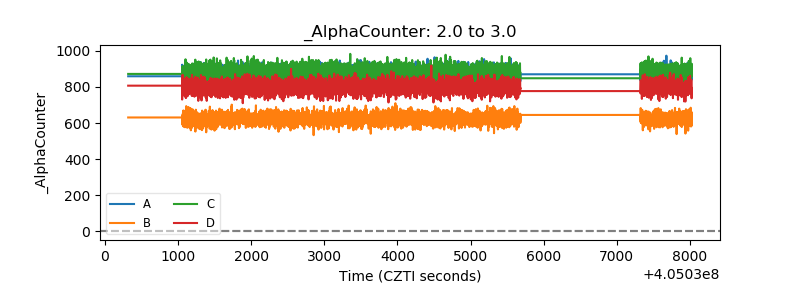 |
| _CPM_Rate | 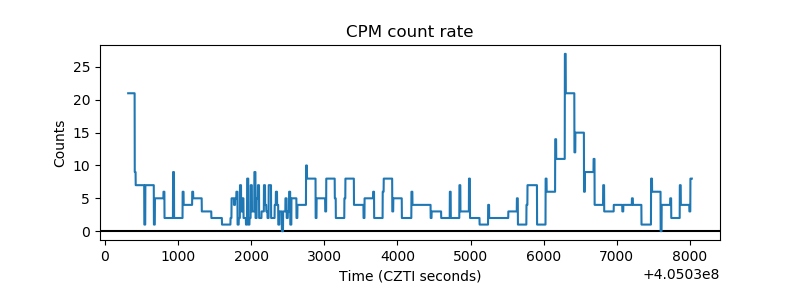 |
| CZT Counter | 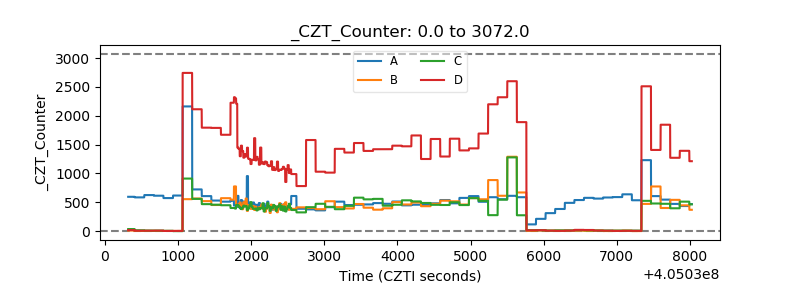 |
| +2.5 Volts monitor | 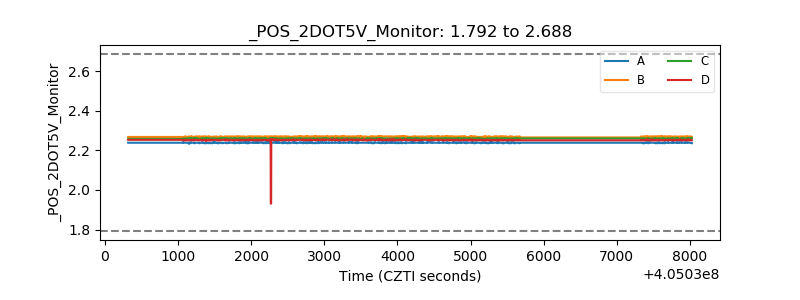 |
| +5 Volts monitor | 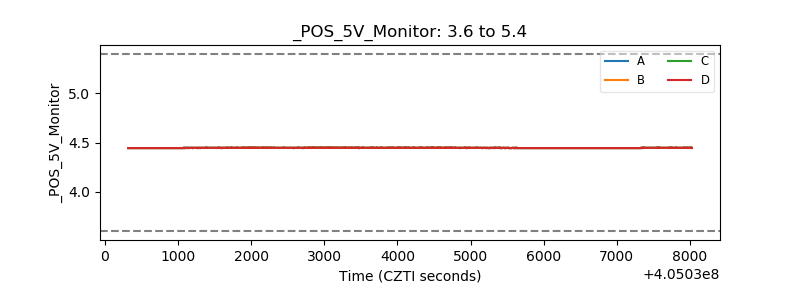 |
| _ROLL_ROT |  |
| _Roll_DEC | 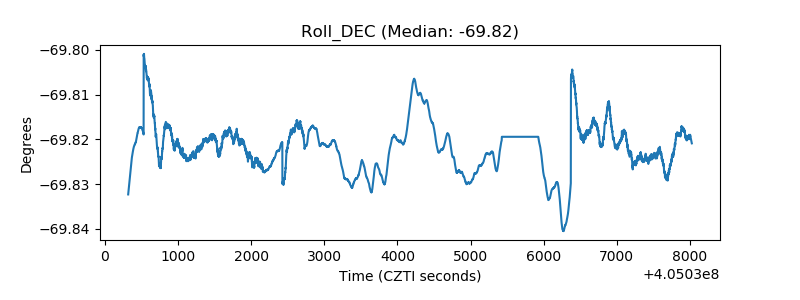 |
| _Roll_RA | 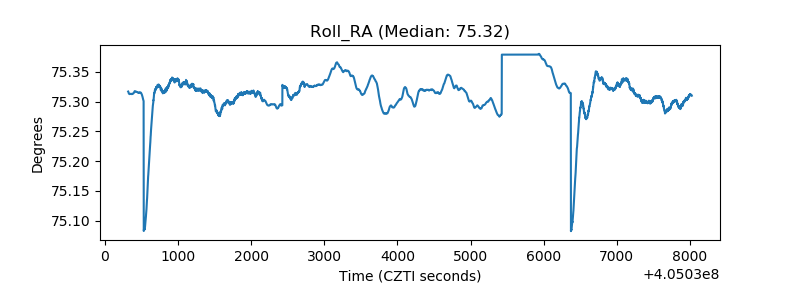 |
| Veto Counter | 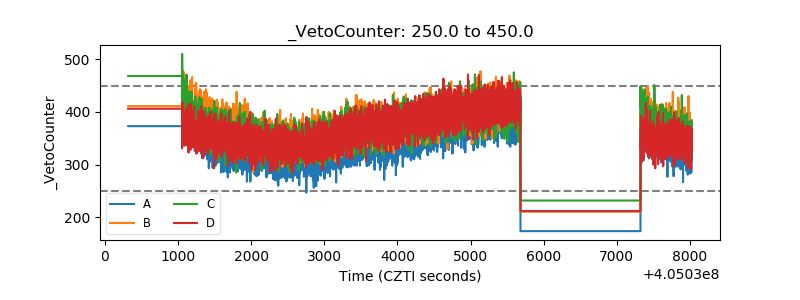 |