| Param | Original file | Final file |
|---|---|---|
| Filename | modeM0/AS1A10_094T24_9000005374_38365cztM0_level2.fits | modeM0/AS1A10_094T24_9000005374_38365cztM0_level2_quad_clean.evt |
| Size (bytes) | 506,692,800 | 94,789,440 |
| Size | 483.2 MB | 90.4 MB |
| Events in quadrant A | 3,180,649 | 657,241 |
| Events in quadrant B | 3,466,852 | 668,117 |
| Events in quadrant C | 3,010,530 | 637,888 |
| Events in quadrant D | 8,640,825 | 494,811 |
| Mode SS | |||
|---|---|---|---|
| Quadrant | BADHDUFLAG | Total packets | Discarded packets |
| A | 0 | 120 | 0 |
| B | 0 | 120 | 0 |
| C | 0 | 120 | 0 |
| D | 0 | 120 | 0 |
| Mode M0 | |||
|---|---|---|---|
| Quadrant | BADHDUFLAG | Total packets | Discarded packets |
| A | 0 | 13212 | 3 |
| B | 0 | 14329 | 2 |
| C | 0 | 12703 | 2 |
| D | 0 | 29807 | 2 |
| Mode M9 | |||
|---|---|---|---|
| Quadrant | BADHDUFLAG | Total packets | Discarded packets |
| A | 0 | 26 | 0 |
| B | 0 | 26 | 0 |
| C | 0 | 26 | 0 |
| D | 0 | 27 | 0 |
| Quadrant | Total seconds | Saturated seconds | Saturation percentage |
|---|---|---|---|
| A | 5897 | 27 | 0.457860% |
| B | 5897 | 130 | 2.204511% |
| C | 5897 | 83 | 1.407495% |
| D | 5897 | 1099 | 18.636595% |
Noise dominated data is calculated using 1-second bins in cleaned event files. If a bin has >2000 counts, and if more than 50% of those come from <1% of pixels, then it is considered to be noise-dominated and hence unusable.
| Quadrant | # 1 sec bins | Bins with >0 counts | Bins with >2000 counts | High rate bins dominated by noise | Noise dominated (total time) | Noise dominated (detector-on time) | Marked lightcurve |
|---|---|---|---|---|---|---|---|
| A | 7271 | 5898 | 13 | 13 | 0.18% | 0.22% | 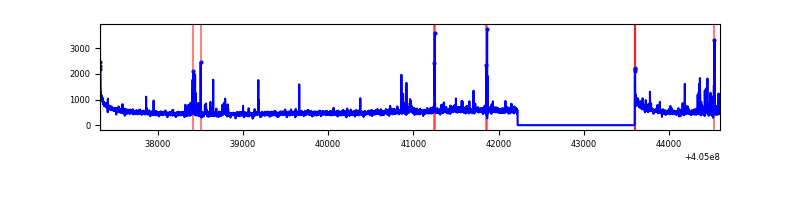 |
| B | 7271 | 5898 | 61 | 61 | 0.84% | 1.03% | 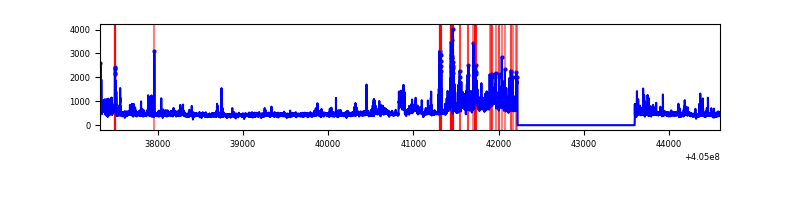 |
| C | 7271 | 5898 | 67 | 67 | 0.92% | 1.14% | 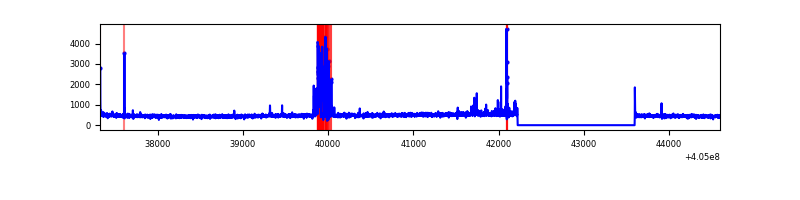 |
| D | 7271 | 5898 | 1005 | 1005 | 13.82% | 17.04% | 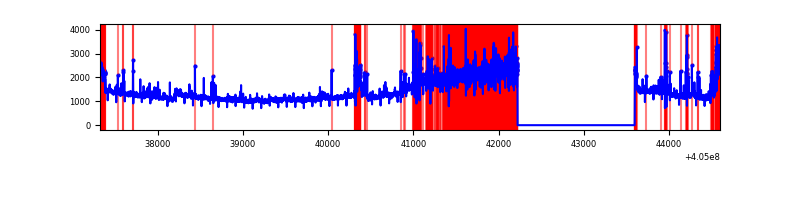 |
Top three noisy pixels from each quadrant. If the there are fewer than three noisy pixels in the level2.evt file, extra rows are filled as -1
| Pixel properties | Quadrant properties | ||||||
|---|---|---|---|---|---|---|---|
| Quadrant | DetID | PixID | Counts | Sigma | Mean | Median | Sigma |
| A | 10 | 83 | 427663 | 3280.17 | 646 | 632 | 130.2 |
| A | 9 | 143 | 77298 | 588.9 | 646 | 632 | 130.2 |
| A | 13 | 248 | 53810 | 408.48 | 646 | 632 | 130.2 |
| B | 0 | 183 | 274967 | 2239.97 | 645 | 628 | 122.5 |
| B | 15 | 35 | 142308 | 1156.81 | 645 | 628 | 122.5 |
| B | 0 | 186 | 96323 | 781.35 | 645 | 628 | 122.5 |
| C | 15 | 214 | 248417 | 1679.8 | 632 | 635 | 147.5 |
| C | 1 | 23 | 119197 | 803.77 | 632 | 635 | 147.5 |
| C | 10 | 223 | 95554 | 643.49 | 632 | 635 | 147.5 |
| D | 10 | 203 | 5418565 | 36664.28 | 601 | 584 | 147.8 |
| D | 12 | 235 | 179759 | 1212.5 | 601 | 584 | 147.8 |
| D | 12 | 227 | 175819 | 1185.84 | 601 | 584 | 147.8 |
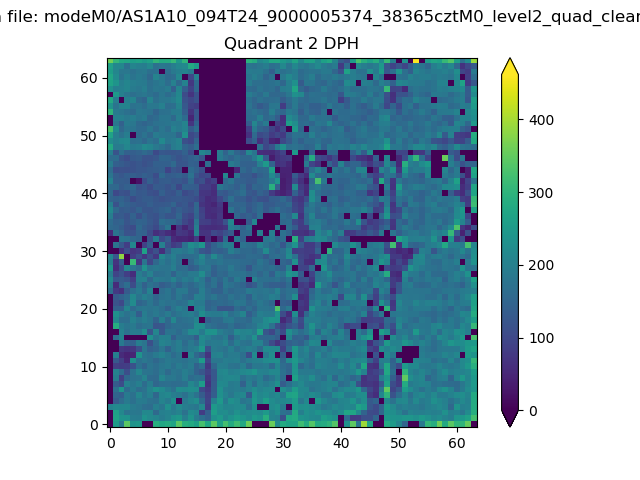
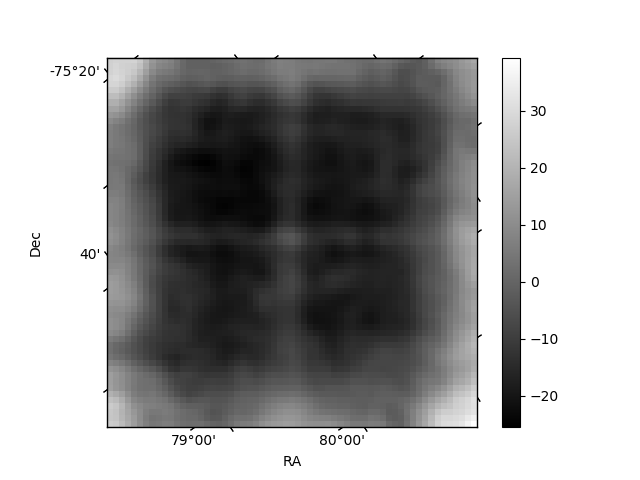
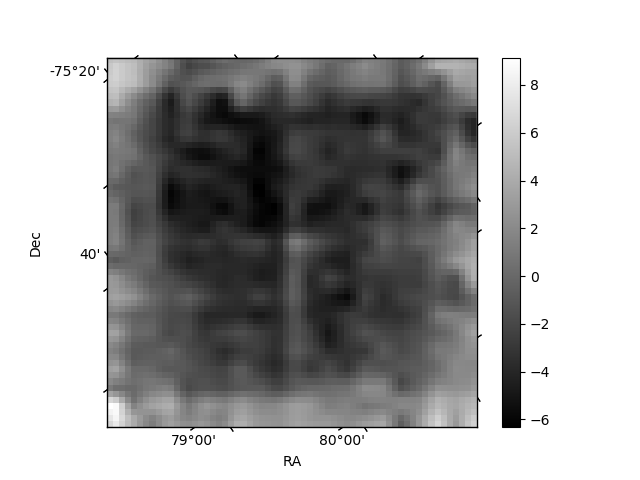
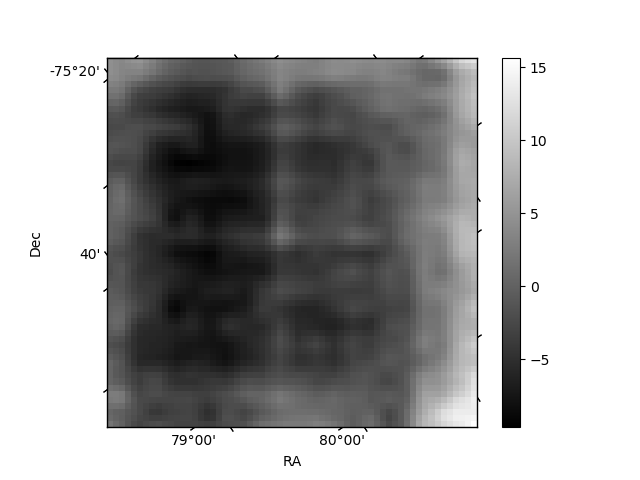
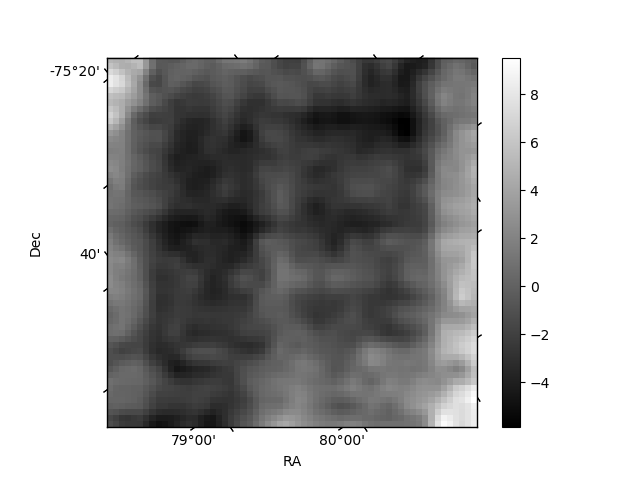
Histogram calculated using DETX and DETY for each event in the final _common_clean file
| Quadrant A | 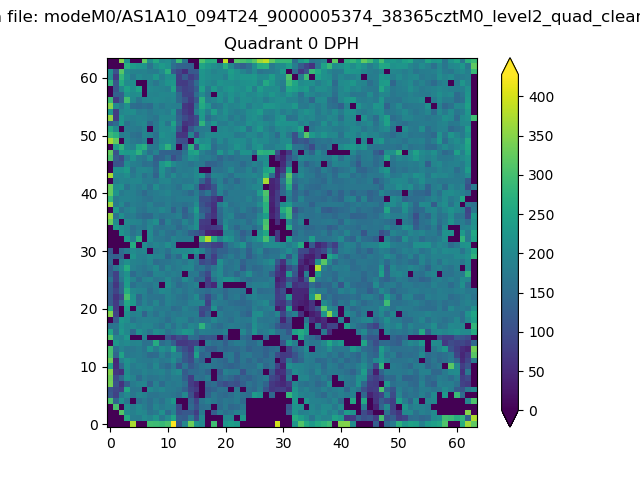 |
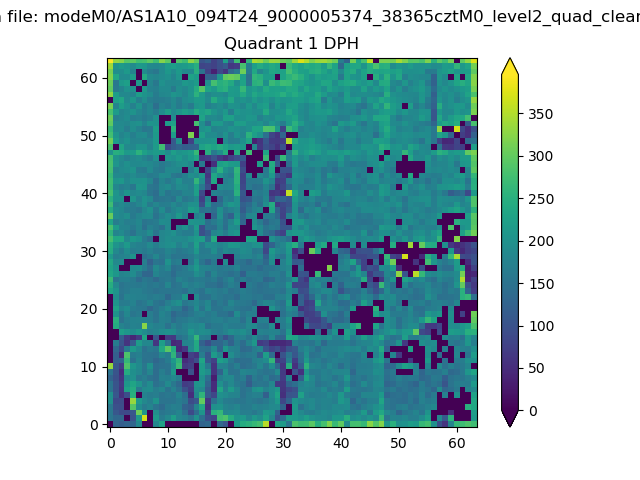 |
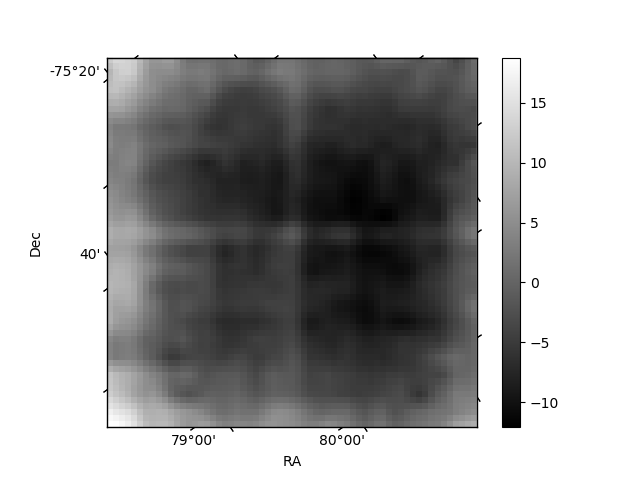
Quadrant B |
|---|---|---|---|
| Quadrant D | 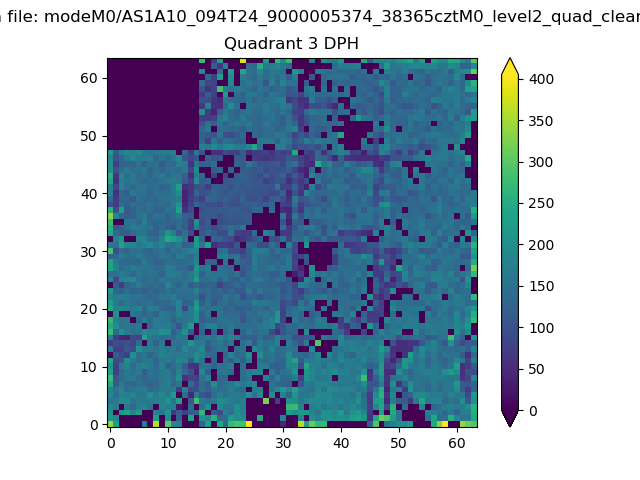 |
 |
Quadrant C |
| Plot type | Count rate plots | Images |
|---|---|---|
| Comparison with Poisson distribution Blue bars denote a histogram of data divided into 1 sec bins. Red curve is a Poisson curve with rate = median count rate of data. |
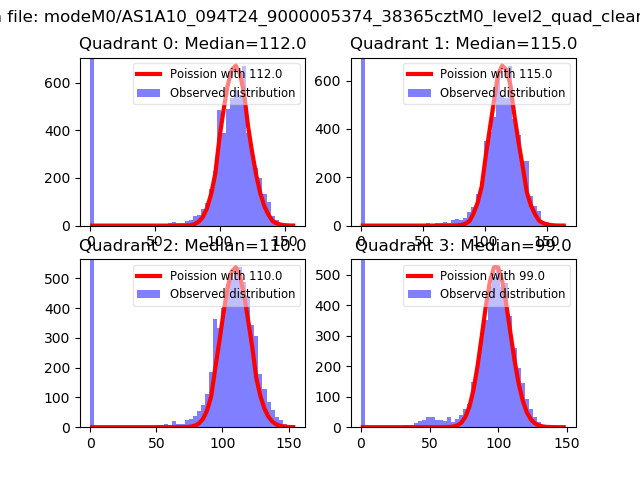 |
 |
| Quadrant-wise count rates Data is divided into 100 sec bins |
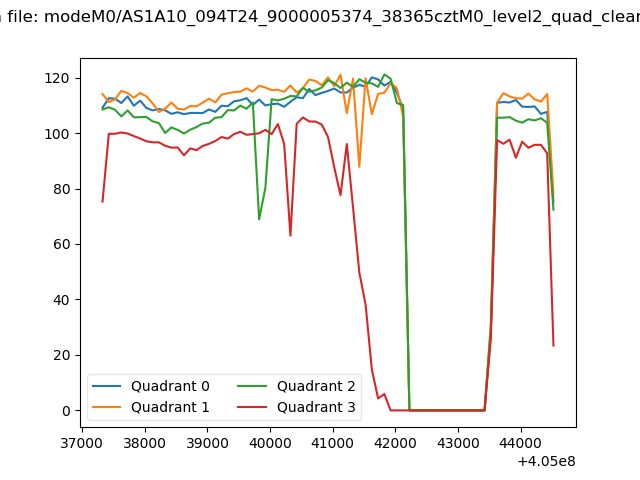 |
|
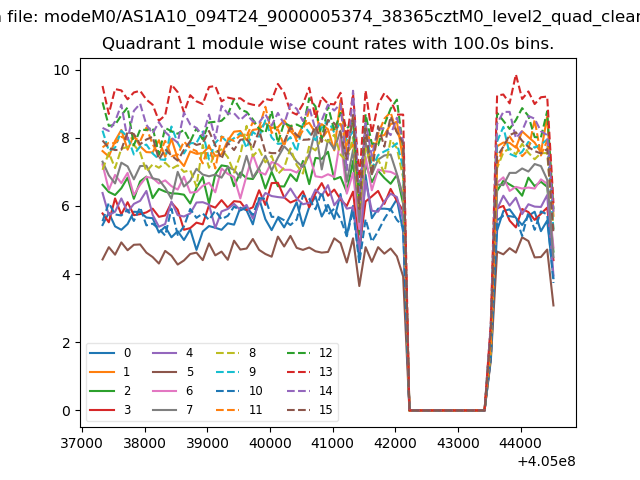
| Module-wise count rates for Quadrant A Data is divided into 100 sec bins |
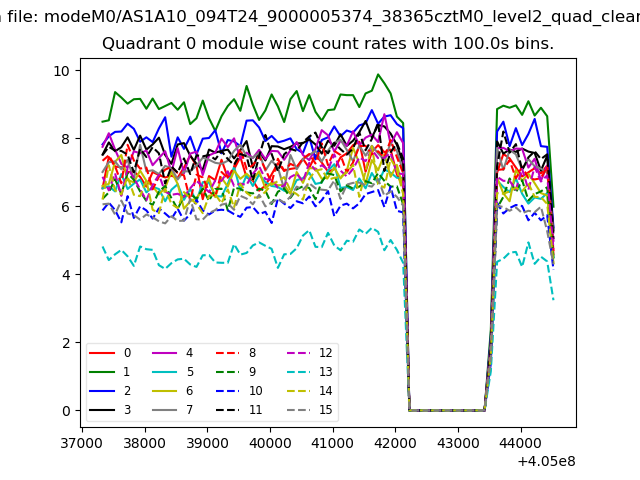 |
 |
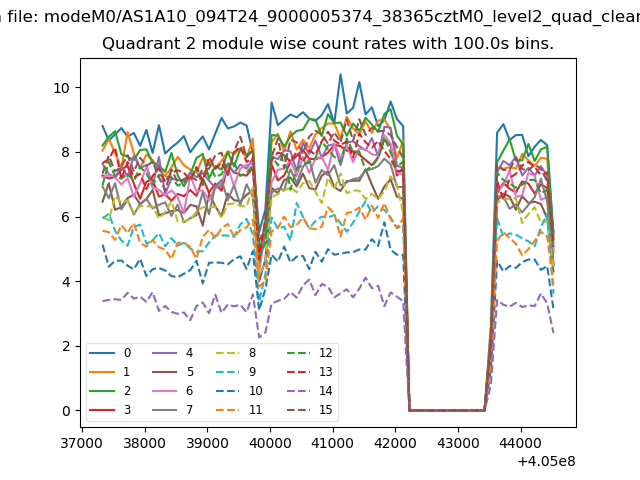
| Module-wise count rates for Quadrant B Data is divided into 100 sec bins |
 |
 |
| Module-wise count rates for Quadrant C Data is divided into 100 sec bins |
 |
 |
| Module-wise count rates for Quadrant D Data is divided into 100 sec bins |
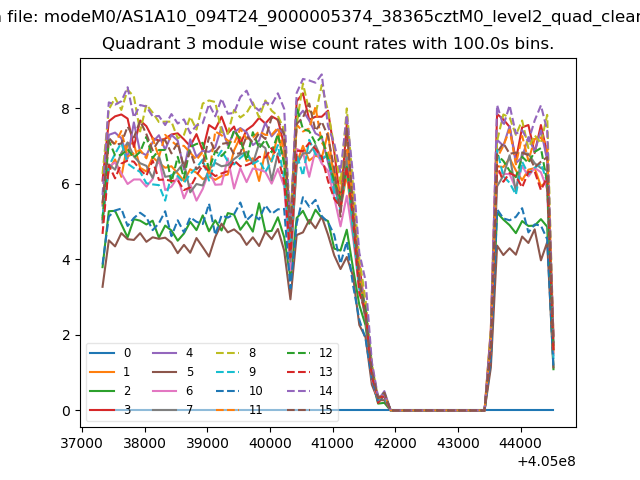 |
 |
| Parameter | Plot |
|---|---|
| CZT HV Monitor | 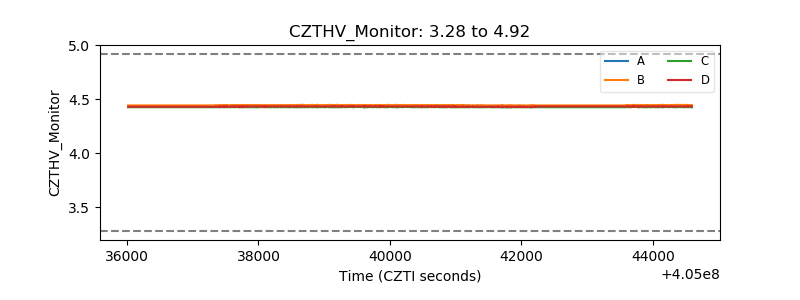 |
| D_VDD | 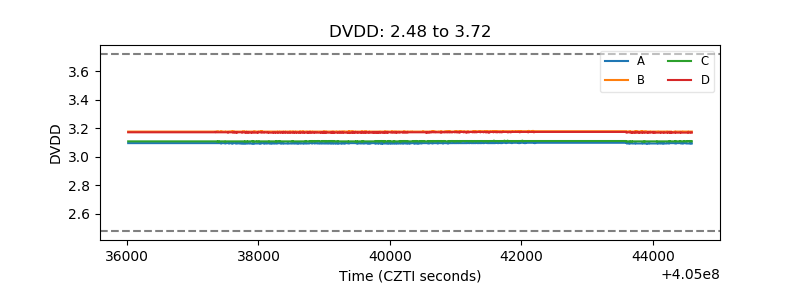 |
| Temperature 1 | 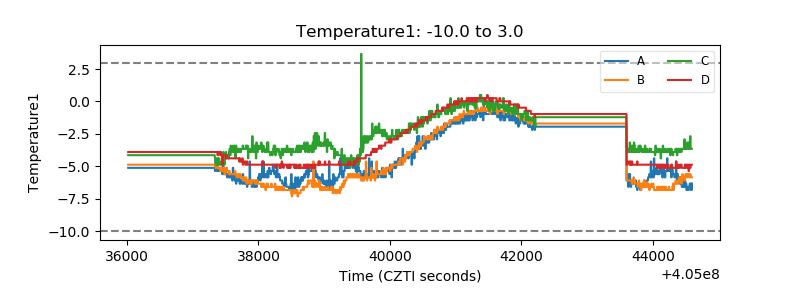 |
| Veto HV Monitor |  |
| Veto LLD | 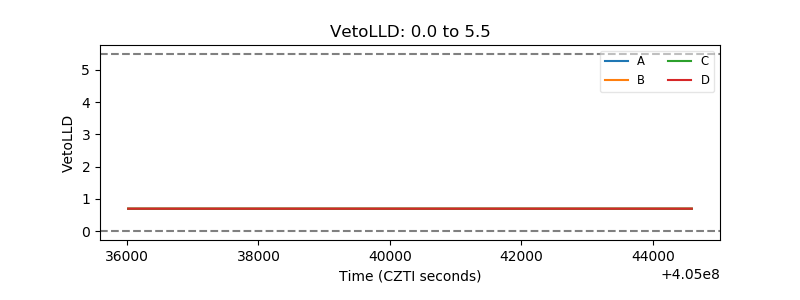 |
| Alpha Counter | 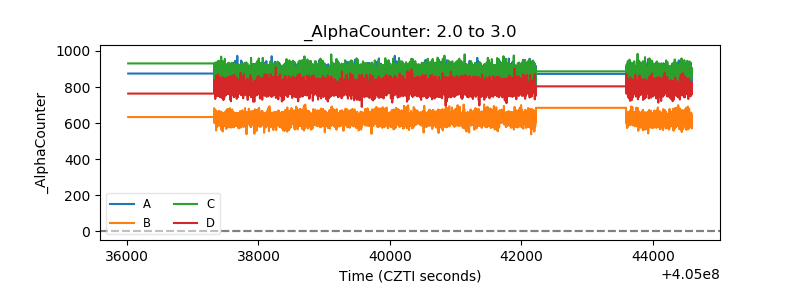 |
| _CPM_Rate | 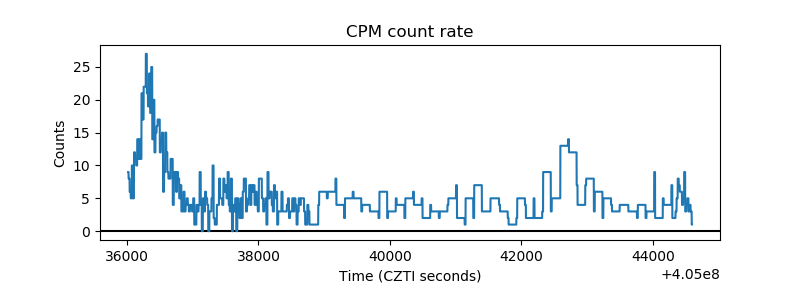 |
| CZT Counter | 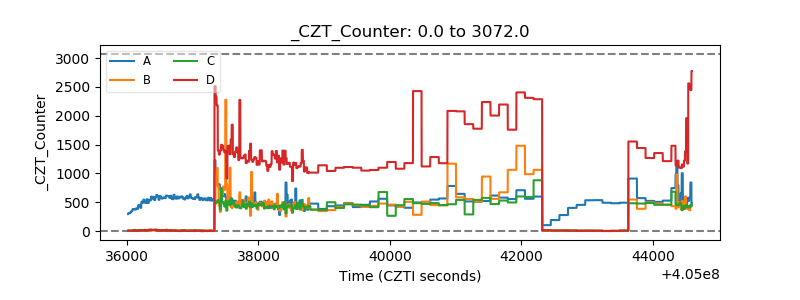 |
| +2.5 Volts monitor | 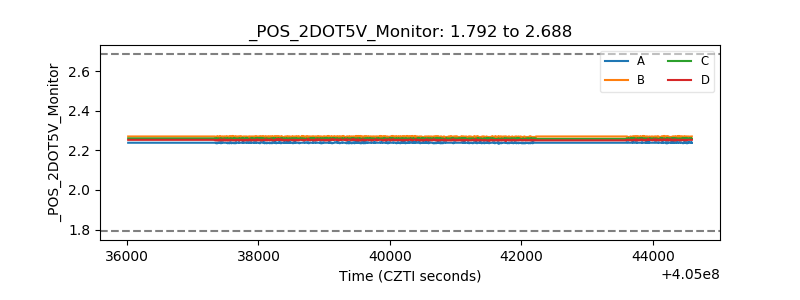 |
| +5 Volts monitor | 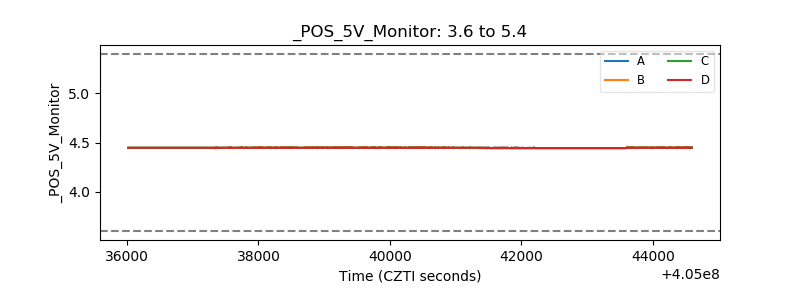 |
| _ROLL_ROT | 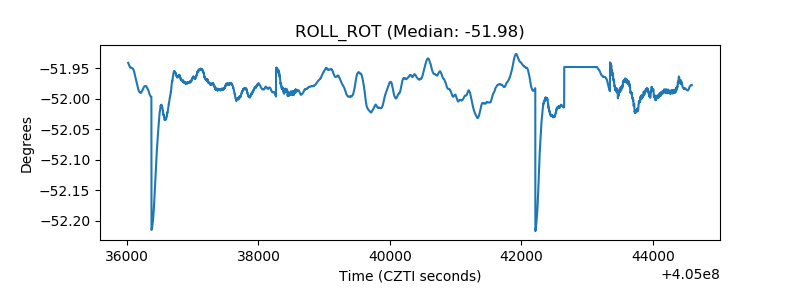 |
| _Roll_DEC | 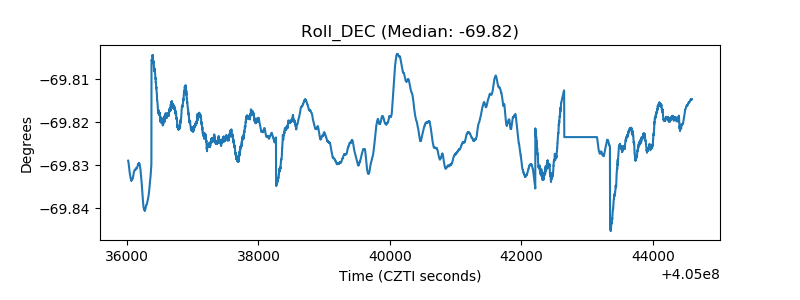 |
| _Roll_RA | 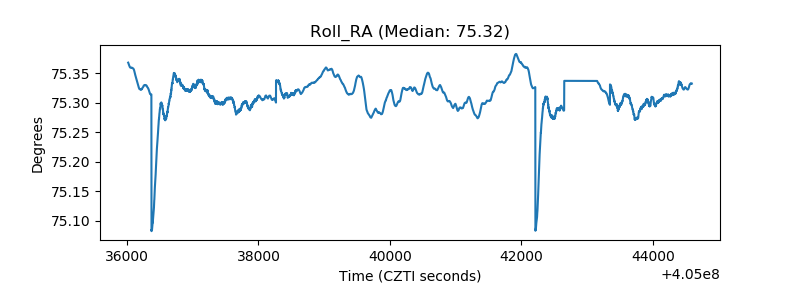 |
| Veto Counter | 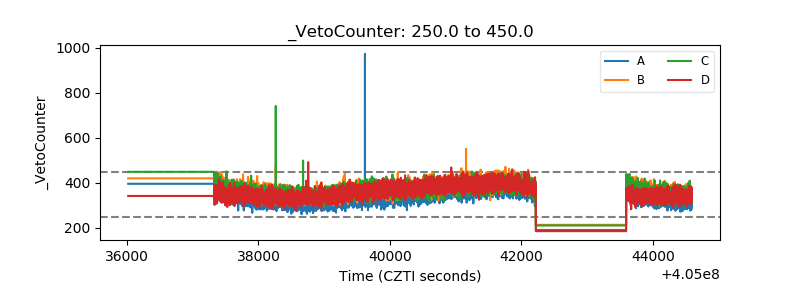 |