| Param | Original file | Final file |
|---|---|---|
| Filename | modeM0/AS1A10_094T24_9000005374_38366cztM0_level2.fits | modeM0/AS1A10_094T24_9000005374_38366cztM0_level2_quad_clean.evt |
| Size (bytes) | 463,032,000 | 79,156,800 |
| Size | 441.6 MB | 75.5 MB |
| Events in quadrant A | 2,853,062 | 565,388 |
| Events in quadrant B | 2,725,928 | 578,371 |
| Events in quadrant C | 2,422,082 | 557,136 |
| Events in quadrant D | 8,743,787 | 339,425 |
| Mode SS | |||
|---|---|---|---|
| Quadrant | BADHDUFLAG | Total packets | Discarded packets |
| A | 0 | 104 | 0 |
| B | 0 | 104 | 0 |
| C | 0 | 104 | 0 |
| D | 0 | 104 | 0 |
| Mode M0 | |||
|---|---|---|---|
| Quadrant | BADHDUFLAG | Total packets | Discarded packets |
| A | 0 | 11703 | 2 |
| B | 0 | 11552 | 2 |
| C | 0 | 10288 | 2 |
| D | 0 | 29542 | 2 |
| Mode M9 | |||
|---|---|---|---|
| Quadrant | BADHDUFLAG | Total packets | Discarded packets |
| A | 0 | 16 | 0 |
| B | 0 | 16 | 0 |
| C | 0 | 16 | 0 |
| D | 0 | 17 | 0 |
| Quadrant | Total seconds | Saturated seconds | Saturation percentage |
|---|---|---|---|
| A | 5081 | 17 | 0.334580% |
| B | 5081 | 44 | 0.865971% |
| C | 5081 | 7 | 0.137768% |
| D | 5081 | 1868 | 36.764416% |
Noise dominated data is calculated using 1-second bins in cleaned event files. If a bin has >2000 counts, and if more than 50% of those come from <1% of pixels, then it is considered to be noise-dominated and hence unusable.
| Quadrant | # 1 sec bins | Bins with >0 counts | Bins with >2000 counts | High rate bins dominated by noise | Noise dominated (total time) | Noise dominated (detector-on time) | Marked lightcurve |
|---|---|---|---|---|---|---|---|
| A | 6394 | 5082 | 10 | 10 | 0.16% | 0.20% | 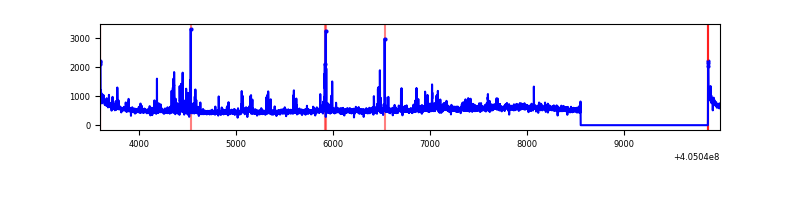 |
| B | 6394 | 5082 | 21 | 21 | 0.33% | 0.41% | 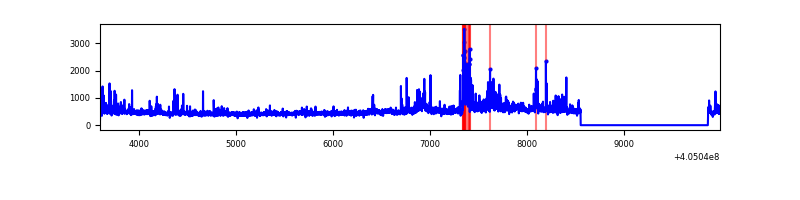 |
| C | 6394 | 5082 | 1 | 1 | 0.02% | 0.02% | 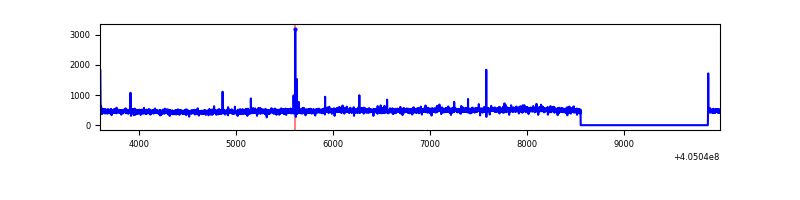 |
| D | 6394 | 5081 | 1798 | 1798 | 28.12% | 35.39% | 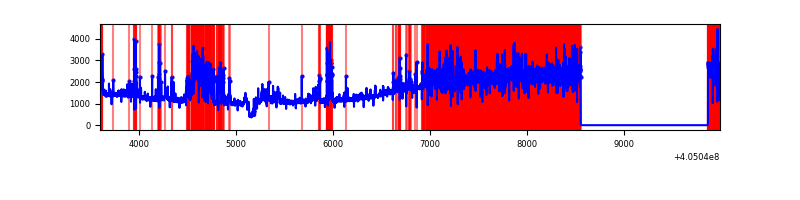 |
Top three noisy pixels from each quadrant. If the there are fewer than three noisy pixels in the level2.evt file, extra rows are filled as -1
| Pixel properties | Quadrant properties | ||||||
|---|---|---|---|---|---|---|---|
| Quadrant | DetID | PixID | Counts | Sigma | Mean | Median | Sigma |
| A | 10 | 83 | 369834 | 3202.46 | 565 | 553 | 115.3 |
| A | 13 | 248 | 101739 | 877.5 | 565 | 553 | 115.3 |
| A | 9 | 143 | 90623 | 781.1 | 565 | 553 | 115.3 |
| B | 0 | 183 | 100268 | 920.97 | 564 | 547 | 108.3 |
| B | 0 | 155 | 57291 | 524.06 | 564 | 547 | 108.3 |
| B | 4 | 171 | 52386 | 478.76 | 564 | 547 | 108.3 |
| C | 15 | 214 | 212796 | 1639.17 | 555 | 559 | 129.5 |
| C | 14 | 67 | 12260 | 90.37 | 555 | 559 | 129.5 |
| C | 12 | 249 | 12065 | 88.86 | 555 | 559 | 129.5 |
| D | 10 | 203 | 5100597 | 41921.11 | 496 | 481 | 121.7 |
| D | 12 | 227 | 790658 | 6494.97 | 496 | 481 | 121.7 |
| D | 11 | 176 | 371075 | 3046.14 | 496 | 481 | 121.7 |
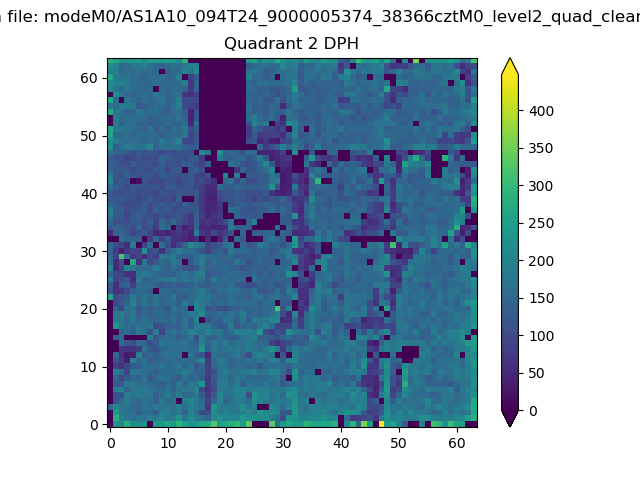
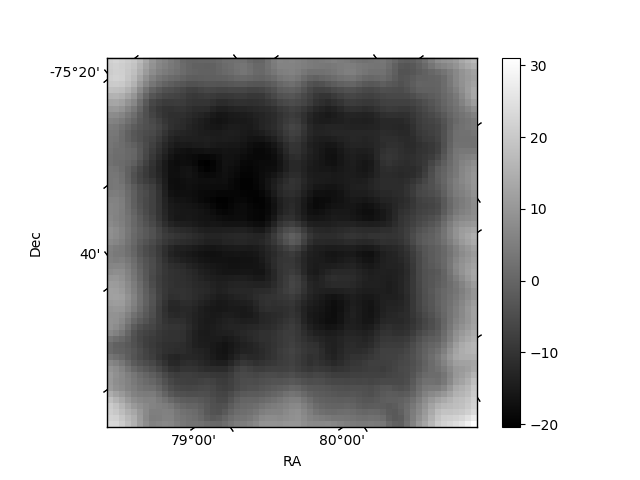
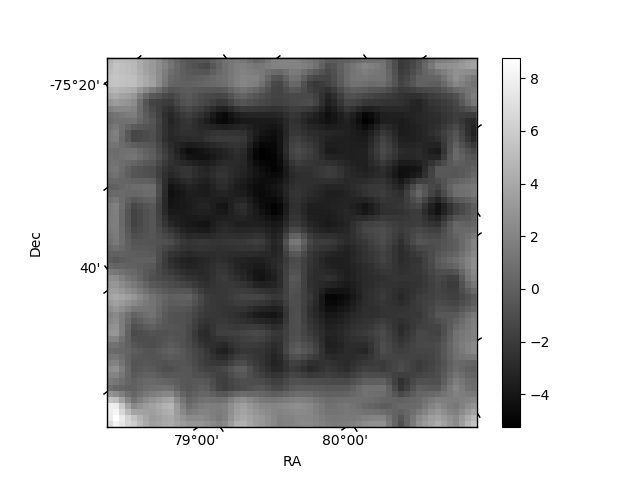
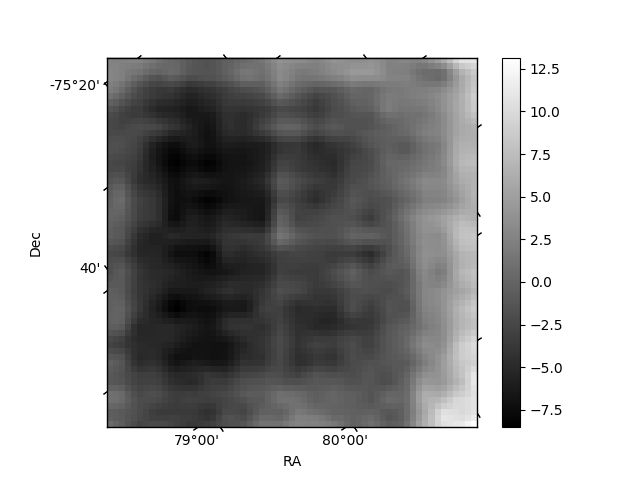
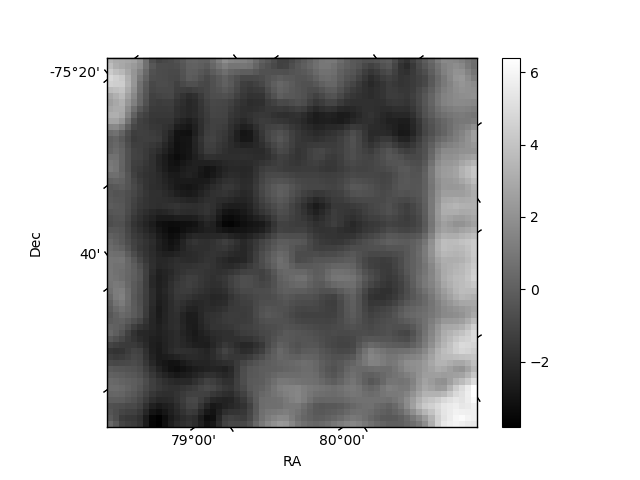
Histogram calculated using DETX and DETY for each event in the final _common_clean file
| Quadrant A | 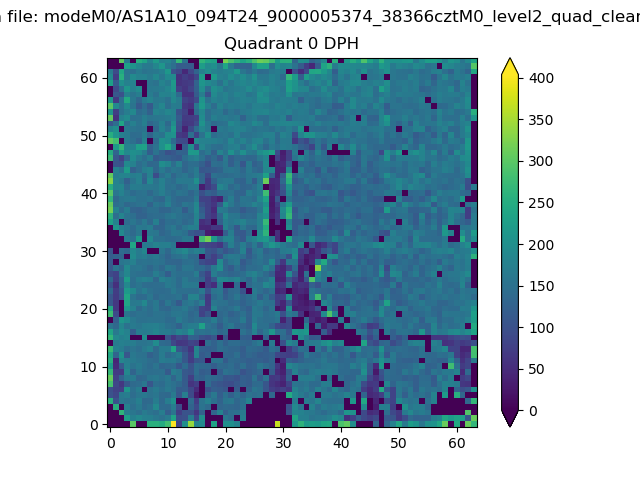 |
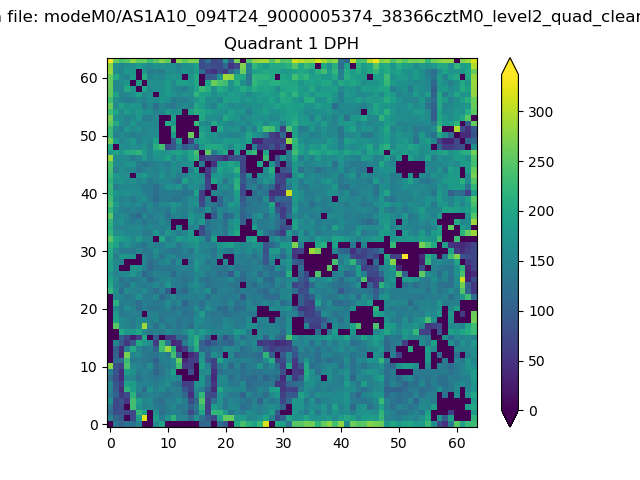 |
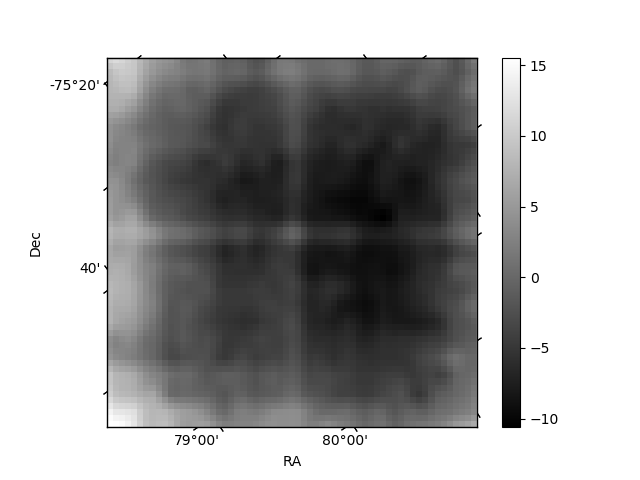
Quadrant B |
|---|---|---|---|
| Quadrant D | 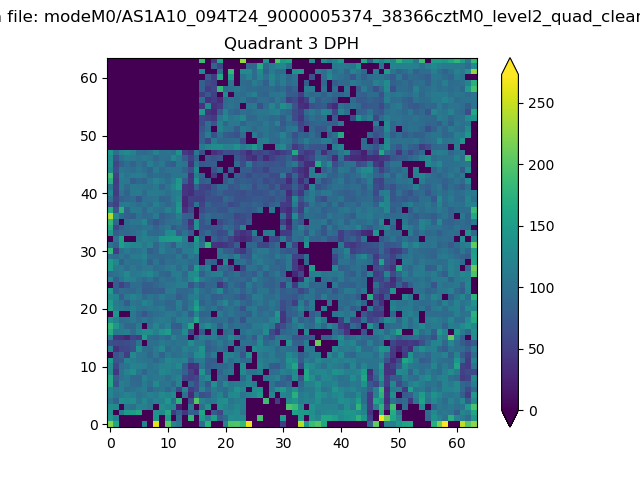 |
 |
Quadrant C |
| Plot type | Count rate plots | Images |
|---|---|---|
| Comparison with Poisson distribution Blue bars denote a histogram of data divided into 1 sec bins. Red curve is a Poisson curve with rate = median count rate of data. |
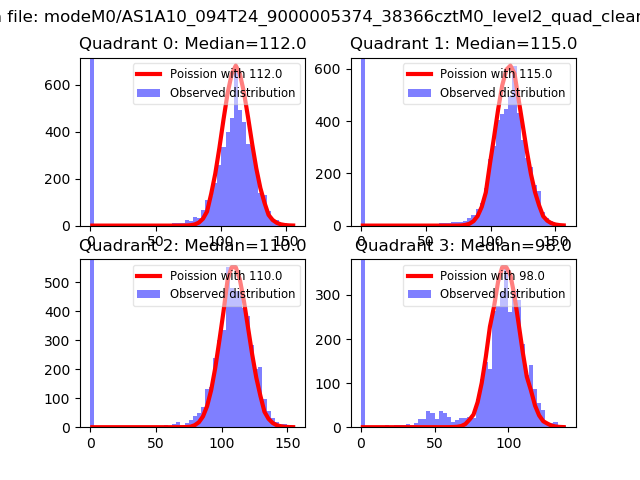 |
 |
| Quadrant-wise count rates Data is divided into 100 sec bins |
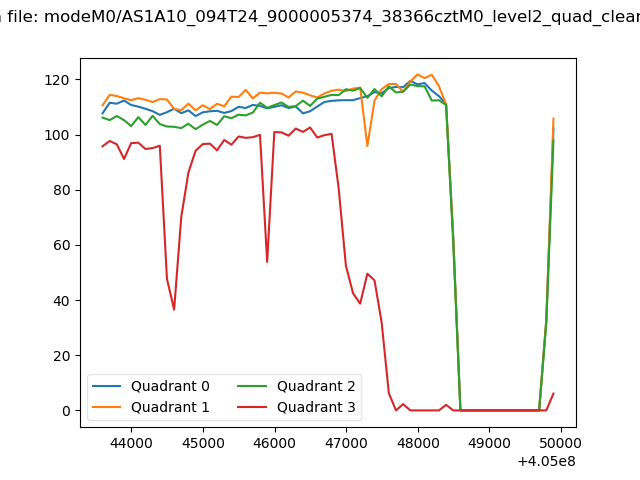 |
|
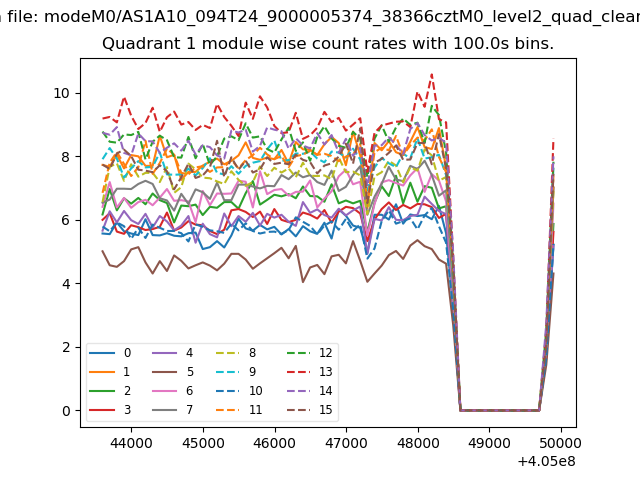
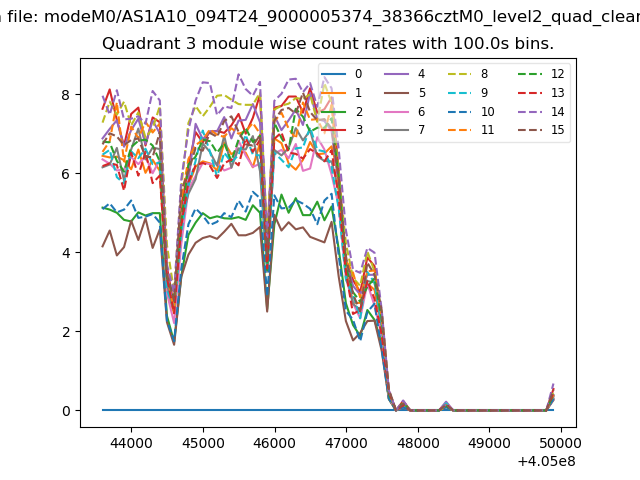
| Module-wise count rates for Quadrant A Data is divided into 100 sec bins |
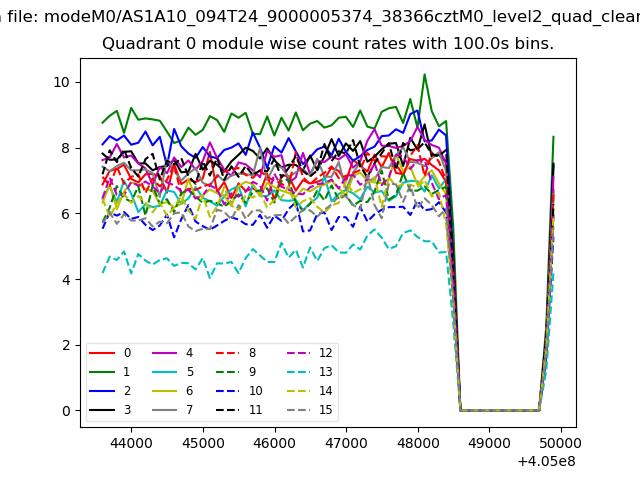 |
 |
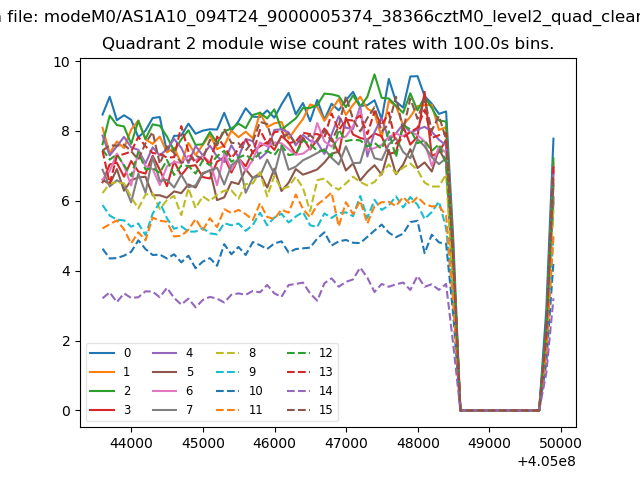
| Module-wise count rates for Quadrant B Data is divided into 100 sec bins |
 |
 |
| Module-wise count rates for Quadrant C Data is divided into 100 sec bins |
 |
 |
| Module-wise count rates for Quadrant D Data is divided into 100 sec bins |
 |
 |
| Parameter | Plot |
|---|---|
| CZT HV Monitor | 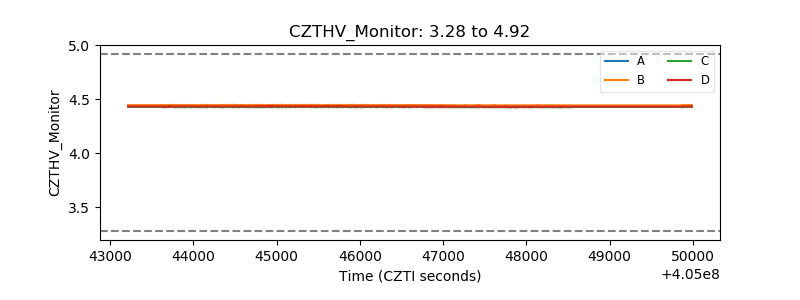 |
| D_VDD | 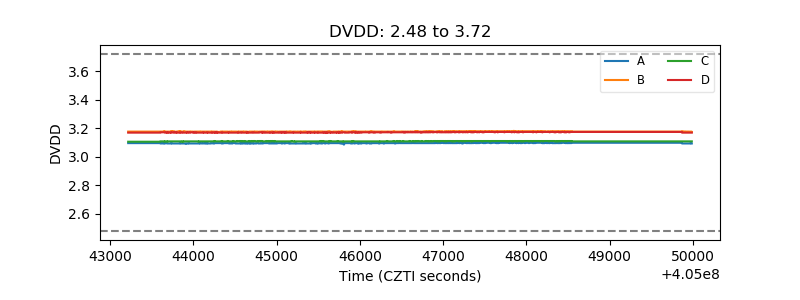 |
| Temperature 1 | 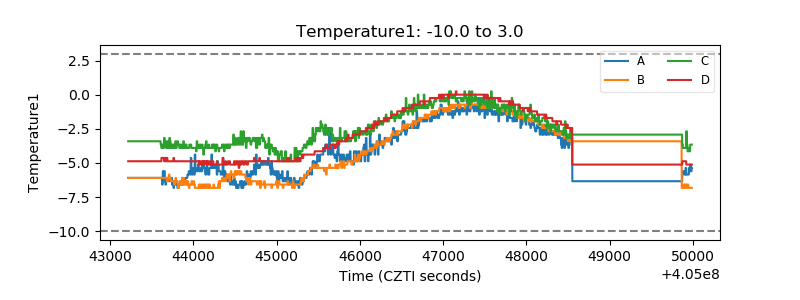 |
| Veto HV Monitor |  |
| Veto LLD | 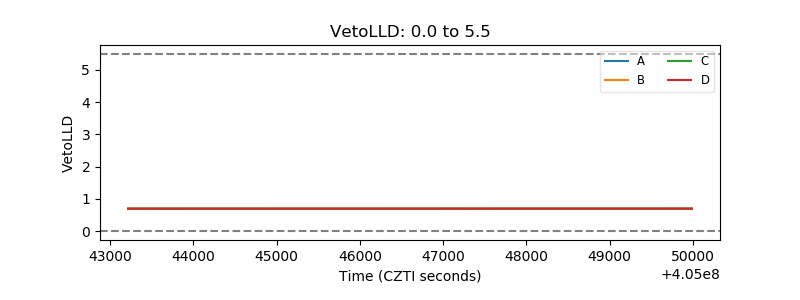 |
| Alpha Counter | 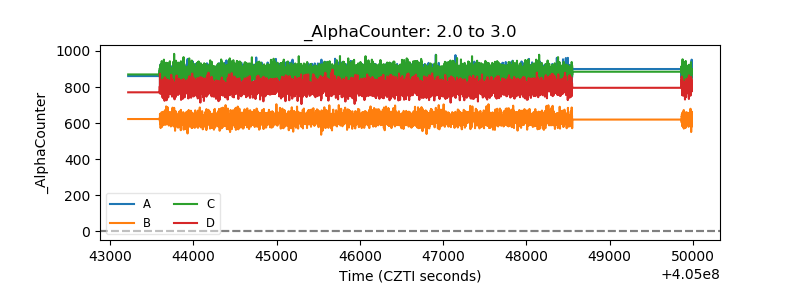 |
| _CPM_Rate | 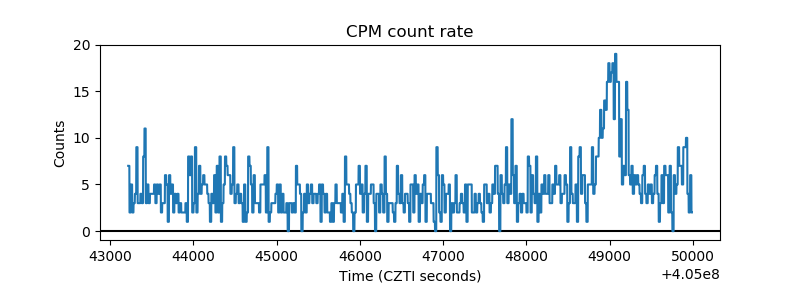 |
| CZT Counter | 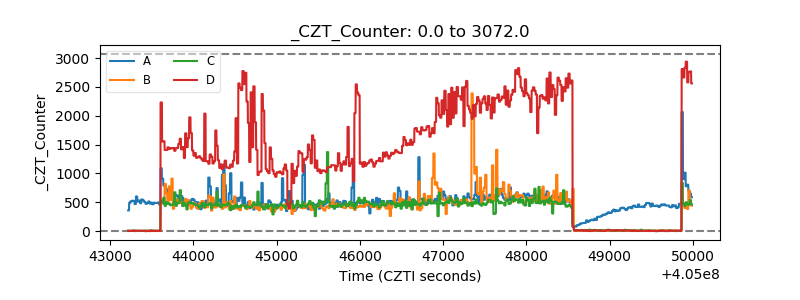 |
| +2.5 Volts monitor | 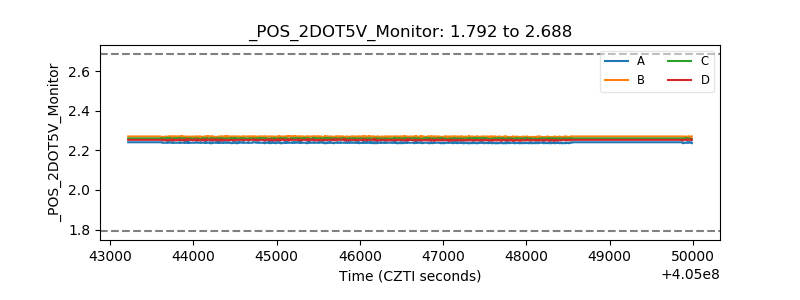 |
| +5 Volts monitor | 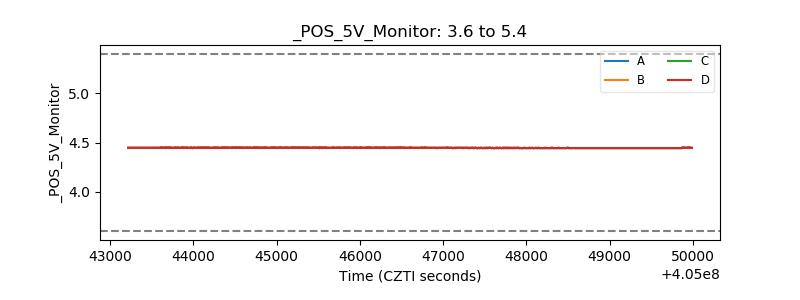 |
| _ROLL_ROT | 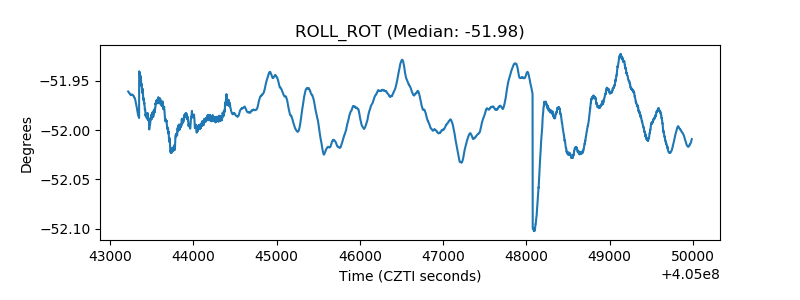 |
| _Roll_DEC | 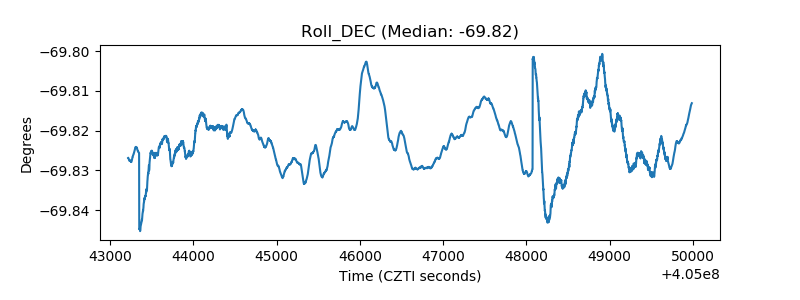 |
| _Roll_RA | 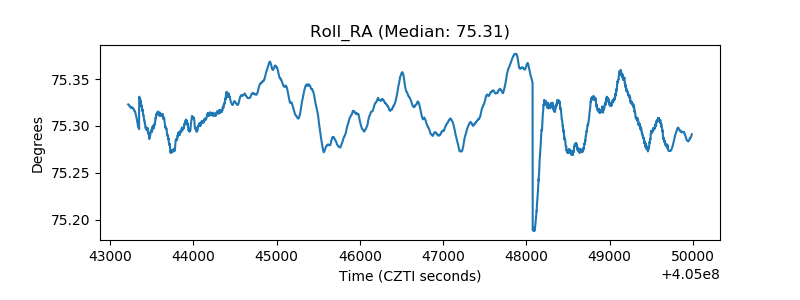 |
| Veto Counter | 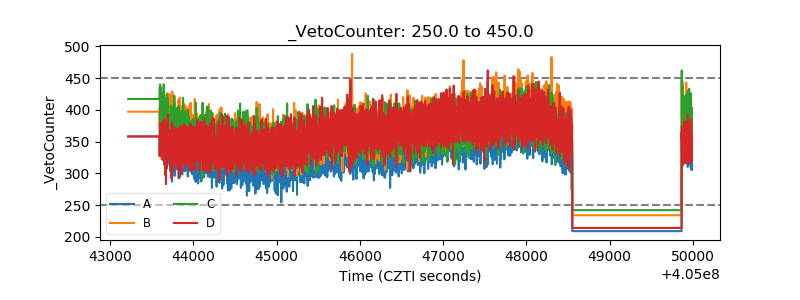 |