| Param | Original file | Final file |
|---|---|---|
| Filename | modeM0/AS1A10_094T24_9000005374_38369cztM0_level2.fits | modeM0/AS1A10_094T24_9000005374_38369cztM0_level2_quad_clean.evt |
| Size (bytes) | 47,321,280 | 5,705,280 |
| Size | 45.1 MB | 5.4 MB |
| Events in quadrant A | 258,446 | 45,331 |
| Events in quadrant B | 230,634 | 46,257 |
| Events in quadrant C | 199,938 | 44,189 |
| Events in quadrant D | 1,027,125 | 689 |
| Mode SS | |||
|---|---|---|---|
| Quadrant | BADHDUFLAG | Total packets | Discarded packets |
| A | 0 | 10 | 0 |
| B | 0 | 10 | 0 |
| C | 0 | 10 | 0 |
| D | 0 | 10 | 0 |
| Mode M0 | |||
|---|---|---|---|
| Quadrant | BADHDUFLAG | Total packets | Discarded packets |
| A | 0 | 1018 | 1 |
| B | 0 | 936 | 1 |
| C | 0 | 833 | 1 |
| D | 0 | 3327 | 1 |
| Mode M9 | |||
|---|---|---|---|
| Quadrant | BADHDUFLAG | Total packets | Discarded packets |
| A | 0 | 13 | 0 |
| B | 0 | 13 | 0 |
| C | 0 | 13 | 0 |
| D | 0 | 13 | 0 |
| Quadrant | Total seconds | Saturated seconds | Saturation percentage |
|---|---|---|---|
| A | 409 | 1 | 0.244499% |
| B | 409 | 2 | 0.488998% |
| C | 409 | 1 | 0.244499% |
| D | 409 | 402 | 98.288509% |
Noise dominated data is calculated using 1-second bins in cleaned event files. If a bin has >2000 counts, and if more than 50% of those come from <1% of pixels, then it is considered to be noise-dominated and hence unusable.
| Quadrant | # 1 sec bins | Bins with >0 counts | Bins with >2000 counts | High rate bins dominated by noise | Noise dominated (total time) | Noise dominated (detector-on time) | Marked lightcurve |
|---|---|---|---|---|---|---|---|
| A | 1722 | 410 | 3 | 3 | 0.17% | 0.73% | 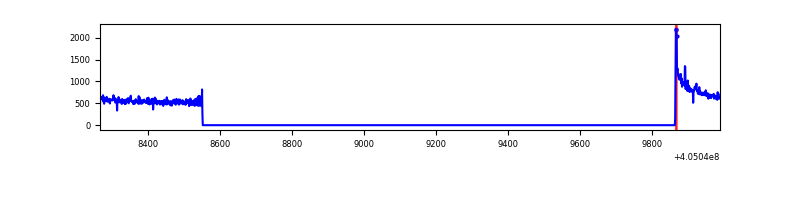 |
| B | 1722 | 410 | 0 | 0 | 0.00% | 0.00% | 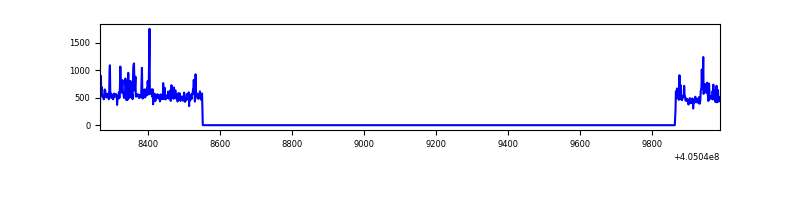 |
| C | 1722 | 410 | 0 | 0 | 0.00% | 0.00% | 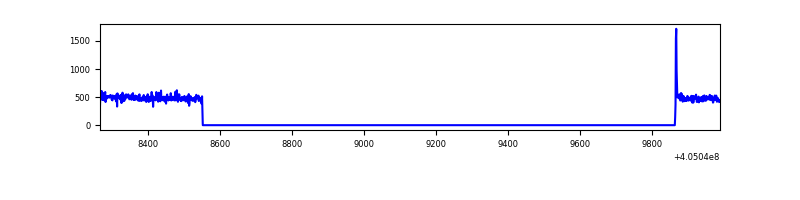 |
| D | 1722 | 409 | 374 | 374 | 21.72% | 91.44% | 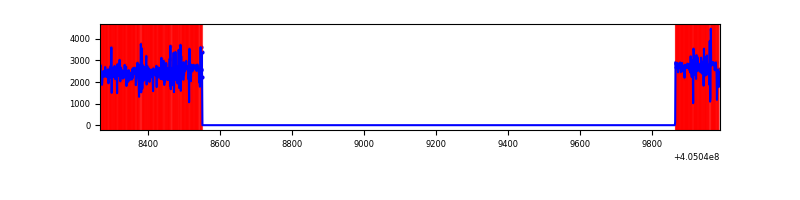 |
Top three noisy pixels from each quadrant. If the there are fewer than three noisy pixels in the level2.evt file, extra rows are filled as -1
| Pixel properties | Quadrant properties | ||||||
|---|---|---|---|---|---|---|---|
| Quadrant | DetID | PixID | Counts | Sigma | Mean | Median | Sigma |
| A | 10 | 83 | 65418 | 5459.23 | 47 | 46 | 12.0 |
| A | 12 | 189 | 3039 | 249.95 | 47 | 46 | 12.0 |
| A | 10 | 67 | 2160 | 176.54 | 47 | 46 | 12.0 |
| B | 5 | 184 | 6243 | 549.54 | 47 | 46 | 11.3 |
| B | 15 | 85 | 5502 | 483.83 | 47 | 46 | 11.3 |
| B | 0 | 230 | 5440 | 478.33 | 47 | 46 | 11.3 |
| C | 15 | 214 | 18925 | 1519.15 | 45 | 45 | 12.4 |
| C | 0 | 10 | 3820 | 303.75 | 45 | 45 | 12.4 |
| C | 14 | 67 | 471 | 34.28 | 45 | 45 | 12.4 |
| D | 10 | 203 | 477945 | 53673.92 | 27 | 26 | 8.9 |
| D | 12 | 227 | 228766 | 25689.23 | 27 | 26 | 8.9 |
| D | 11 | 176 | 129314 | 14520.02 | 27 | 26 | 8.9 |
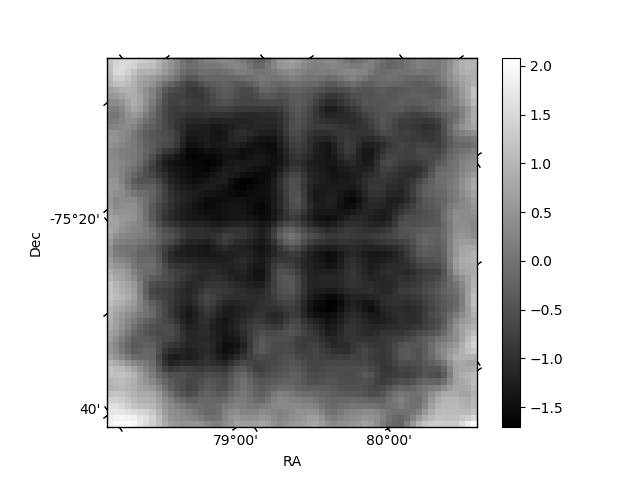
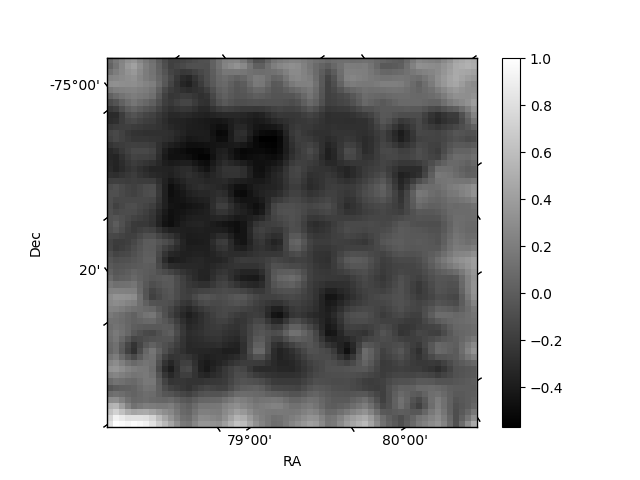
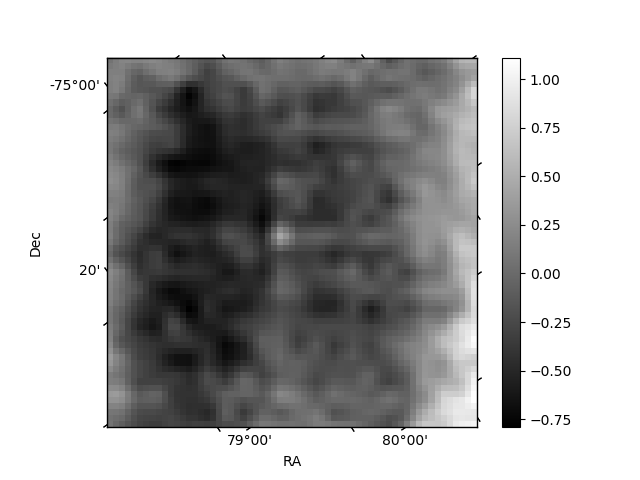
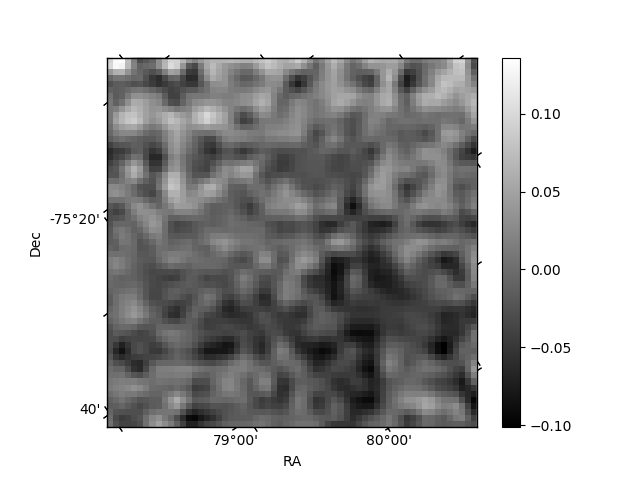
Histogram calculated using DETX and DETY for each event in the final _common_clean file
| Quadrant A | 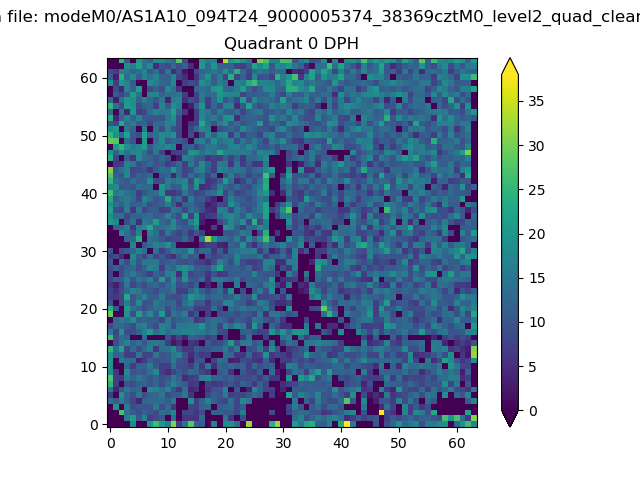 |
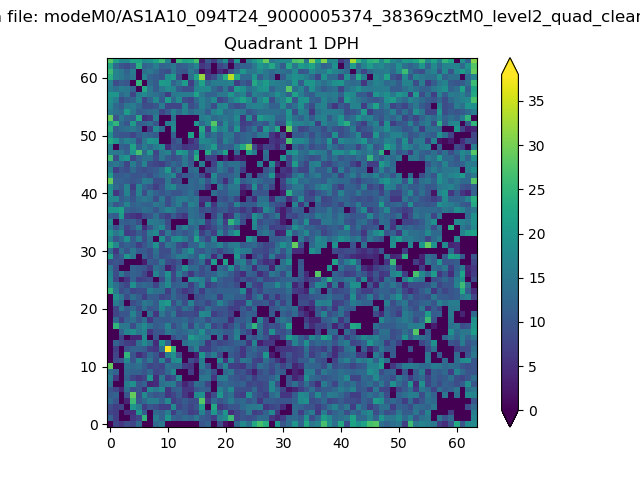 |
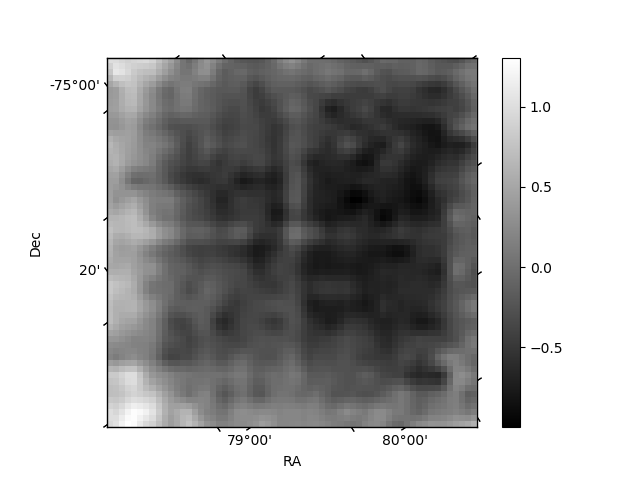
Quadrant B |
|---|---|---|---|
| Quadrant D | 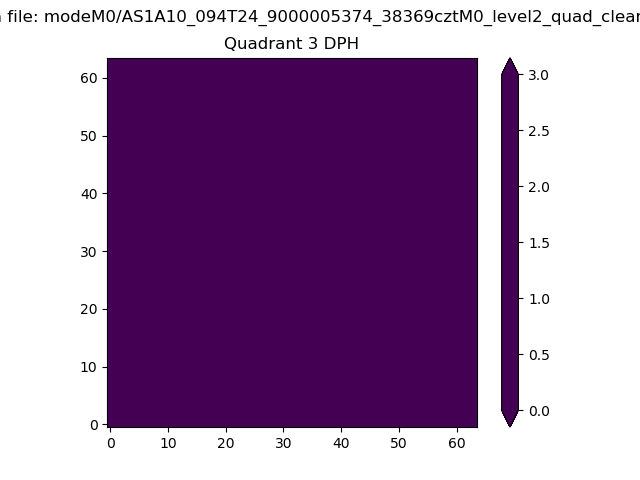 |
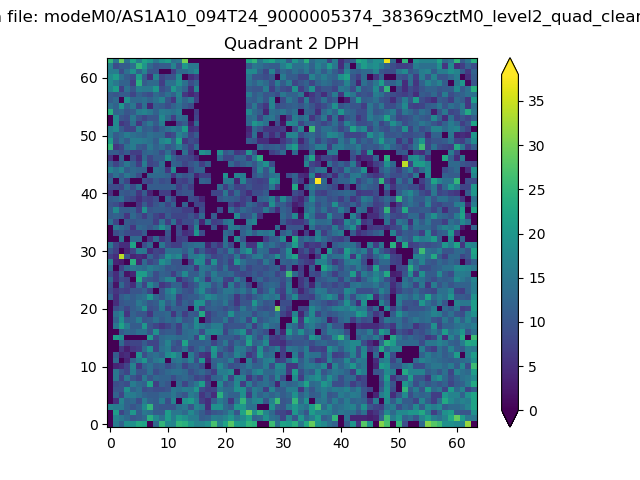 |
Quadrant C |
| Plot type | Count rate plots | Images |
|---|---|---|
| Comparison with Poisson distribution Blue bars denote a histogram of data divided into 1 sec bins. Red curve is a Poisson curve with rate = median count rate of data. |
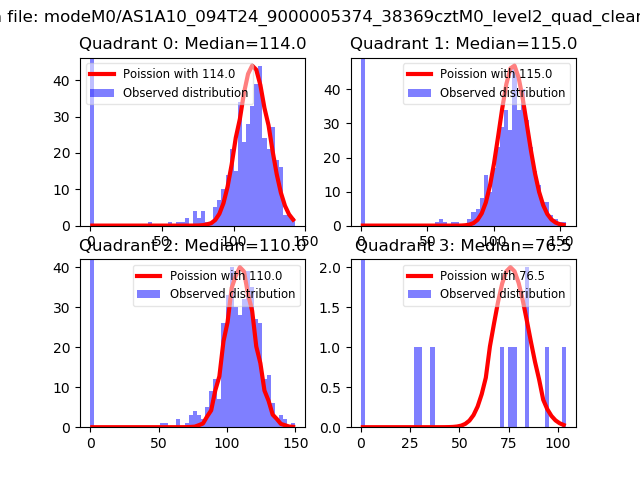 |
 |
| Quadrant-wise count rates Data is divided into 100 sec bins |
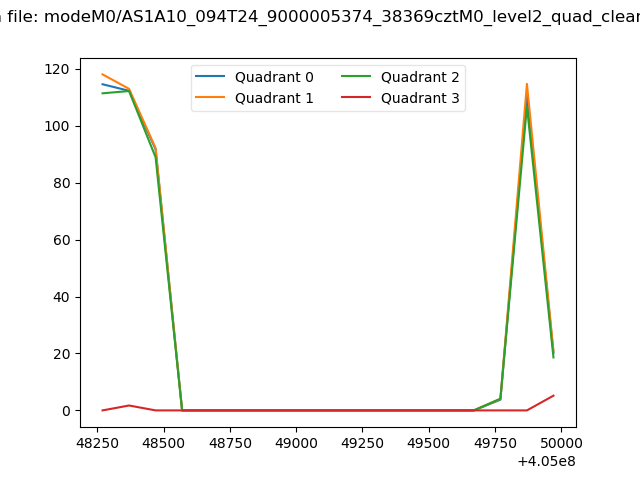 |
|
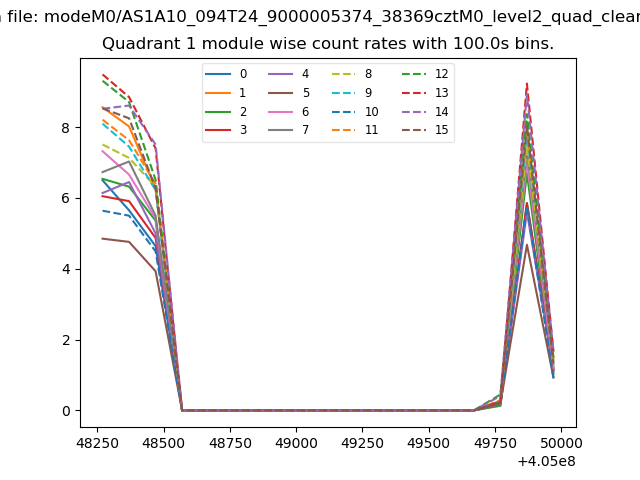
| Module-wise count rates for Quadrant A Data is divided into 100 sec bins |
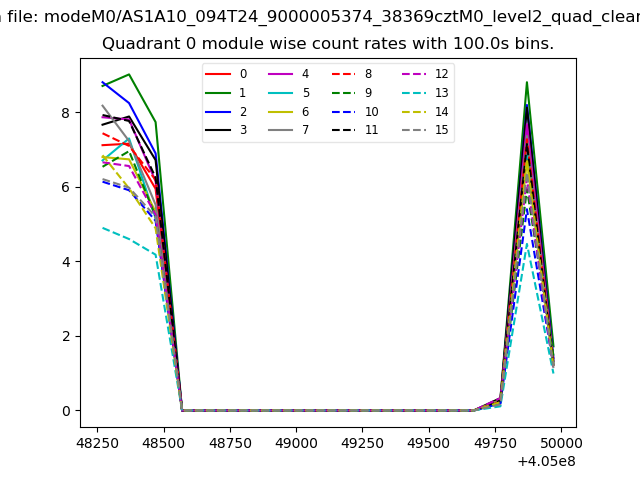 |
 |
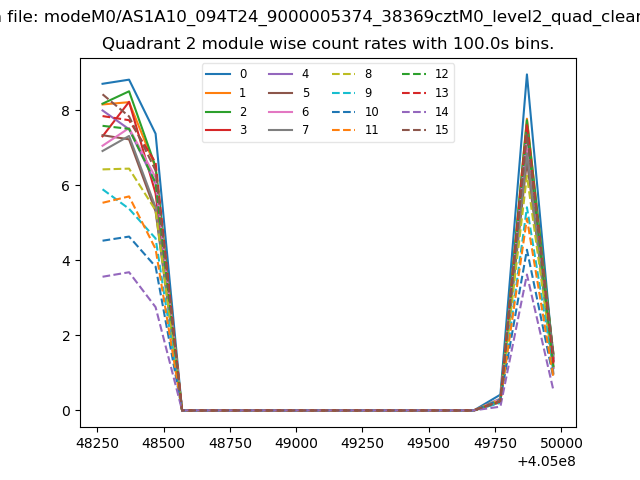
| Module-wise count rates for Quadrant B Data is divided into 100 sec bins |
 |
 |
| Module-wise count rates for Quadrant C Data is divided into 100 sec bins |
 |
 |
| Module-wise count rates for Quadrant D Data is divided into 100 sec bins |
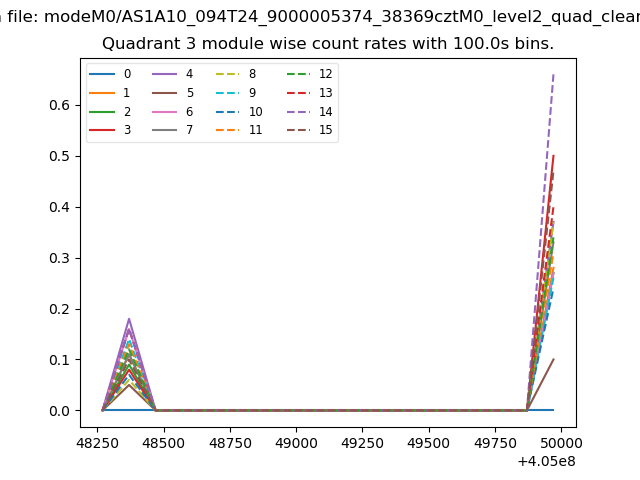 |
 |
| Parameter | Plot |
|---|---|
| CZT HV Monitor | 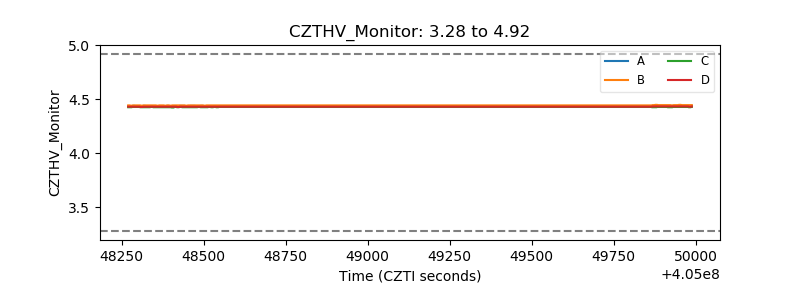 |
| D_VDD | 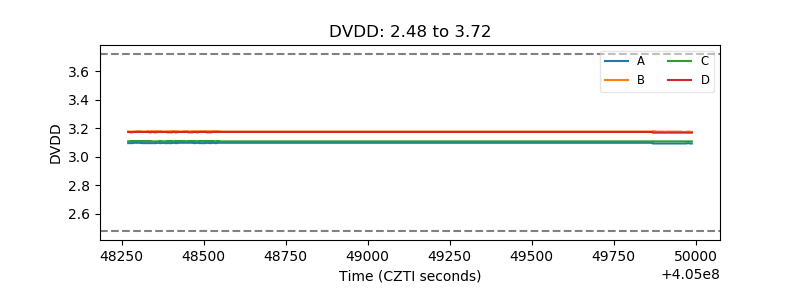 |
| Temperature 1 | 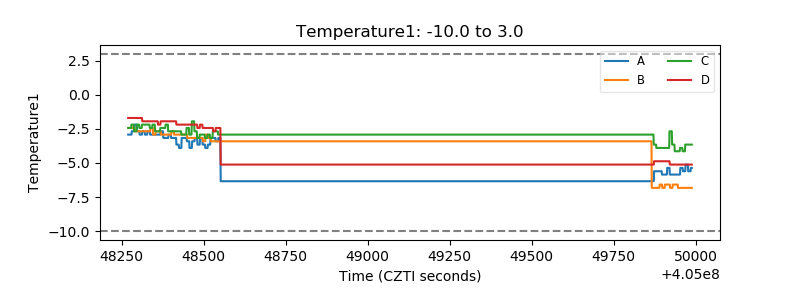 |
| Veto HV Monitor | 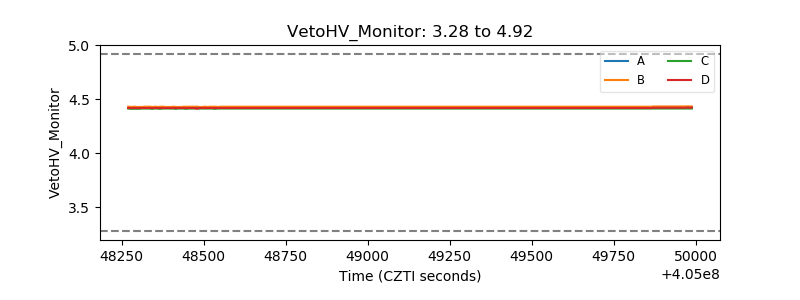 |
| Veto LLD | 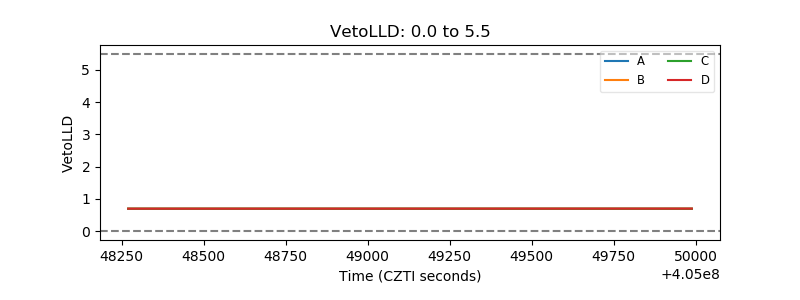 |
| Alpha Counter | 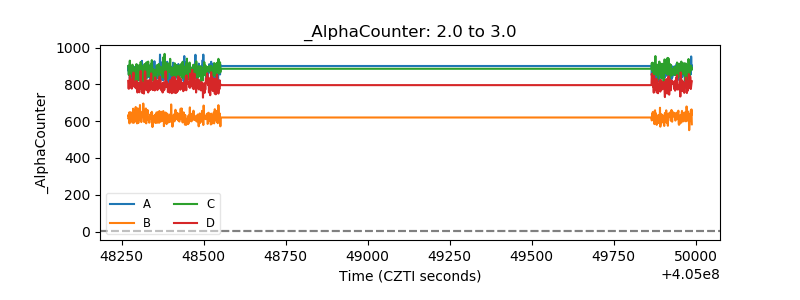 |
| _CPM_Rate | 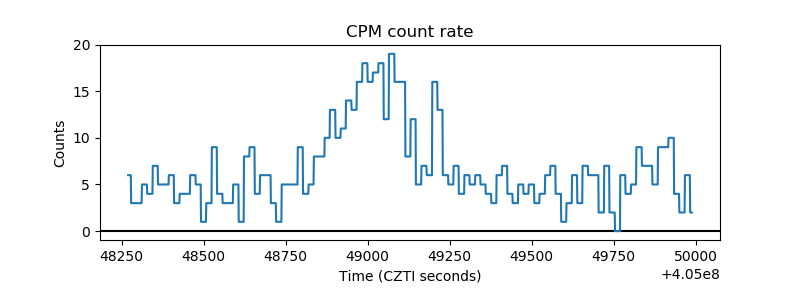 |
| CZT Counter | 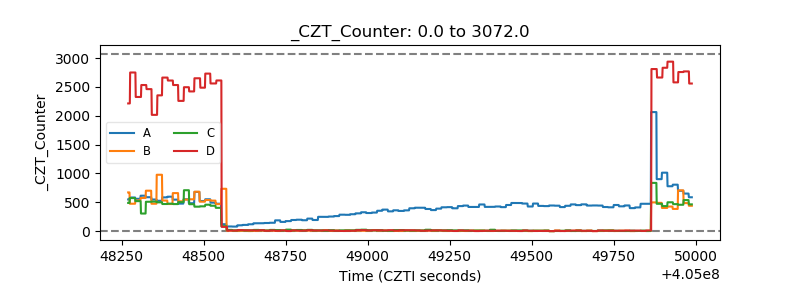 |
| +2.5 Volts monitor | 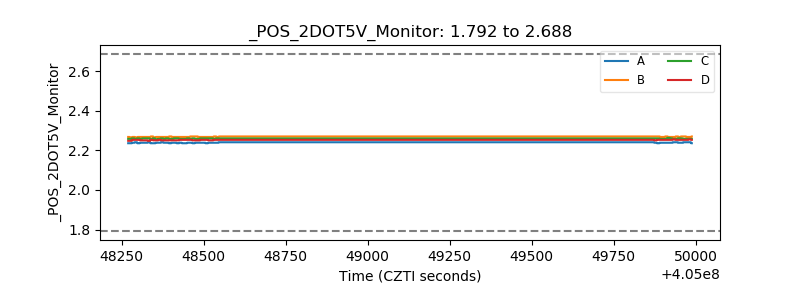 |
| +5 Volts monitor | 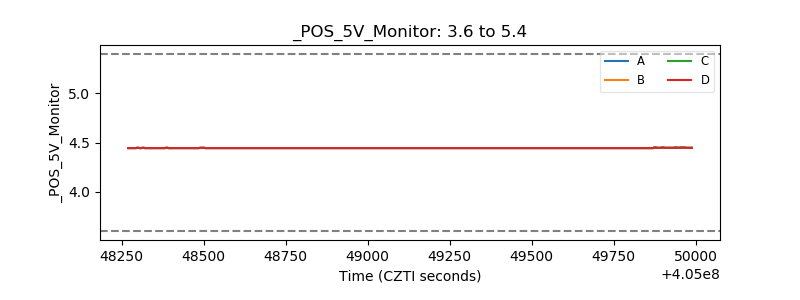 |
| _ROLL_ROT | 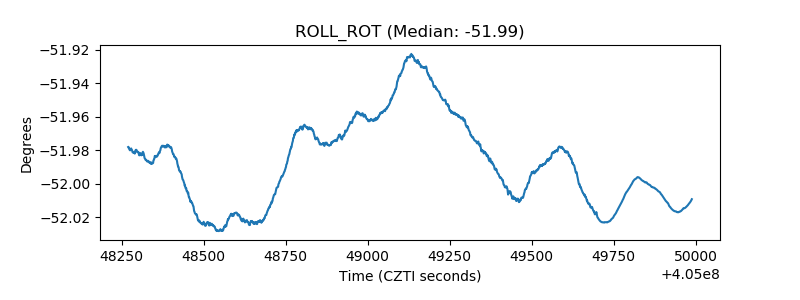 |
| _Roll_DEC | 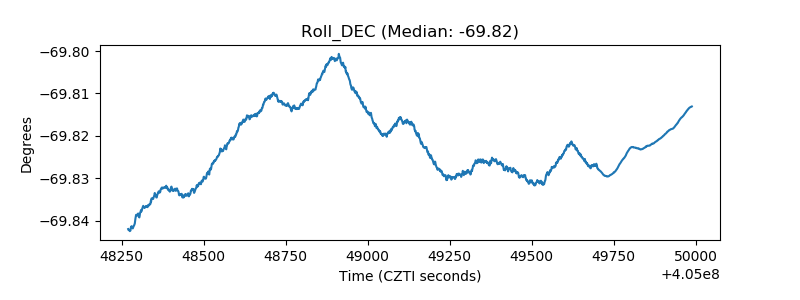 |
| _Roll_RA | 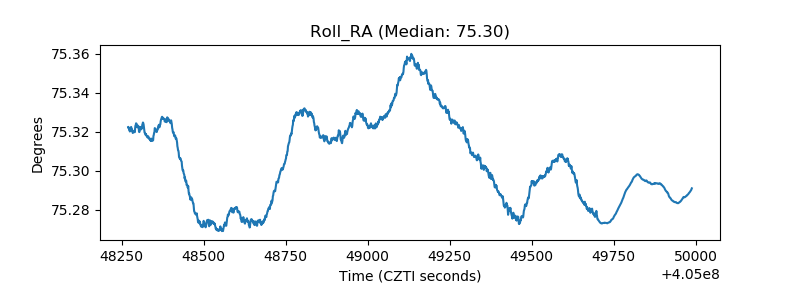 |
| Veto Counter | 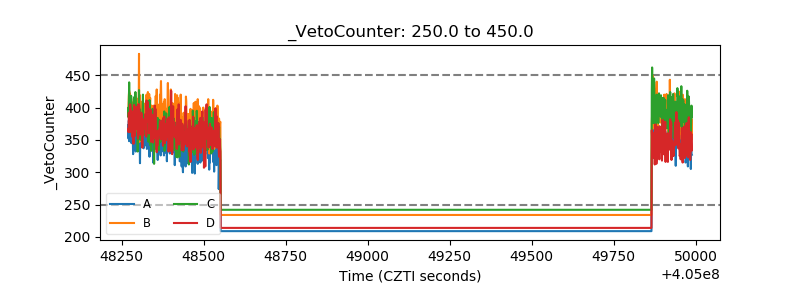 |