| Param | Original file | Final file |
|---|---|---|
| Filename | modeM0/AS1A12_005T08_9000005380_38376cztM0_level2.fits | modeM0/AS1A12_005T08_9000005380_38376cztM0_level2_quad_clean.evt |
| Size (bytes) | 152,003,520 | 41,184,000 |
| Size | 145.0 MB | 39.3 MB |
| Events in quadrant A | 1,273,416 | 277,495 |
| Events in quadrant B | 1,153,186 | 285,797 |
| Events in quadrant C | 1,175,728 | 276,040 |
| Events in quadrant D | 1,851,369 | 249,424 |
| Mode M0 | |||
|---|---|---|---|
| Quadrant | BADHDUFLAG | Total packets | Discarded packets |
| A | 0 | 5080 | 2 |
| B | 0 | 4707 | 1 |
| C | 0 | 4731 | 1 |
| D | 0 | 7189 | 1 |
| Mode M9 | |||
|---|---|---|---|
| Quadrant | BADHDUFLAG | Total packets | Discarded packets |
| A | 0 | 21 | 0 |
| B | 0 | 21 | 0 |
| C | 0 | 21 | 0 |
| D | 0 | 21 | 0 |
| Mode SS | |||
|---|---|---|---|
| Quadrant | BADHDUFLAG | Total packets | Discarded packets |
| A | 0 | 46 | 0 |
| B | 0 | 46 | 0 |
| C | 0 | 46 | 0 |
| D | 0 | 46 | 0 |
| Quadrant | Total seconds | Saturated seconds | Saturation percentage |
|---|---|---|---|
| A | 2195 | 18 | 0.820046% |
| B | 2195 | 2 | 0.091116% |
| C | 2195 | 9 | 0.410023% |
| D | 2195 | 54 | 2.460137% |
Noise dominated data is calculated using 1-second bins in cleaned event files. If a bin has >2000 counts, and if more than 50% of those come from <1% of pixels, then it is considered to be noise-dominated and hence unusable.
| Quadrant | # 1 sec bins | Bins with >0 counts | Bins with >2000 counts | High rate bins dominated by noise | Noise dominated (total time) | Noise dominated (detector-on time) | Marked lightcurve |
|---|---|---|---|---|---|---|---|
| A | 4318 | 2196 | 9 | 9 | 0.21% | 0.41% | 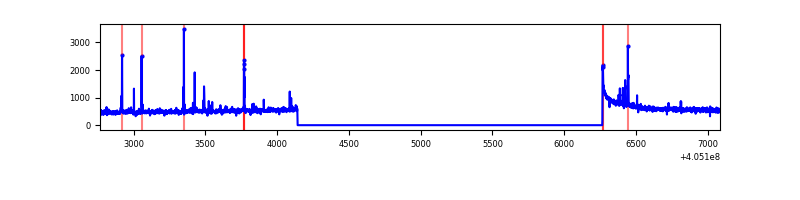 |
| B | 4318 | 2196 | 0 | 0 | 0.00% | 0.00% | 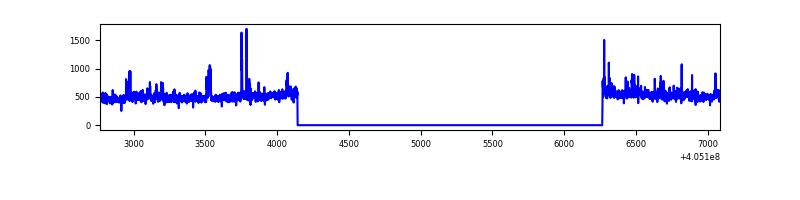 |
| C | 4318 | 2196 | 4 | 4 | 0.09% | 0.18% | 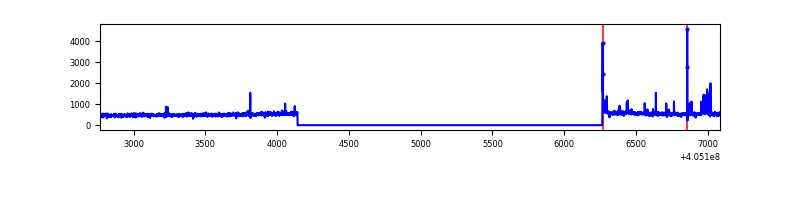 |
| D | 4318 | 2196 | 47 | 47 | 1.09% | 2.14% | 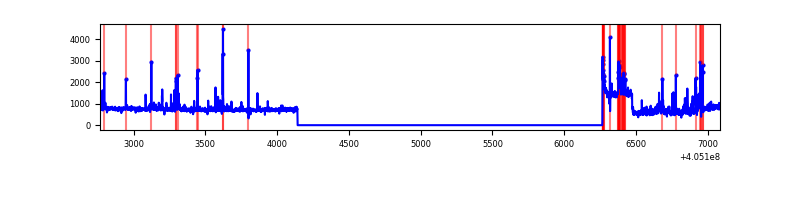 |
Top three noisy pixels from each quadrant. If the there are fewer than three noisy pixels in the level2.evt file, extra rows are filled as -1
| Pixel properties | Quadrant properties | ||||||
|---|---|---|---|---|---|---|---|
| Quadrant | DetID | PixID | Counts | Sigma | Mean | Median | Sigma |
| A | 10 | 83 | 175366 | 3169.42 | 266 | 261 | 55.2 |
| A | 9 | 143 | 53464 | 962.98 | 266 | 261 | 55.2 |
| A | 13 | 6 | 7930 | 138.81 | 266 | 261 | 55.2 |
| B | 0 | 183 | 29718 | 559.54 | 265 | 258 | 52.7 |
| B | 0 | 230 | 16470 | 307.92 | 265 | 258 | 52.7 |
| B | 4 | 232 | 16180 | 302.41 | 265 | 258 | 52.7 |
| C | 15 | 214 | 93983 | 1524.59 | 260 | 261 | 61.5 |
| C | 15 | 159 | 31685 | 511.18 | 260 | 261 | 61.5 |
| C | 14 | 254 | 20989 | 337.18 | 260 | 261 | 61.5 |
| D | 10 | 203 | 538074 | 8337.19 | 255 | 248 | 64.5 |
| D | 2 | 16 | 100491 | 1553.93 | 255 | 248 | 64.5 |
| D | 2 | 250 | 70337 | 1086.5 | 255 | 248 | 64.5 |
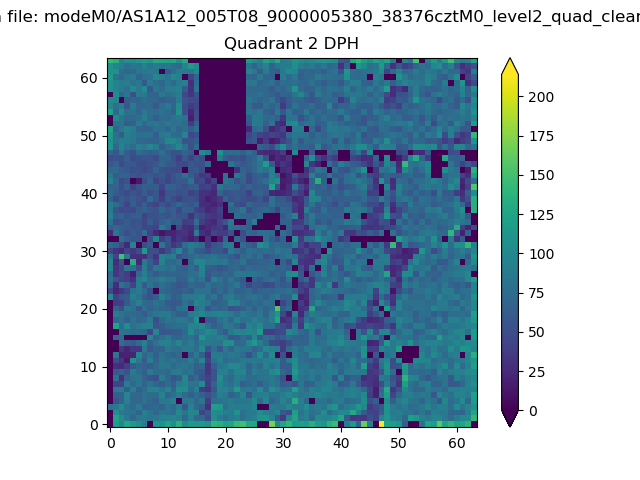
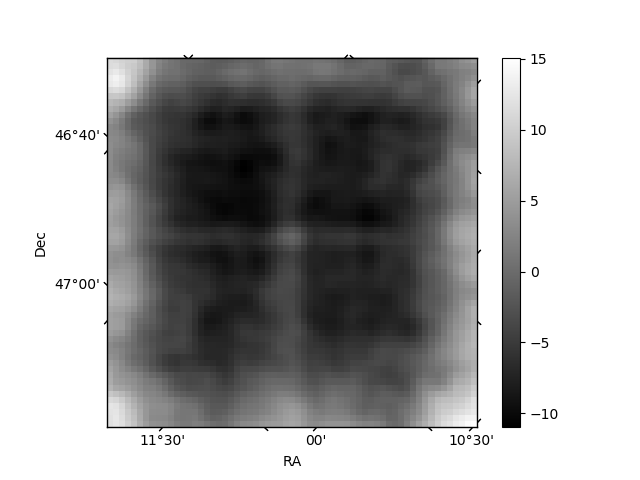
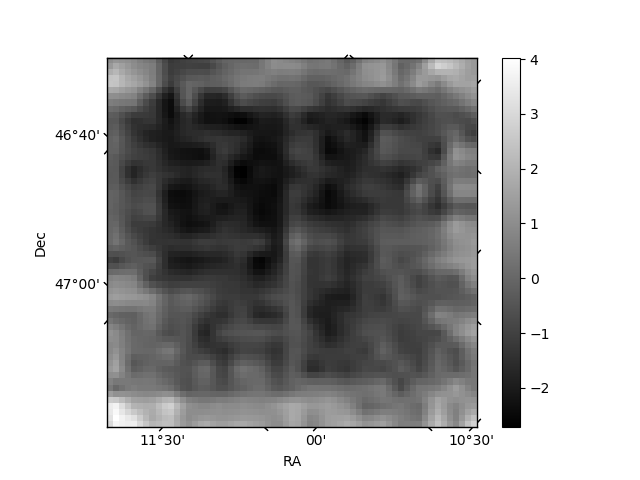
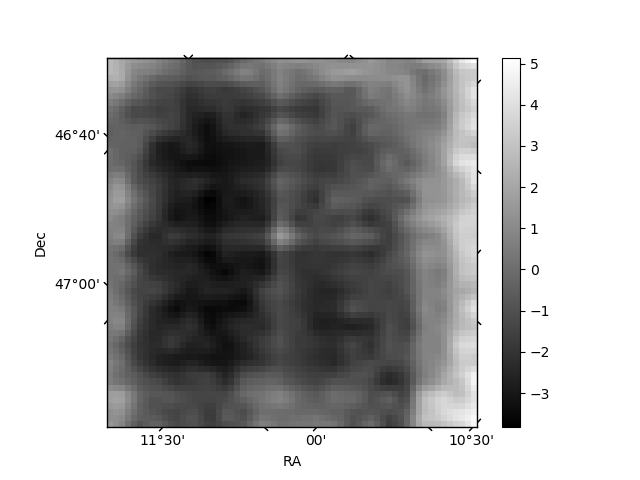
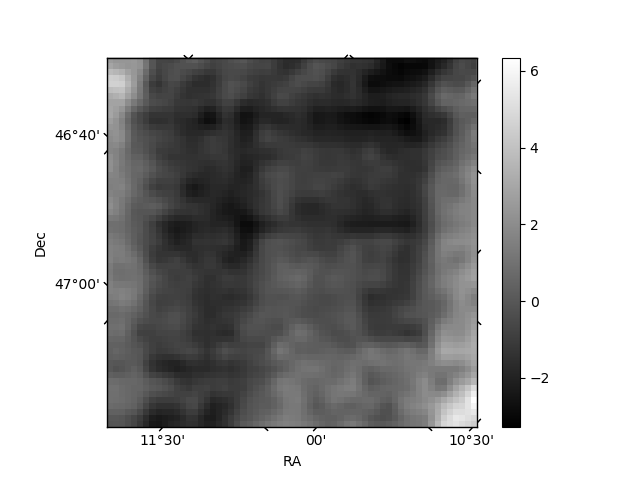
Histogram calculated using DETX and DETY for each event in the final _common_clean file
| Quadrant A | 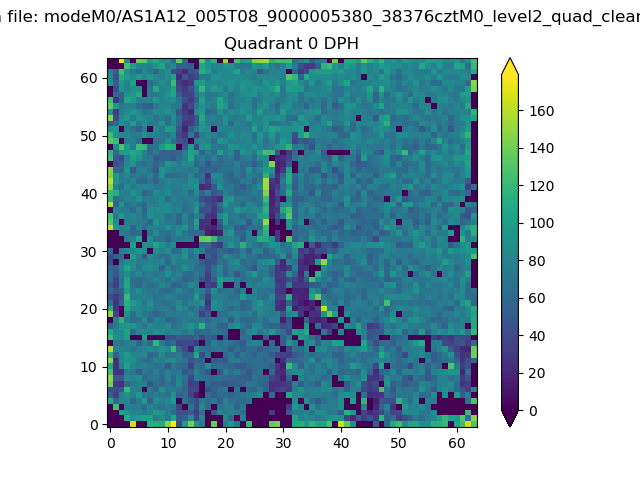 |
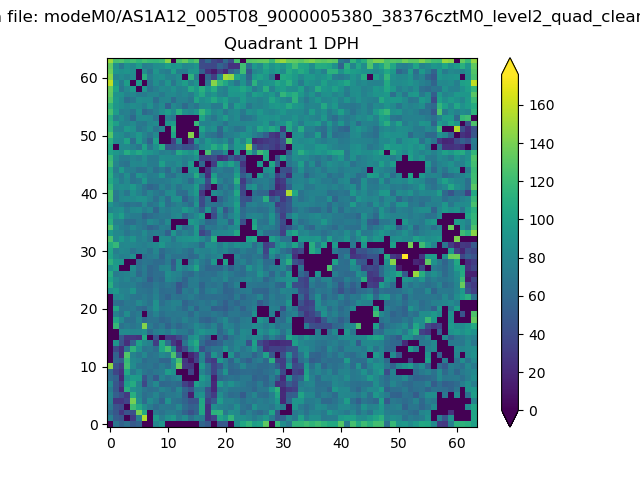 |
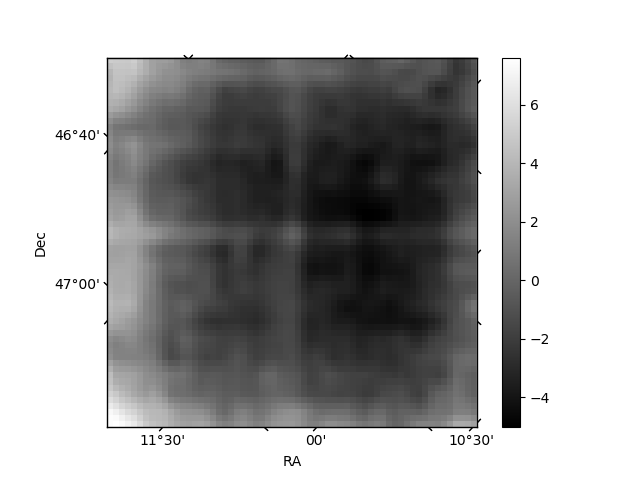
Quadrant B |
|---|---|---|---|
| Quadrant D | 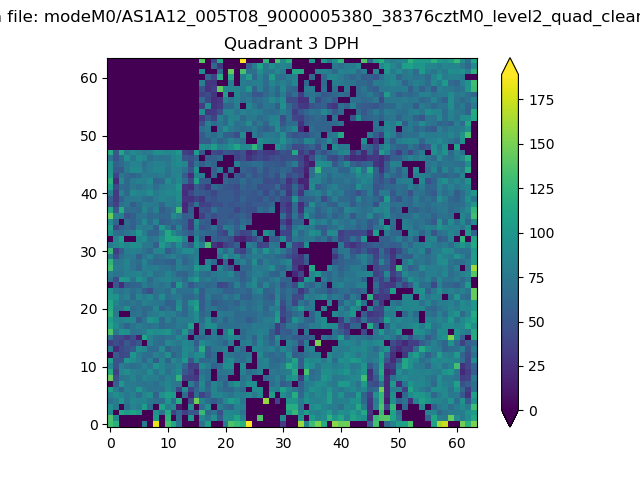 |
 |
Quadrant C |
| Plot type | Count rate plots | Images |
|---|---|---|
| Comparison with Poisson distribution Blue bars denote a histogram of data divided into 1 sec bins. Red curve is a Poisson curve with rate = median count rate of data. |
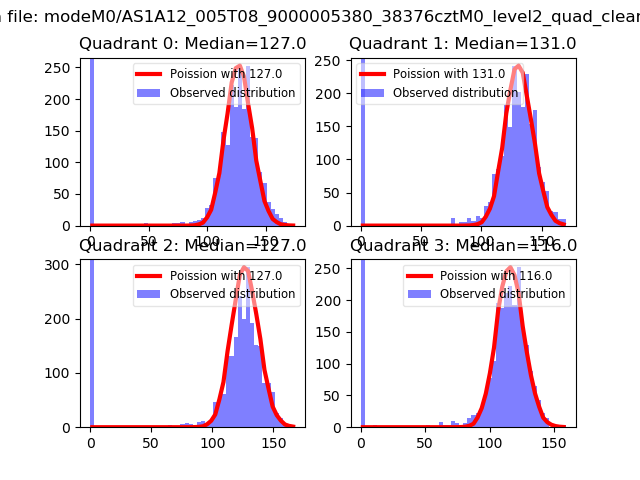 |
 |
| Quadrant-wise count rates Data is divided into 100 sec bins |
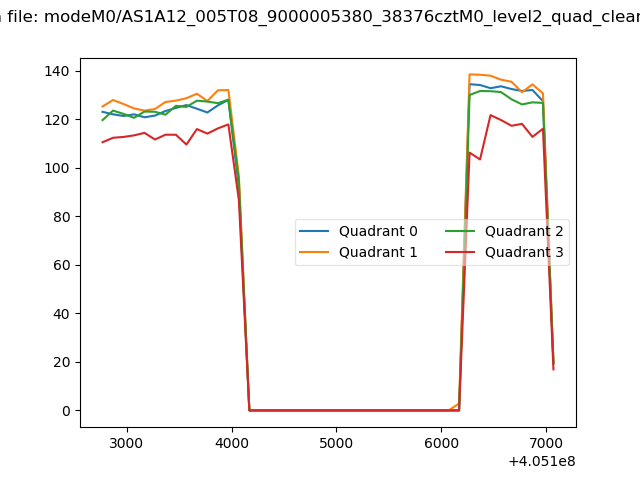 |
|
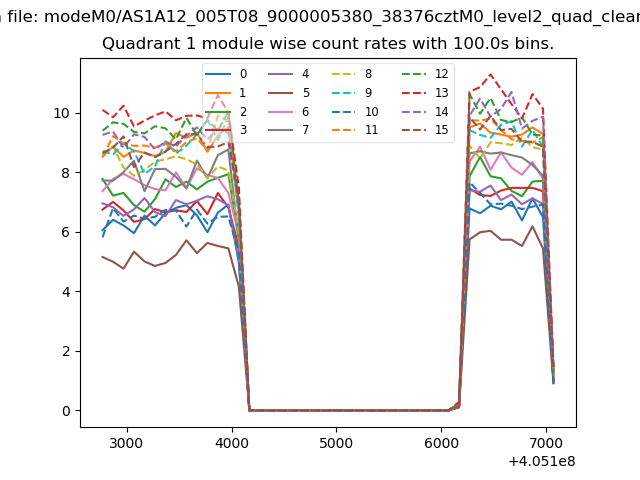
| Module-wise count rates for Quadrant A Data is divided into 100 sec bins |
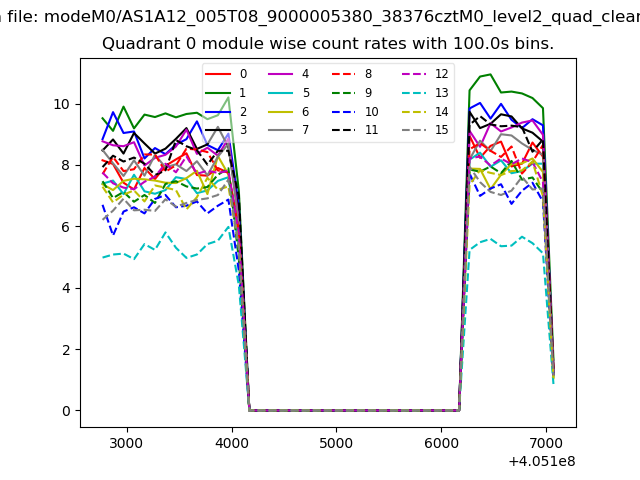 |
 |
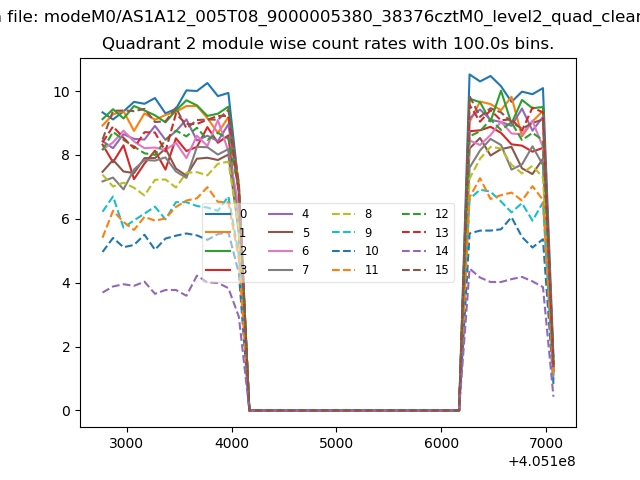
| Module-wise count rates for Quadrant B Data is divided into 100 sec bins |
 |
 |
| Module-wise count rates for Quadrant C Data is divided into 100 sec bins |
 |
 |
| Module-wise count rates for Quadrant D Data is divided into 100 sec bins |
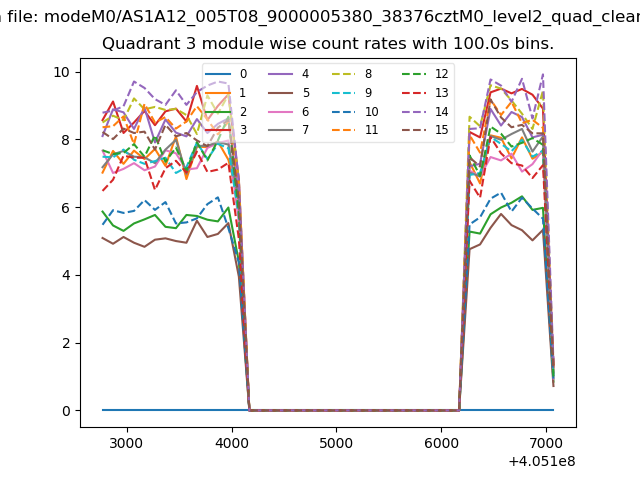 |
 |
| Parameter | Plot |
|---|---|
| CZT HV Monitor | 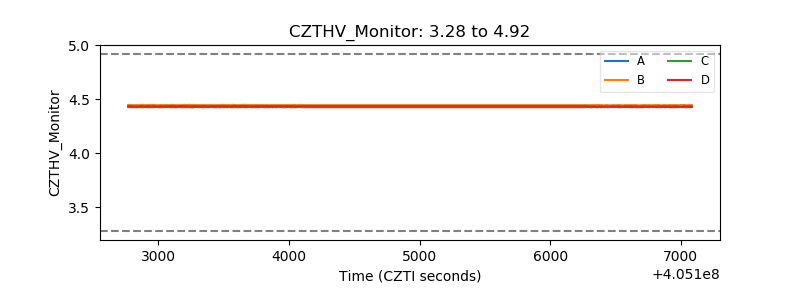 |
| D_VDD | 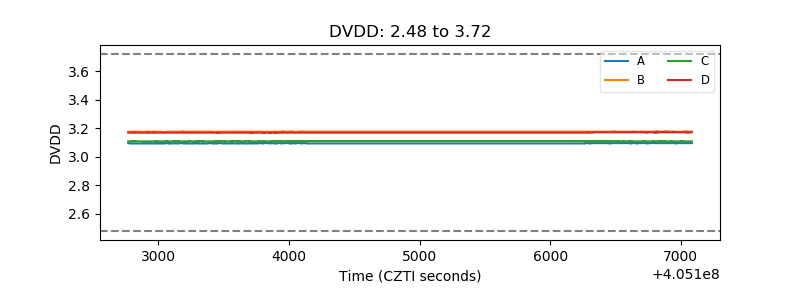 |
| Temperature 1 | 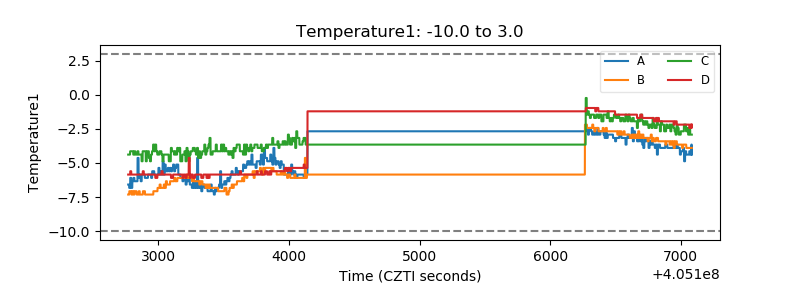 |
| Veto HV Monitor |  |
| Veto LLD | 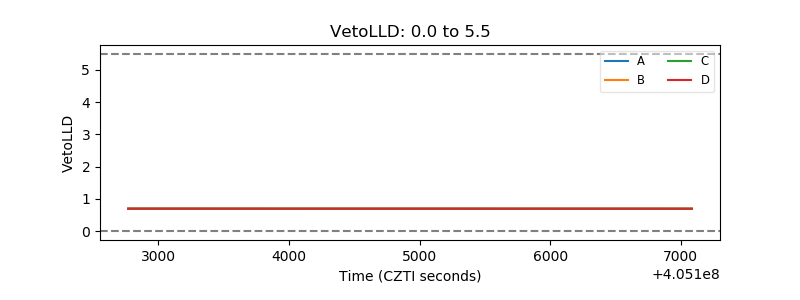 |
| Alpha Counter | 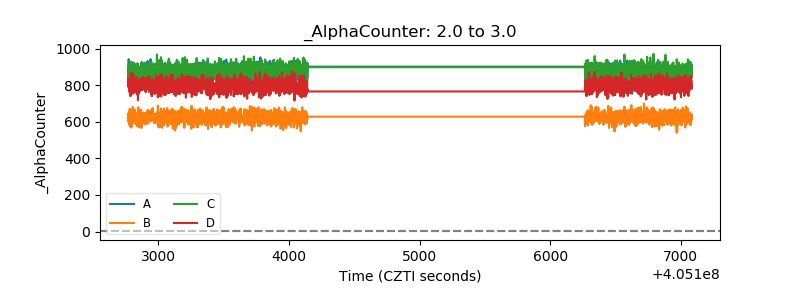 |
| _CPM_Rate | 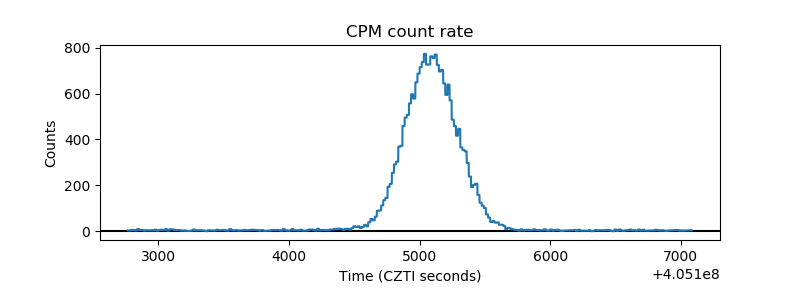 |
| CZT Counter | 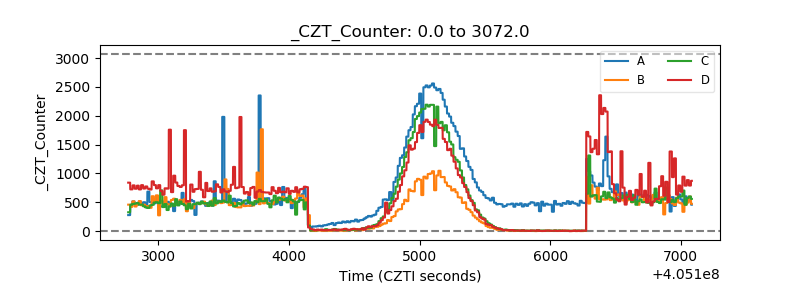 |
| +2.5 Volts monitor | 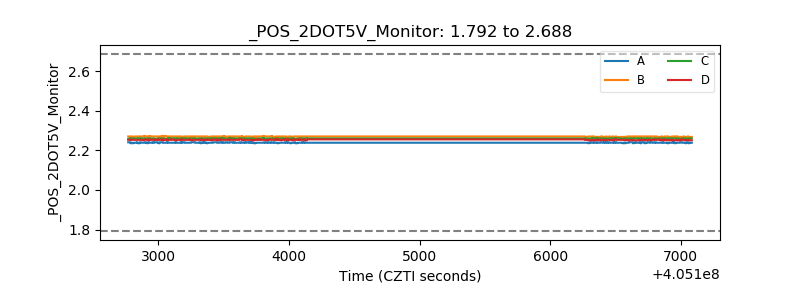 |
| +5 Volts monitor | 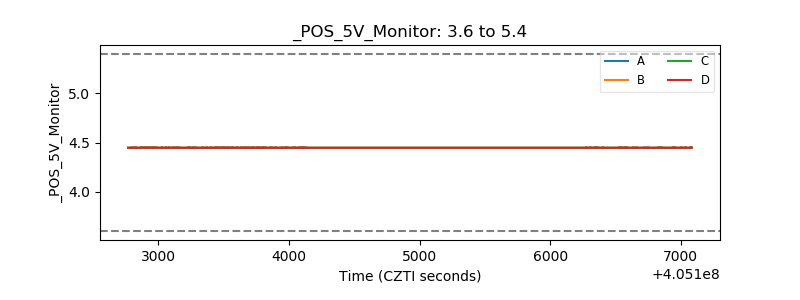 |
| _ROLL_ROT | 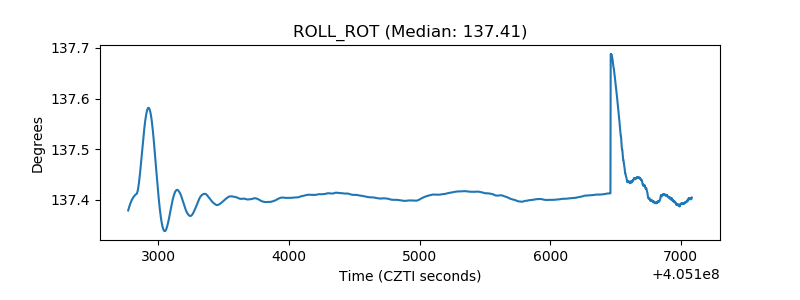 |
| _Roll_DEC | 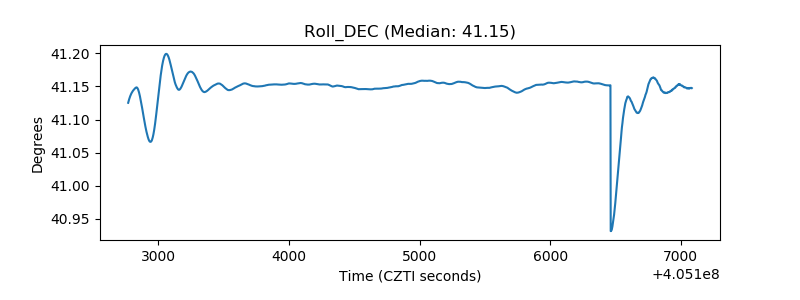 |
| _Roll_RA | 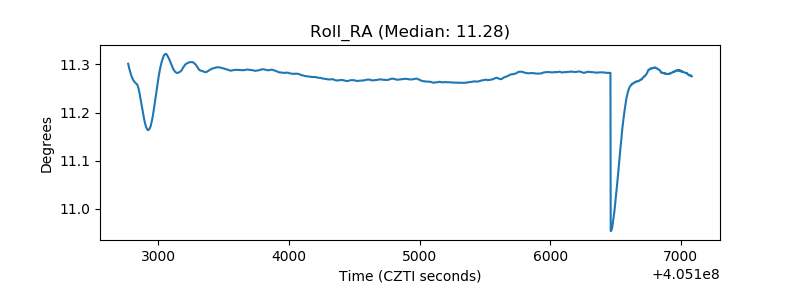 |
| Veto Counter | 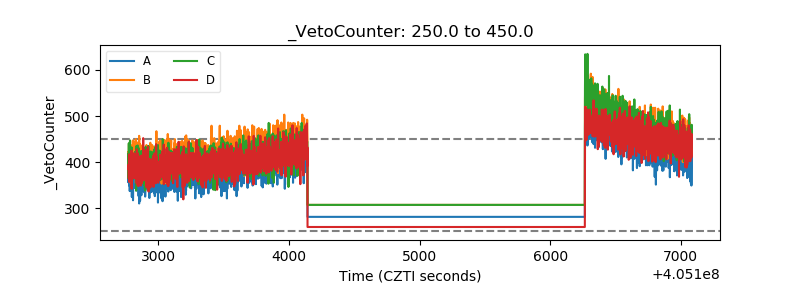 |