| Param | Original file | Final file |
|---|---|---|
| Filename | modeM0/AS1A12_005T08_9000005380_38377cztM0_level2.fits | modeM0/AS1A12_005T08_9000005380_38377cztM0_level2_quad_clean.evt |
| Size (bytes) | 354,297,600 | 89,856,000 |
| Size | 337.9 MB | 85.7 MB |
| Events in quadrant A | 2,755,683 | 609,883 |
| Events in quadrant B | 2,604,909 | 621,347 |
| Events in quadrant C | 2,630,552 | 604,445 |
| Events in quadrant D | 4,732,974 | 533,400 |
| Mode M0 | |||
|---|---|---|---|
| Quadrant | BADHDUFLAG | Total packets | Discarded packets |
| A | 0 | 11261 | 3 |
| B | 0 | 10878 | 2 |
| C | 0 | 10817 | 2 |
| D | 0 | 17552 | 2 |
| Mode M9 | |||
|---|---|---|---|
| Quadrant | BADHDUFLAG | Total packets | Discarded packets |
| A | 0 | 34 | 0 |
| B | 0 | 34 | 0 |
| C | 0 | 34 | 0 |
| D | 0 | 35 | 0 |
| Mode SS | |||
|---|---|---|---|
| Quadrant | BADHDUFLAG | Total packets | Discarded packets |
| A | 0 | 102 | 0 |
| B | 0 | 102 | 0 |
| C | 0 | 102 | 0 |
| D | 0 | 102 | 0 |
| Quadrant | Total seconds | Saturated seconds | Saturation percentage |
|---|---|---|---|
| A | 5021 | 23 | 0.458076% |
| B | 5021 | 21 | 0.418243% |
| C | 5021 | 31 | 0.617407% |
| D | 5021 | 333 | 6.632145% |
Noise dominated data is calculated using 1-second bins in cleaned event files. If a bin has >2000 counts, and if more than 50% of those come from <1% of pixels, then it is considered to be noise-dominated and hence unusable.
| Quadrant | # 1 sec bins | Bins with >0 counts | Bins with >2000 counts | High rate bins dominated by noise | Noise dominated (total time) | Noise dominated (detector-on time) | Marked lightcurve |
|---|---|---|---|---|---|---|---|
| A | 7084 | 5022 | 11 | 11 | 0.16% | 0.22% | 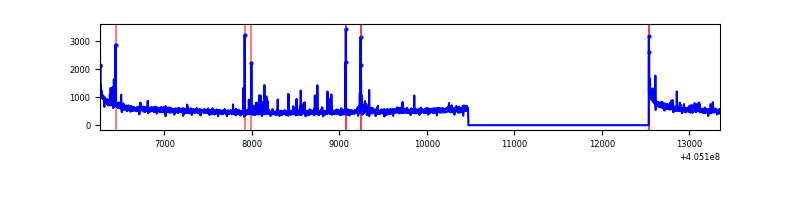 |
| B | 7084 | 5022 | 15 | 15 | 0.21% | 0.30% | 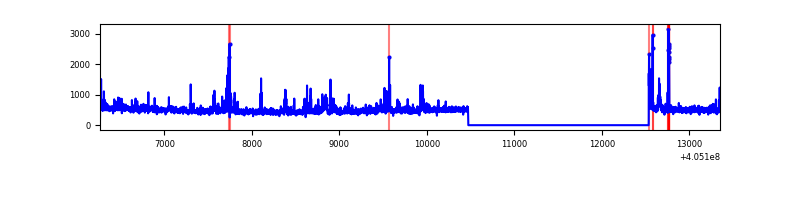 |
| C | 7084 | 5022 | 19 | 19 | 0.27% | 0.38% | 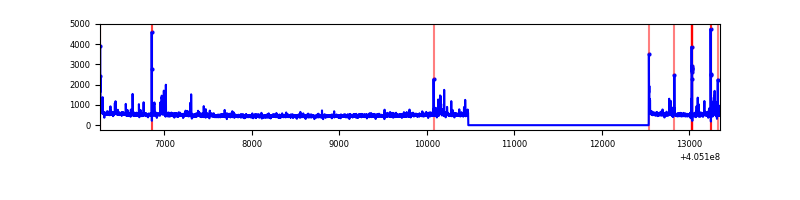 |
| D | 7084 | 5022 | 315 | 315 | 4.45% | 6.27% | 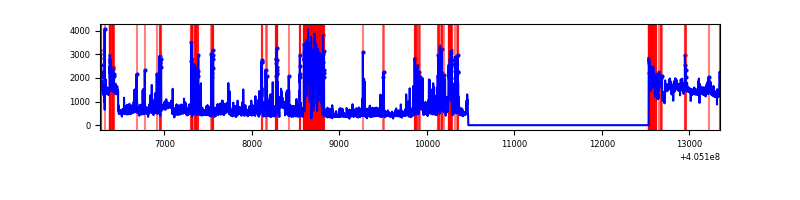 |
Top three noisy pixels from each quadrant. If the there are fewer than three noisy pixels in the level2.evt file, extra rows are filled as -1
| Pixel properties | Quadrant properties | ||||||
|---|---|---|---|---|---|---|---|
| Quadrant | DetID | PixID | Counts | Sigma | Mean | Median | Sigma |
| A | 10 | 83 | 383793 | 3293.68 | 575 | 564 | 116.4 |
| A | 9 | 143 | 91086 | 778.0 | 575 | 564 | 116.4 |
| A | 12 | 16 | 26229 | 220.58 | 575 | 564 | 116.4 |
| B | 0 | 183 | 164374 | 1470.73 | 575 | 560 | 111.4 |
| B | 4 | 171 | 28812 | 253.65 | 575 | 560 | 111.4 |
| B | 0 | 229 | 22797 | 199.64 | 575 | 560 | 111.4 |
| C | 15 | 214 | 213287 | 1615.19 | 567 | 574 | 131.7 |
| C | 14 | 254 | 123302 | 931.91 | 567 | 574 | 131.7 |
| C | 15 | 159 | 34381 | 256.71 | 567 | 574 | 131.7 |
| D | 10 | 203 | 769103 | 5724.06 | 552 | 538 | 134.3 |
| D | 12 | 227 | 634356 | 4720.5 | 552 | 538 | 134.3 |
| D | 12 | 235 | 301477 | 2241.31 | 552 | 538 | 134.3 |
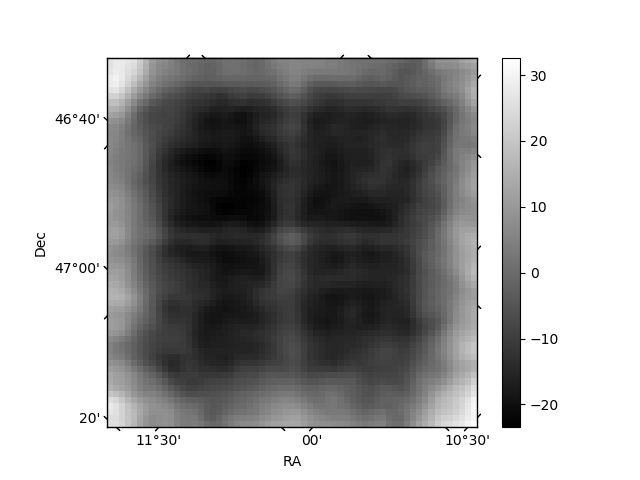
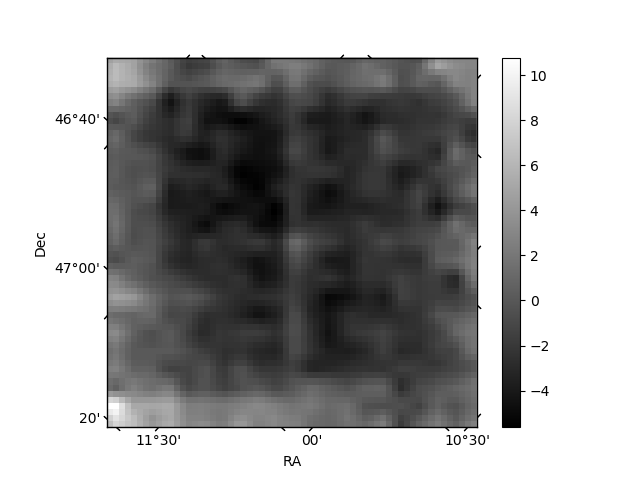
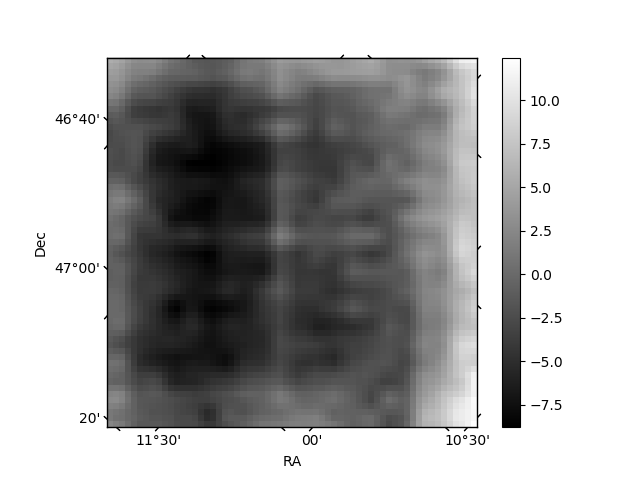
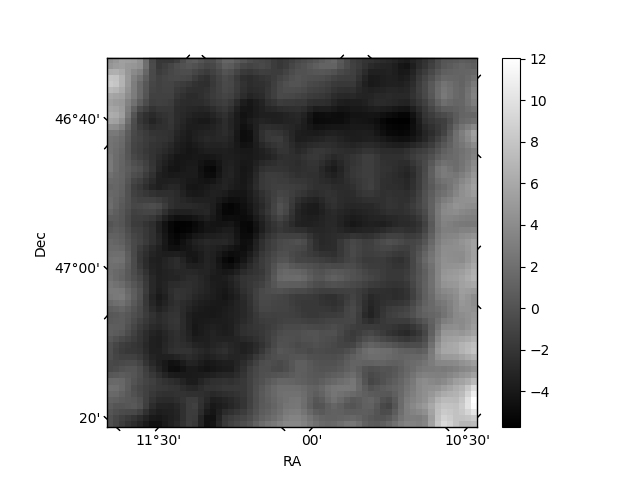
Histogram calculated using DETX and DETY for each event in the final _common_clean file
| Quadrant A | 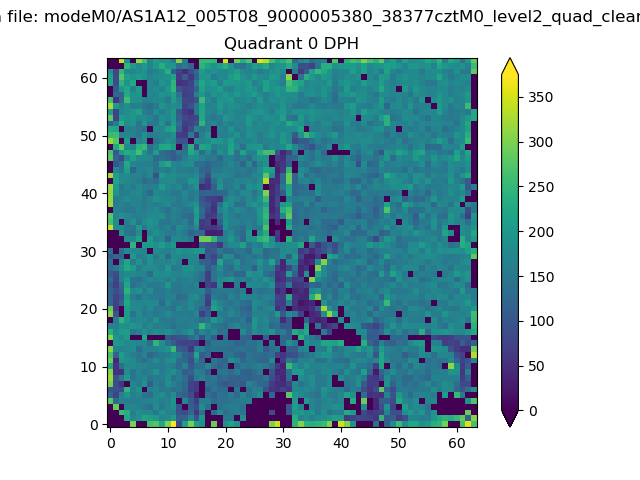 |
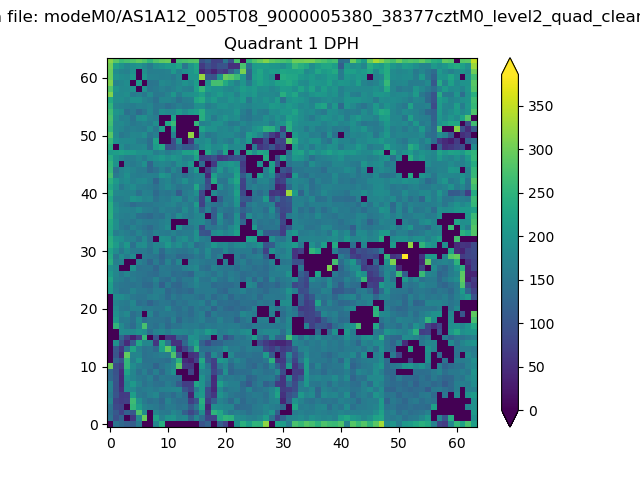 |
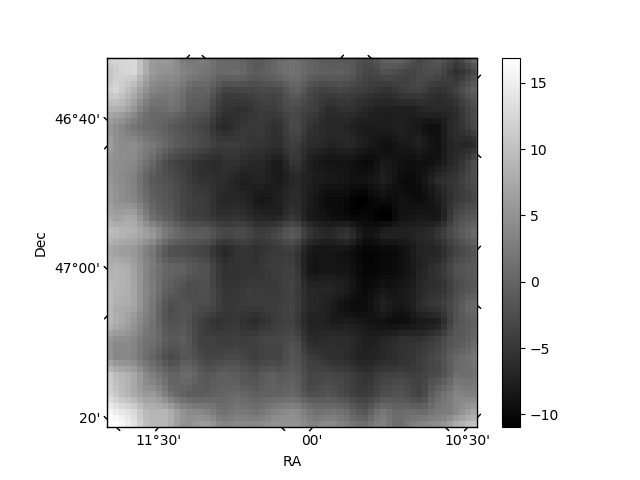
Quadrant B |
|---|---|---|---|
| Quadrant D | 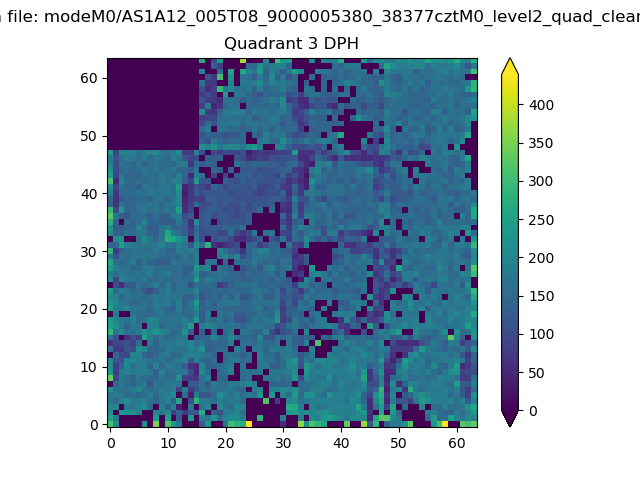 |
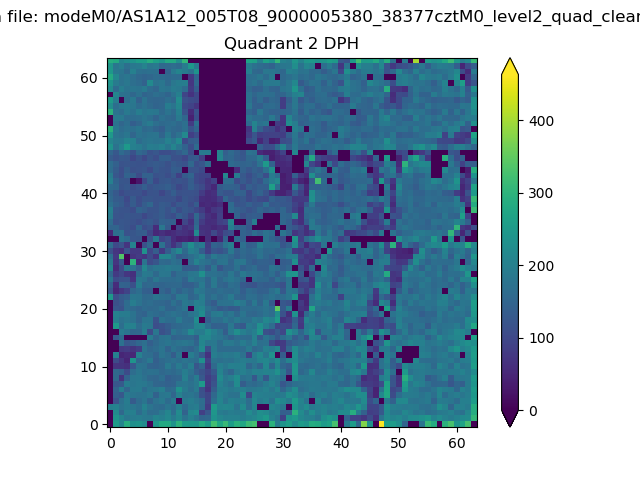 |
Quadrant C |
| Plot type | Count rate plots | Images |
|---|---|---|
| Comparison with Poisson distribution Blue bars denote a histogram of data divided into 1 sec bins. Red curve is a Poisson curve with rate = median count rate of data. |
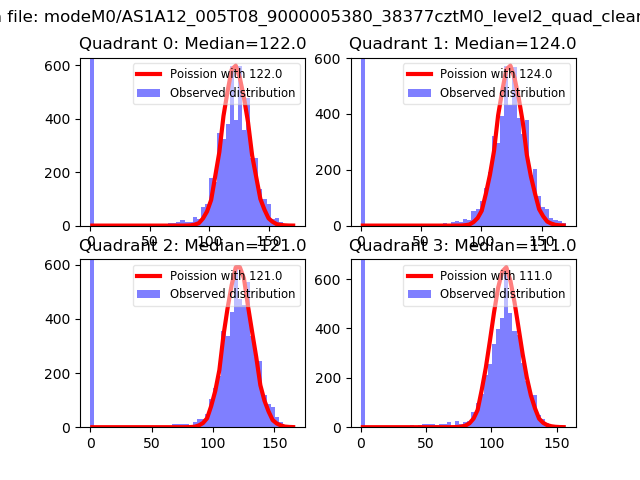 |
 |
| Quadrant-wise count rates Data is divided into 100 sec bins |
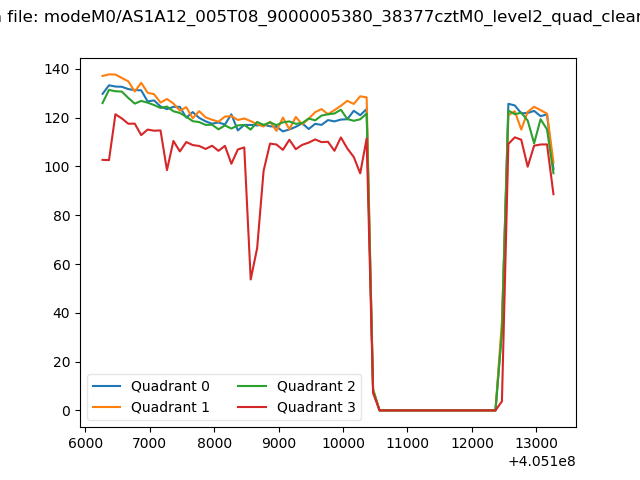 |
|
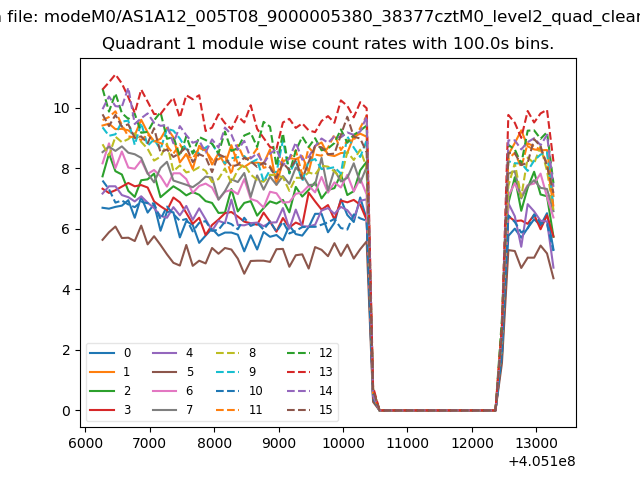
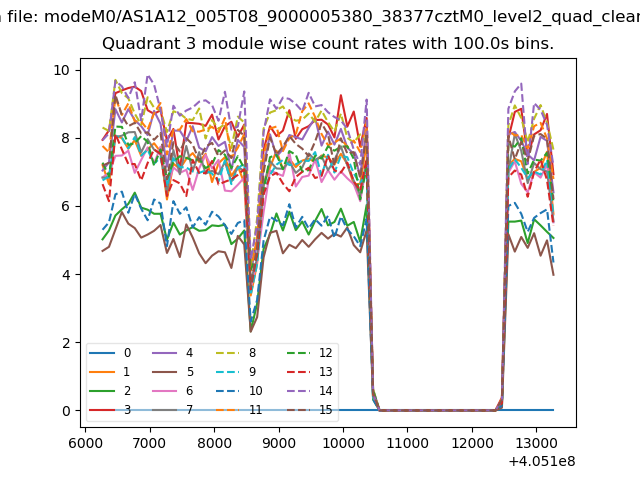
| Module-wise count rates for Quadrant A Data is divided into 100 sec bins |
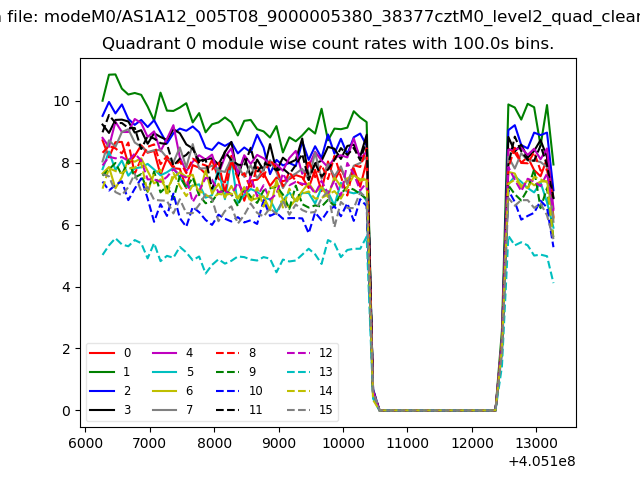 |
 |
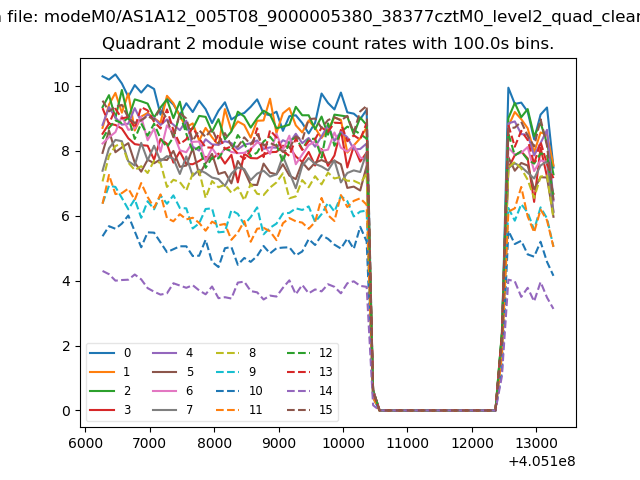
| Module-wise count rates for Quadrant B Data is divided into 100 sec bins |
 |
 |
| Module-wise count rates for Quadrant C Data is divided into 100 sec bins |
 |
 |
| Module-wise count rates for Quadrant D Data is divided into 100 sec bins |
 |
 |
| Parameter | Plot |
|---|---|
| CZT HV Monitor | 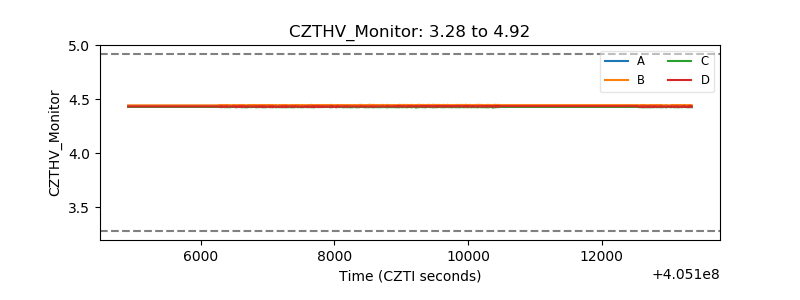 |
| D_VDD | 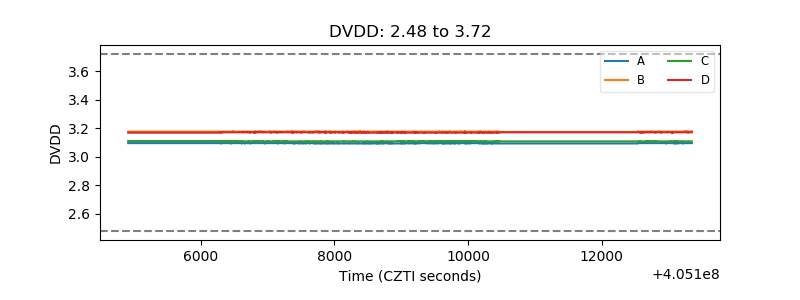 |
| Temperature 1 | 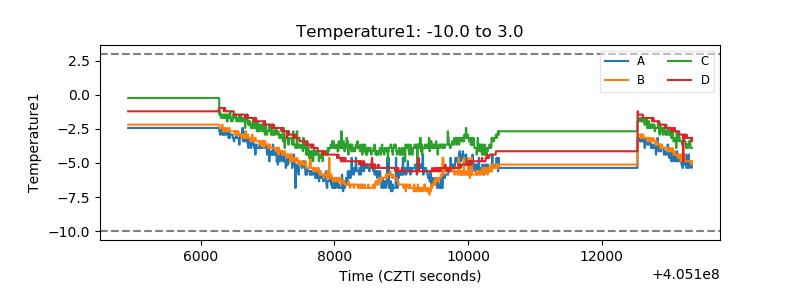 |
| Veto HV Monitor |  |
| Veto LLD | 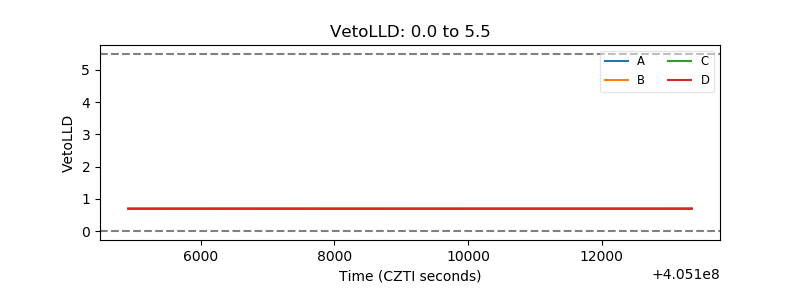 |
| Alpha Counter | 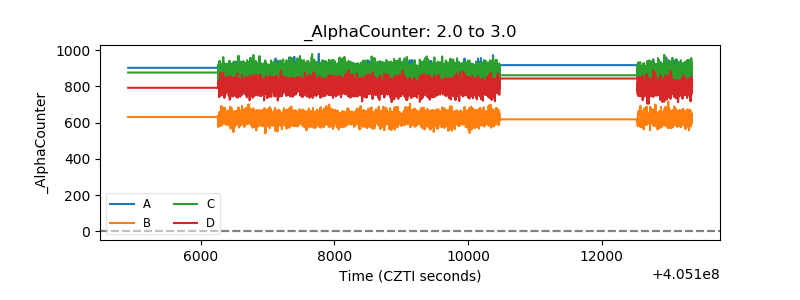 |
| _CPM_Rate | 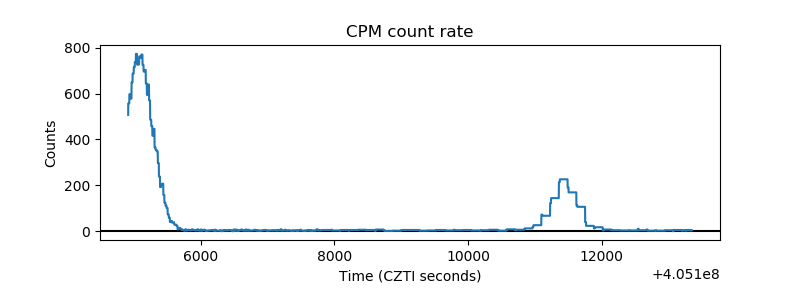 |
| CZT Counter | 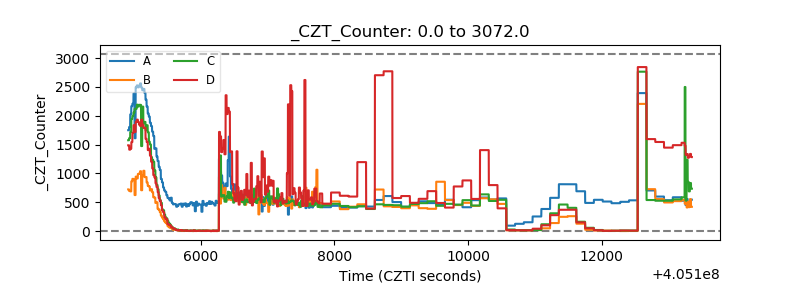 |
| +2.5 Volts monitor | 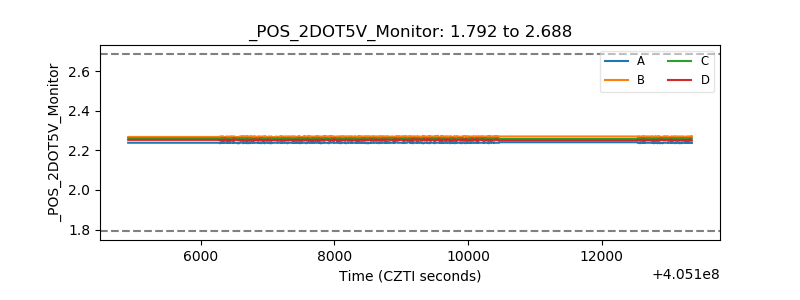 |
| +5 Volts monitor | 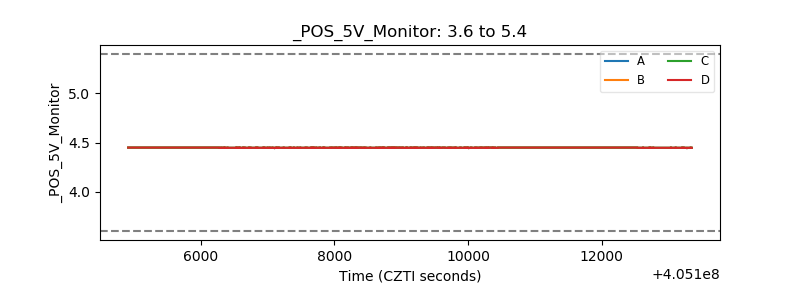 |
| _ROLL_ROT | 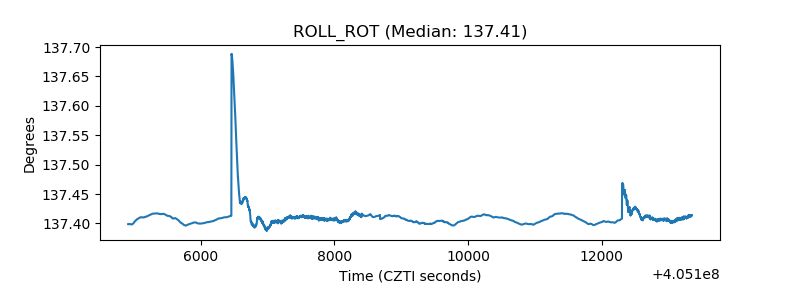 |
| _Roll_DEC | 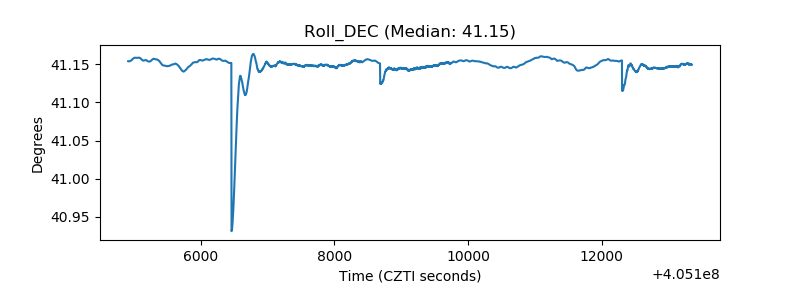 |
| _Roll_RA | 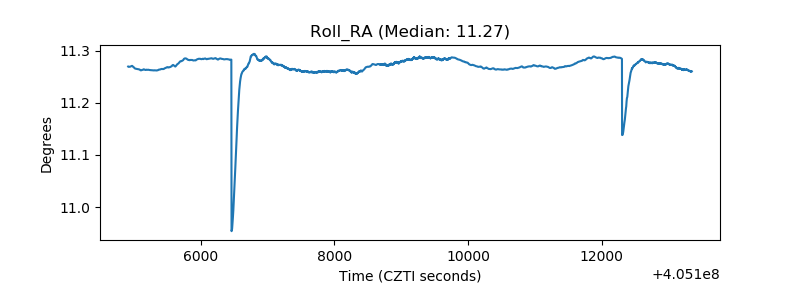 |
| Veto Counter | 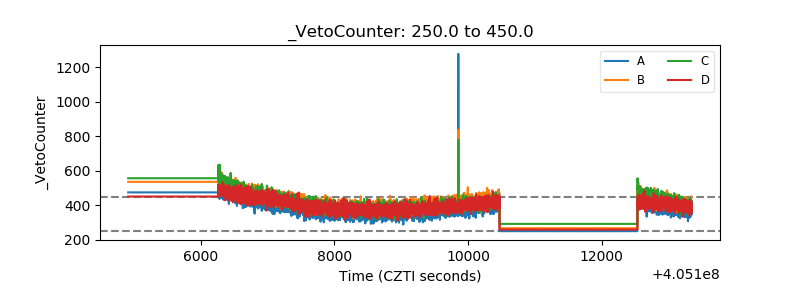 |