| Param | Original file | Final file |
|---|---|---|
| Filename | modeM0/AS1A12_005T08_9000005380_38378cztM0_level2.fits | modeM0/AS1A12_005T08_9000005380_38378cztM0_level2_quad_clean.evt |
| Size (bytes) | 386,392,320 | 90,256,320 |
| Size | 368.5 MB | 86.1 MB |
| Events in quadrant A | 2,827,306 | 605,942 |
| Events in quadrant B | 2,627,444 | 618,806 |
| Events in quadrant C | 2,713,079 | 600,008 |
| Events in quadrant D | 5,729,032 | 541,964 |
| Mode M0 | |||
|---|---|---|---|
| Quadrant | BADHDUFLAG | Total packets | Discarded packets |
| A | 0 | 11696 | 3 |
| B | 0 | 11166 | 2 |
| C | 0 | 11241 | 2 |
| D | 0 | 20714 | 2 |
| Mode M9 | |||
|---|---|---|---|
| Quadrant | BADHDUFLAG | Total packets | Discarded packets |
| A | 0 | 39 | 0 |
| B | 0 | 39 | 0 |
| C | 0 | 39 | 0 |
| D | 0 | 39 | 0 |
| Mode SS | |||
|---|---|---|---|
| Quadrant | BADHDUFLAG | Total packets | Discarded packets |
| A | 0 | 108 | 0 |
| B | 0 | 108 | 0 |
| C | 0 | 108 | 0 |
| D | 0 | 108 | 0 |
| Quadrant | Total seconds | Saturated seconds | Saturation percentage |
|---|---|---|---|
| A | 5229 | 33 | 0.631096% |
| B | 5229 | 22 | 0.420731% |
| C | 5229 | 36 | 0.688468% |
| D | 5229 | 155 | 2.964238% |
Noise dominated data is calculated using 1-second bins in cleaned event files. If a bin has >2000 counts, and if more than 50% of those come from <1% of pixels, then it is considered to be noise-dominated and hence unusable.
| Quadrant | # 1 sec bins | Bins with >0 counts | Bins with >2000 counts | High rate bins dominated by noise | Noise dominated (total time) | Noise dominated (detector-on time) | Marked lightcurve |
|---|---|---|---|---|---|---|---|
| A | 9115 | 5231 | 15 | 15 | 0.16% | 0.29% | 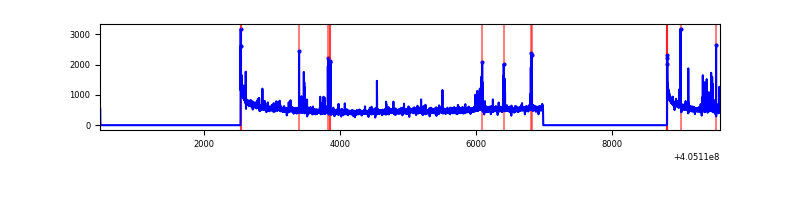 |
| B | 9115 | 5231 | 12 | 12 | 0.13% | 0.23% | 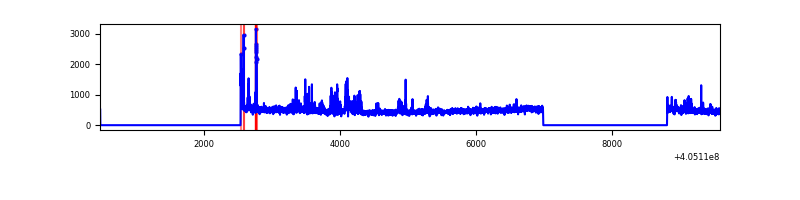 |
| C | 9115 | 5231 | 30 | 30 | 0.33% | 0.57% | 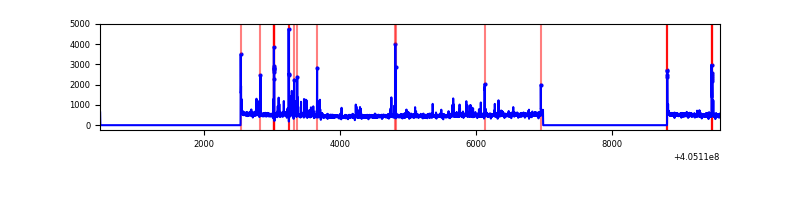 |
| D | 9115 | 5231 | 124 | 124 | 1.36% | 2.37% | 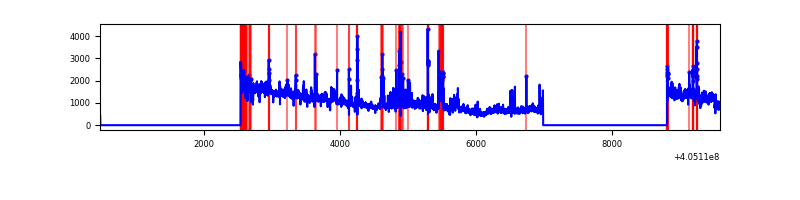 |
Top three noisy pixels from each quadrant. If the there are fewer than three noisy pixels in the level2.evt file, extra rows are filled as -1
| Pixel properties | Quadrant properties | ||||||
|---|---|---|---|---|---|---|---|
| Quadrant | DetID | PixID | Counts | Sigma | Mean | Median | Sigma |
| A | 10 | 83 | 383451 | 3244.19 | 583 | 571 | 118.0 |
| A | 9 | 143 | 128257 | 1081.9 | 583 | 571 | 118.0 |
| A | 12 | 16 | 24439 | 202.24 | 583 | 571 | 118.0 |
| B | 0 | 183 | 204918 | 1826.33 | 582 | 566 | 111.9 |
| B | 0 | 230 | 28692 | 251.37 | 582 | 566 | 111.9 |
| B | 5 | 184 | 16880 | 145.8 | 582 | 566 | 111.9 |
| C | 15 | 214 | 221148 | 1655.52 | 574 | 578 | 133.2 |
| C | 14 | 254 | 191959 | 1436.44 | 574 | 578 | 133.2 |
| C | 0 | 10 | 32979 | 243.19 | 574 | 578 | 133.2 |
| D | 10 | 203 | 1869711 | 13615.72 | 563 | 549 | 137.3 |
| D | 2 | 16 | 601517 | 4377.69 | 563 | 549 | 137.3 |
| D | 12 | 235 | 437178 | 3180.58 | 563 | 549 | 137.3 |
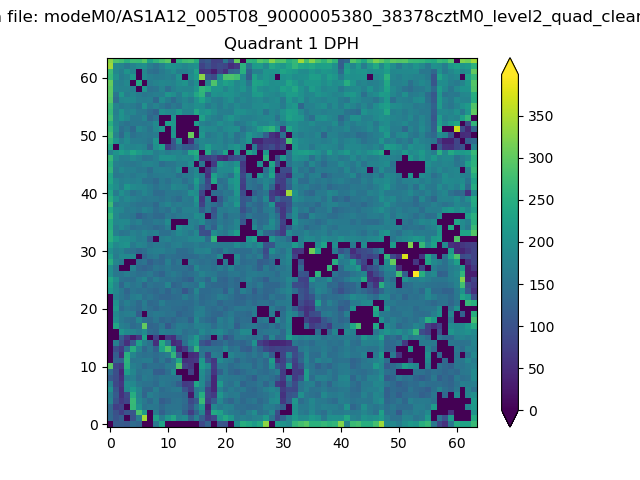
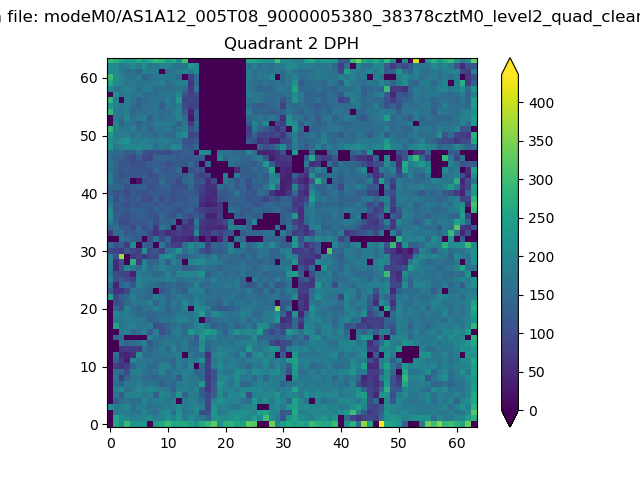
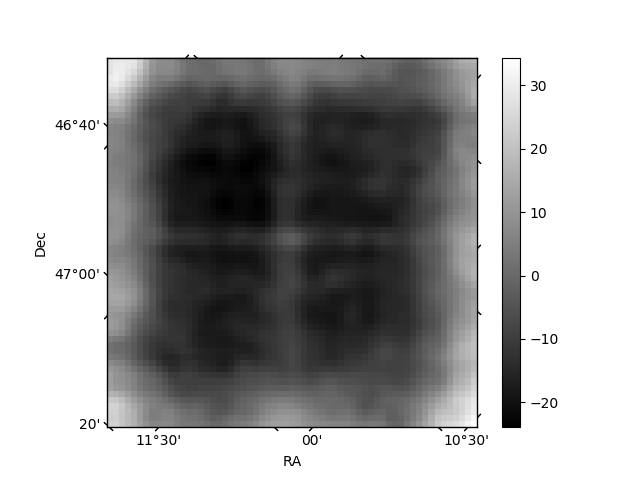
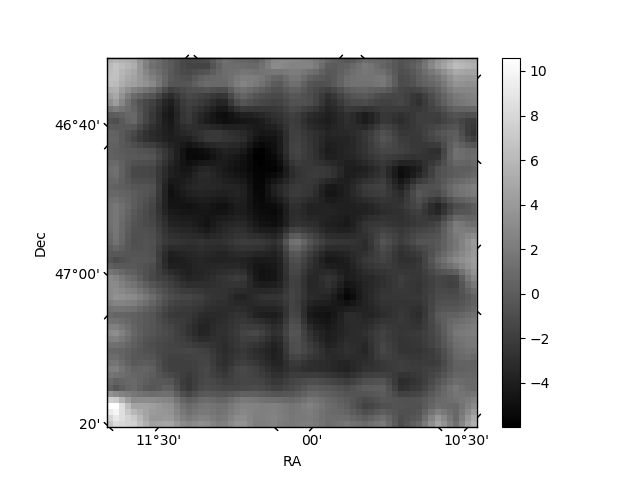
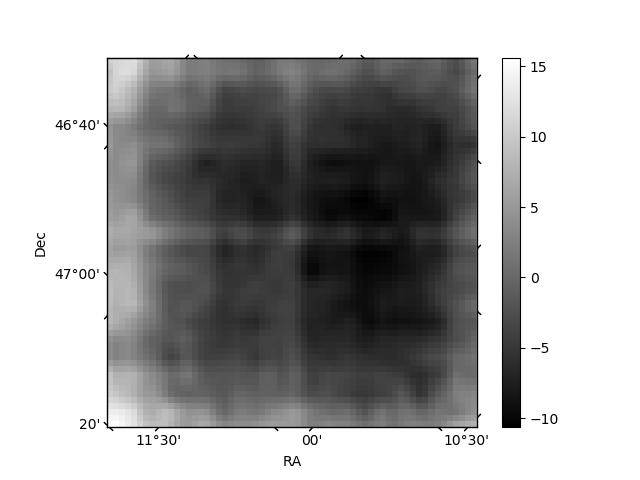
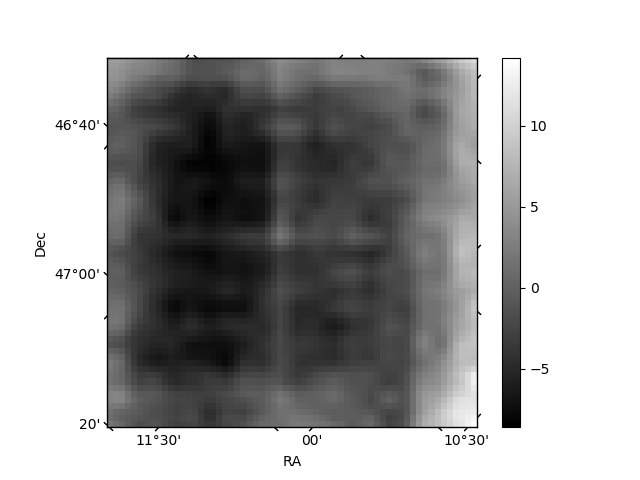
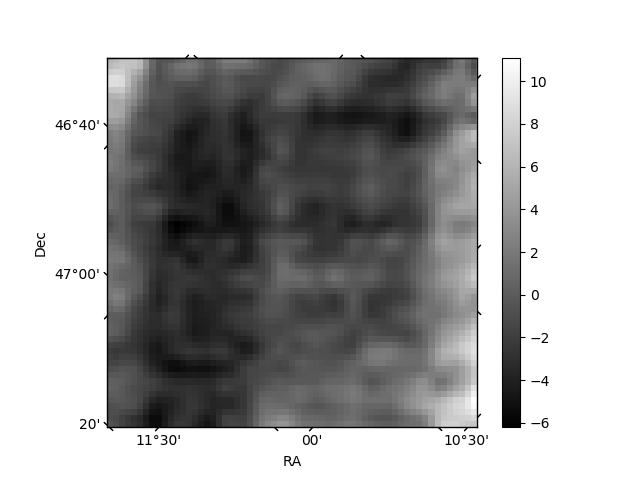
Histogram calculated using DETX and DETY for each event in the final _common_clean file
| Quadrant A |  |
 |
Quadrant B |
|---|---|---|---|
| Quadrant D | 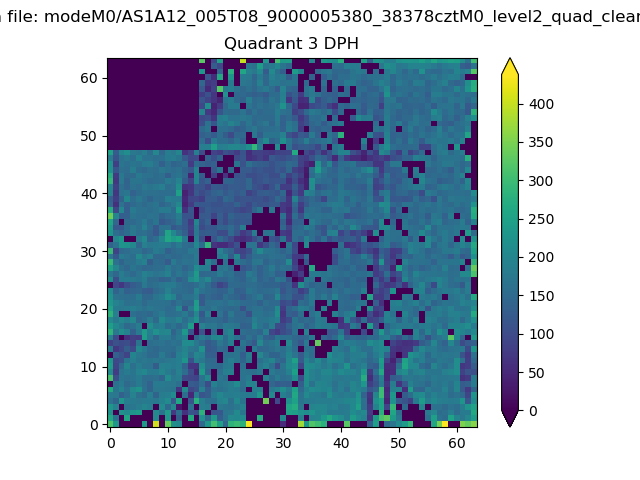 |
 |
Quadrant C |
| Plot type | Count rate plots | Images |
|---|---|---|
| Comparison with Poisson distribution Blue bars denote a histogram of data divided into 1 sec bins. Red curve is a Poisson curve with rate = median count rate of data. |
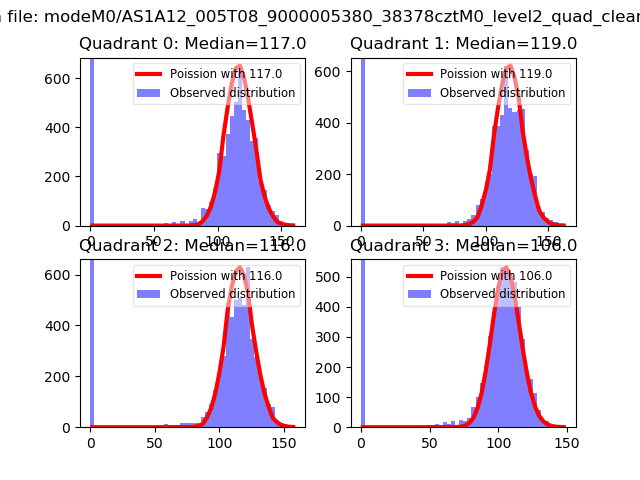 |
 |
| Quadrant-wise count rates Data is divided into 100 sec bins |
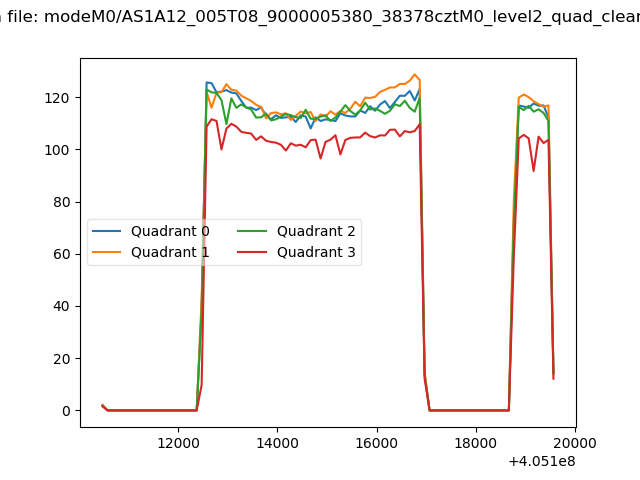 |
|
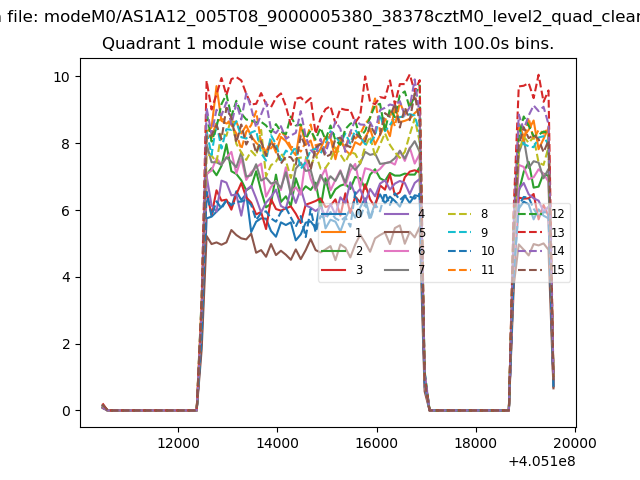
| Module-wise count rates for Quadrant A Data is divided into 100 sec bins |
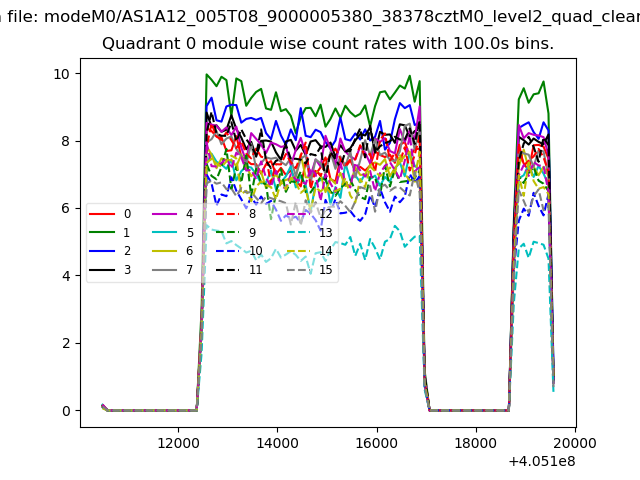 |
 |
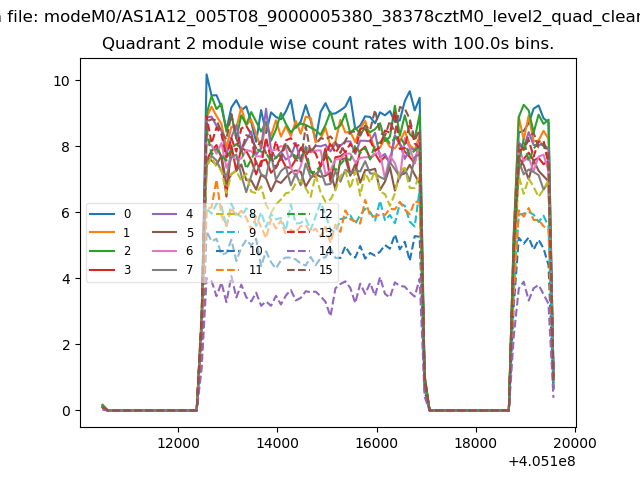
| Module-wise count rates for Quadrant B Data is divided into 100 sec bins |
 |
 |
| Module-wise count rates for Quadrant C Data is divided into 100 sec bins |
 |
 |
| Module-wise count rates for Quadrant D Data is divided into 100 sec bins |
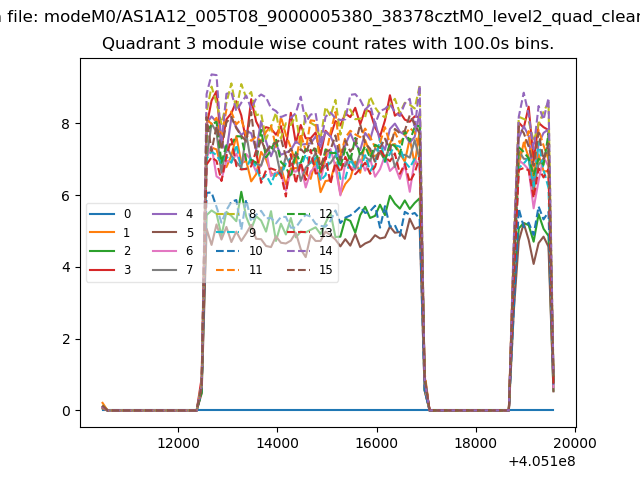 |
 |
| Parameter | Plot |
|---|---|
| CZT HV Monitor | 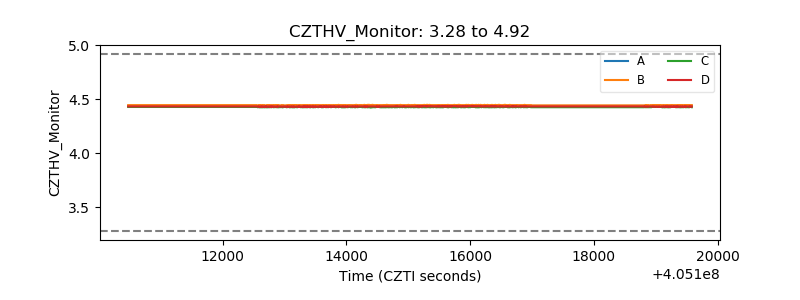 |
| D_VDD | 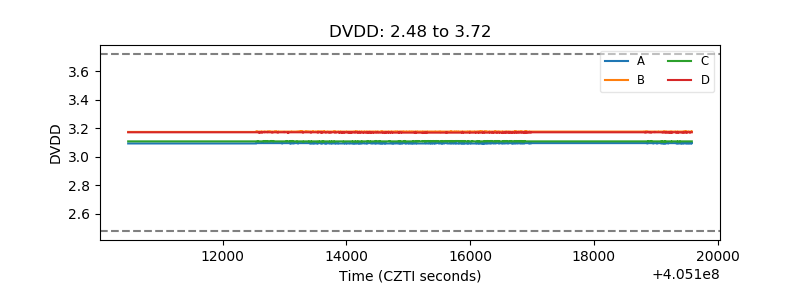 |
| Temperature 1 | 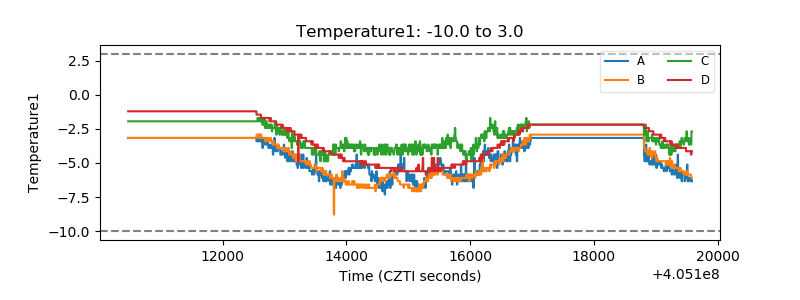 |
| Veto HV Monitor | 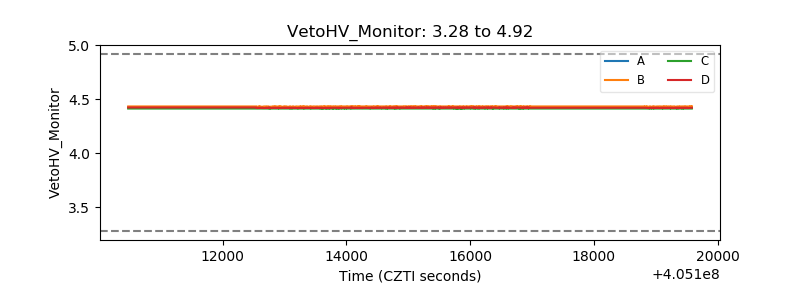 |
| Veto LLD | 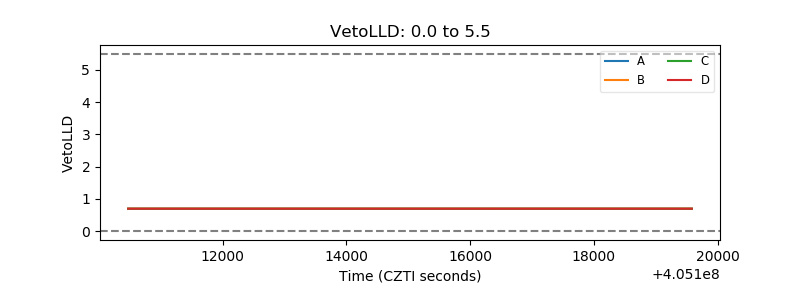 |
| Alpha Counter | 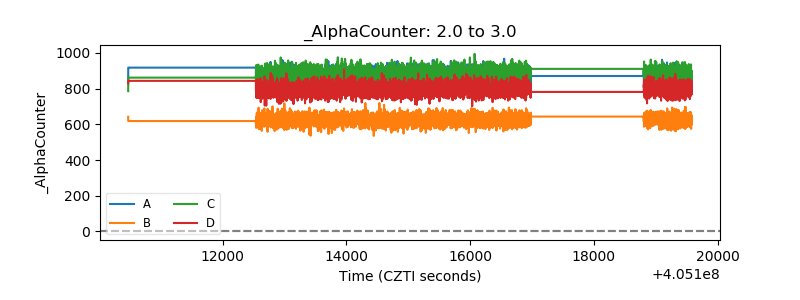 |
| _CPM_Rate | 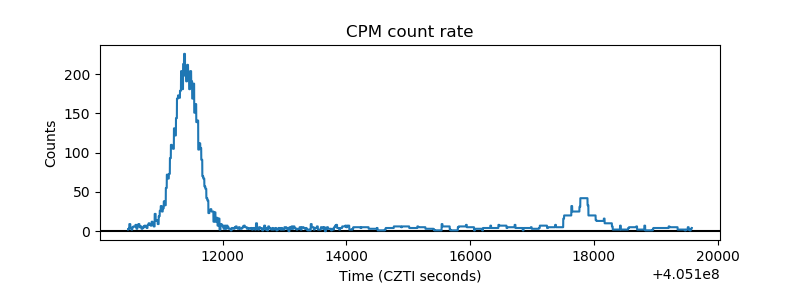 |
| CZT Counter | 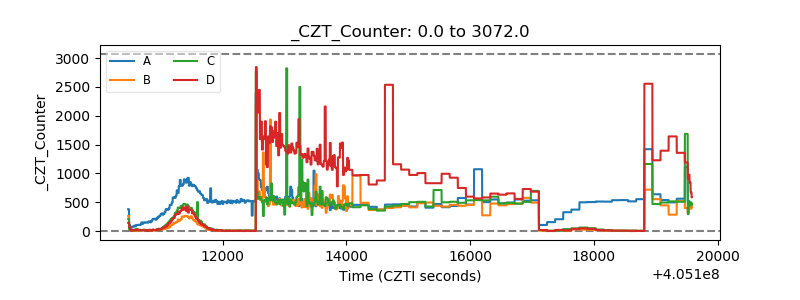 |
| +2.5 Volts monitor | 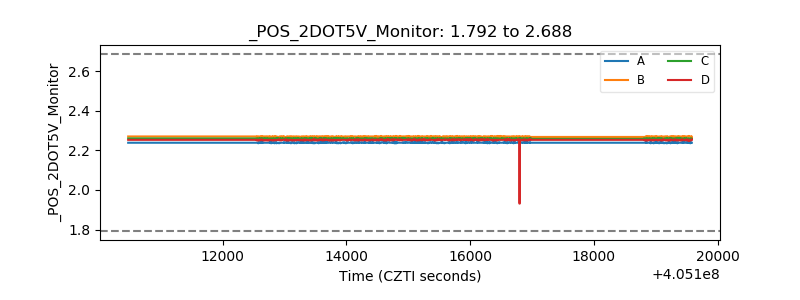 |
| +5 Volts monitor | 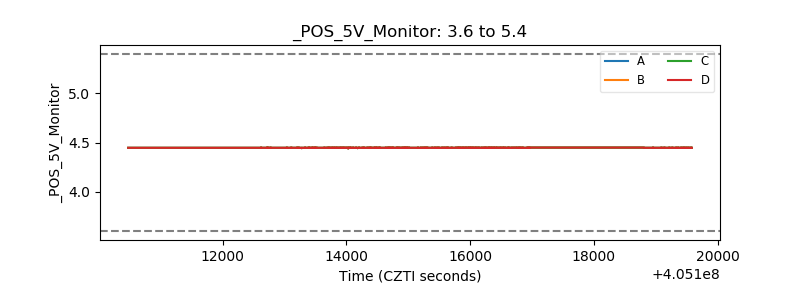 |
| _ROLL_ROT | 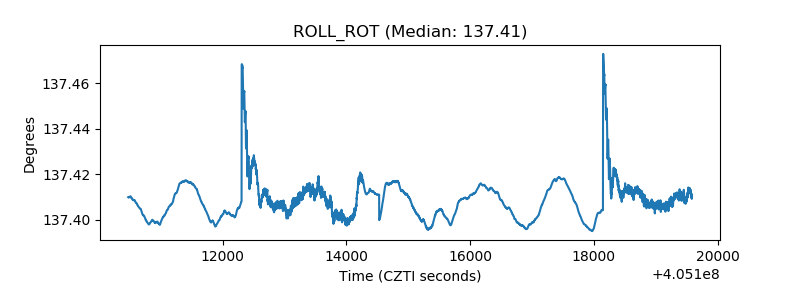 |
| _Roll_DEC | 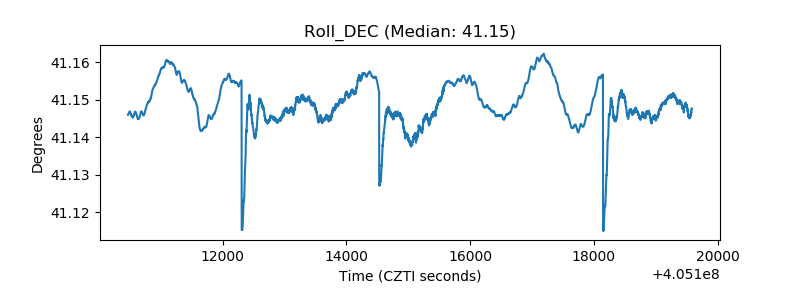 |
| _Roll_RA | 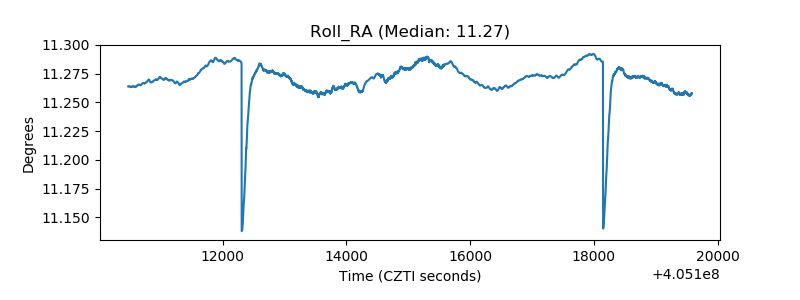 |
| Veto Counter | 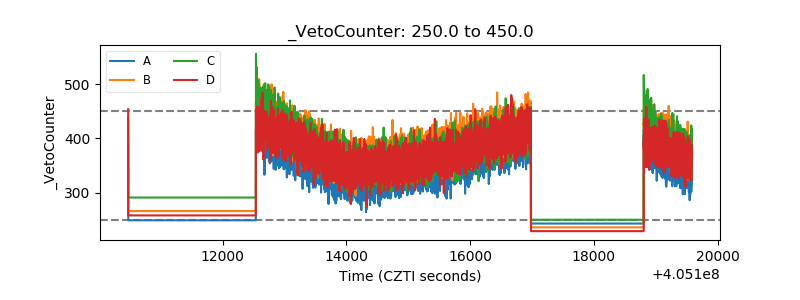 |