| Param | Original file | Final file |
|---|---|---|
| Filename | modeM0/AS1A12_005T08_9000005380_38379cztM0_level2.fits | modeM0/AS1A12_005T08_9000005380_38379cztM0_level2_quad_clean.evt |
| Size (bytes) | 375,338,880 | 94,512,960 |
| Size | 358.0 MB | 90.1 MB |
| Events in quadrant A | 3,062,860 | 639,069 |
| Events in quadrant B | 2,701,067 | 654,055 |
| Events in quadrant C | 2,914,709 | 630,399 |
| Events in quadrant D | 4,774,976 | 542,510 |
| Mode M0 | |||
|---|---|---|---|
| Quadrant | BADHDUFLAG | Total packets | Discarded packets |
| A | 0 | 12757 | 3 |
| B | 0 | 11790 | 2 |
| C | 0 | 12216 | 2 |
| D | 0 | 18007 | 2 |
| Mode M9 | |||
|---|---|---|---|
| Quadrant | BADHDUFLAG | Total packets | Discarded packets |
| A | 0 | 26 | 0 |
| B | 0 | 26 | 0 |
| C | 0 | 26 | 0 |
| D | 0 | 27 | 0 |
| Mode SS | |||
|---|---|---|---|
| Quadrant | BADHDUFLAG | Total packets | Discarded packets |
| A | 0 | 116 | 0 |
| B | 0 | 116 | 0 |
| C | 0 | 116 | 0 |
| D | 0 | 116 | 0 |
| Quadrant | Total seconds | Saturated seconds | Saturation percentage |
|---|---|---|---|
| A | 5657 | 22 | 0.388899% |
| B | 5657 | 10 | 0.176772% |
| C | 5657 | 48 | 0.848506% |
| D | 5657 | 405 | 7.159272% |
Noise dominated data is calculated using 1-second bins in cleaned event files. If a bin has >2000 counts, and if more than 50% of those come from <1% of pixels, then it is considered to be noise-dominated and hence unusable.
| Quadrant | # 1 sec bins | Bins with >0 counts | Bins with >2000 counts | High rate bins dominated by noise | Noise dominated (total time) | Noise dominated (detector-on time) | Marked lightcurve |
|---|---|---|---|---|---|---|---|
| A | 7150 | 5658 | 12 | 12 | 0.17% | 0.21% | 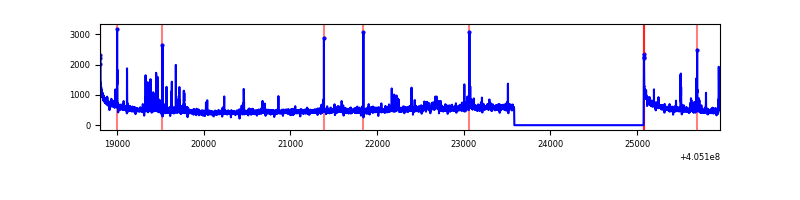 |
| B | 7150 | 5658 | 4 | 4 | 0.06% | 0.07% | 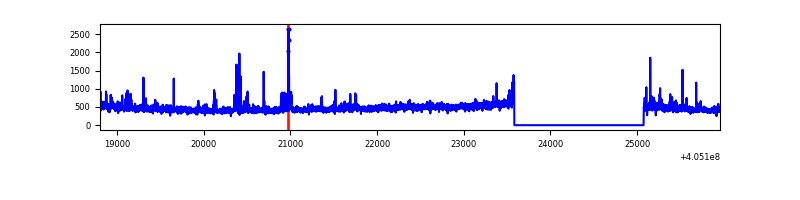 |
| C | 7150 | 5658 | 40 | 40 | 0.56% | 0.71% | 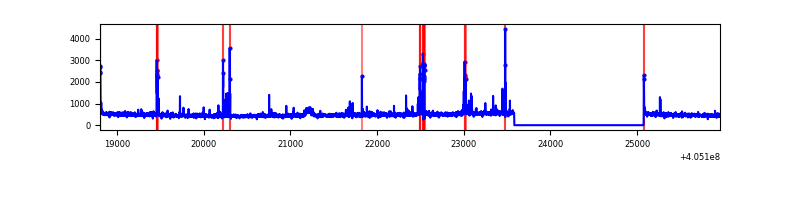 |
| D | 7150 | 5658 | 314 | 314 | 4.39% | 5.55% | 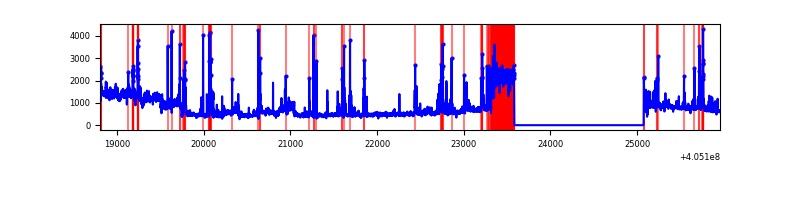 |
Top three noisy pixels from each quadrant. If the there are fewer than three noisy pixels in the level2.evt file, extra rows are filled as -1
| Pixel properties | Quadrant properties | ||||||
|---|---|---|---|---|---|---|---|
| Quadrant | DetID | PixID | Counts | Sigma | Mean | Median | Sigma |
| A | 10 | 83 | 401338 | 3127.04 | 628 | 614 | 128.1 |
| A | 9 | 143 | 116507 | 904.37 | 628 | 614 | 128.1 |
| A | 12 | 16 | 58818 | 454.19 | 628 | 614 | 128.1 |
| B | 0 | 183 | 112364 | 919.74 | 627 | 610 | 121.5 |
| B | 4 | 171 | 35083 | 283.71 | 627 | 610 | 121.5 |
| B | 0 | 229 | 19306 | 153.87 | 627 | 610 | 121.5 |
| C | 15 | 214 | 236219 | 1630.56 | 617 | 622 | 144.5 |
| C | 14 | 254 | 216119 | 1491.45 | 617 | 622 | 144.5 |
| C | 0 | 10 | 24714 | 166.74 | 617 | 622 | 144.5 |
| D | 10 | 203 | 1217234 | 8278.13 | 599 | 583 | 147.0 |
| D | 2 | 16 | 463542 | 3149.99 | 599 | 583 | 147.0 |
| D | 13 | 249 | 159968 | 1084.46 | 599 | 583 | 147.0 |
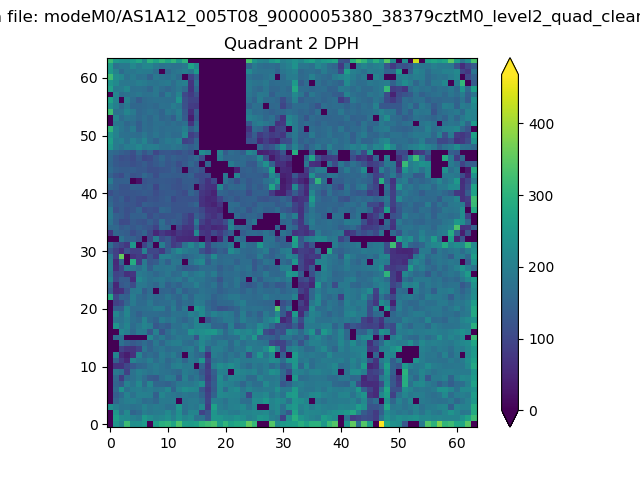
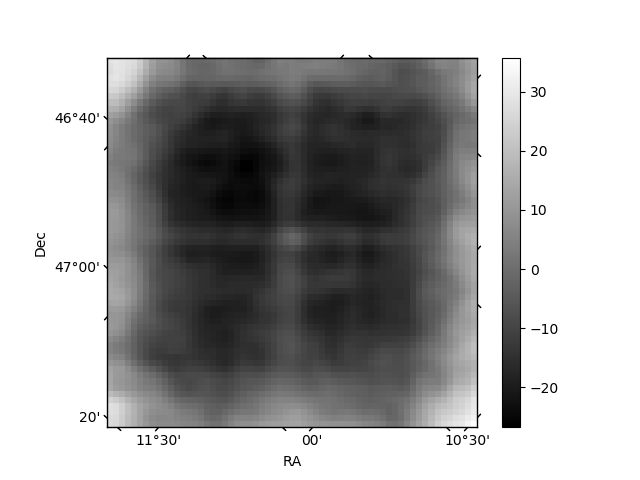
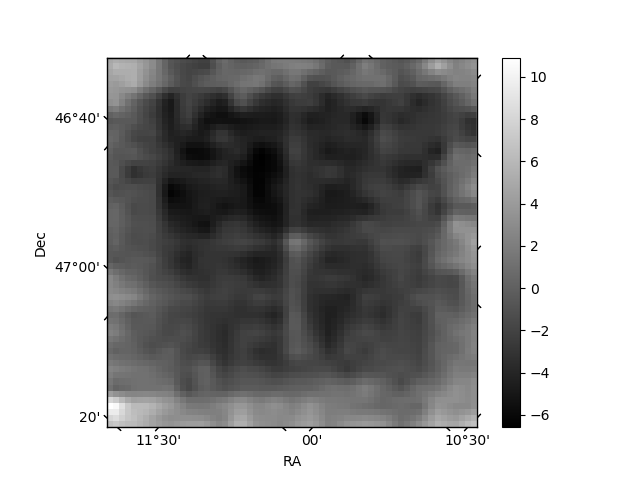
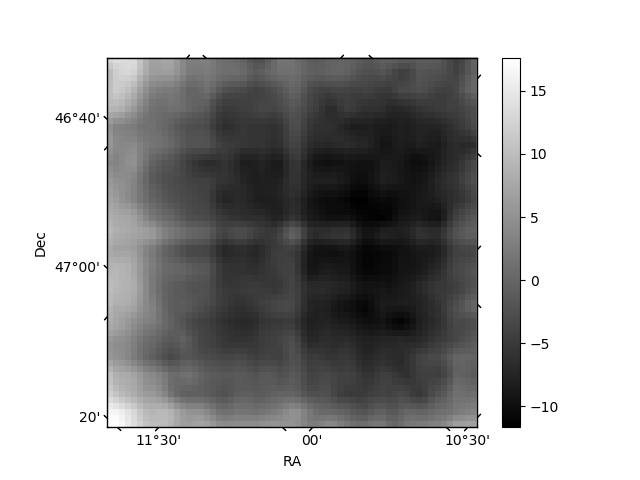
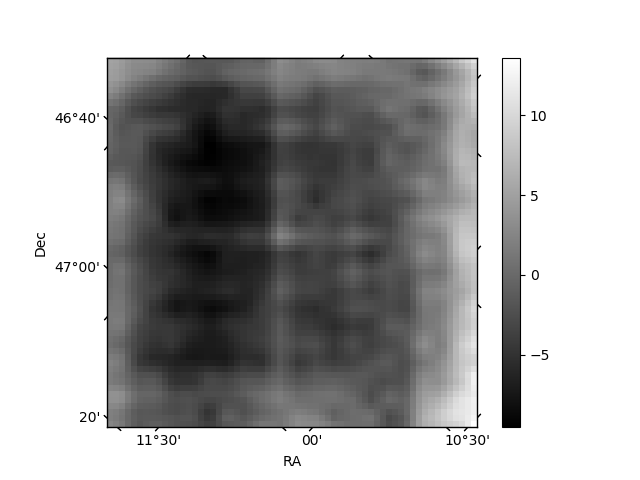
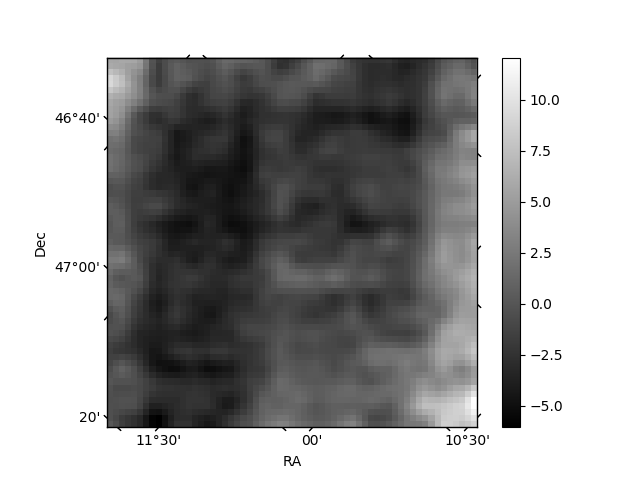
Histogram calculated using DETX and DETY for each event in the final _common_clean file
| Quadrant A | 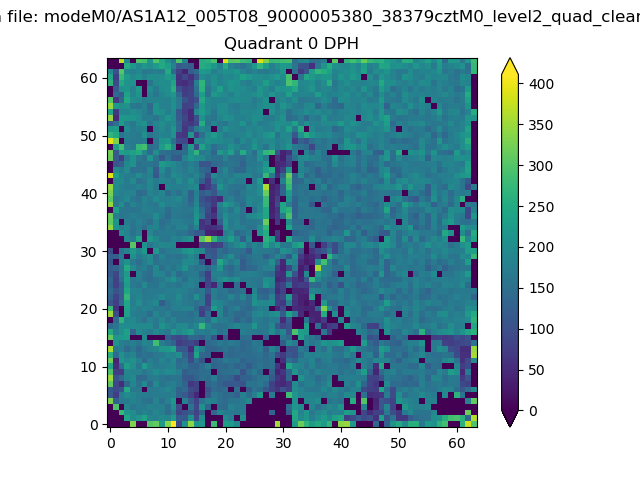 |
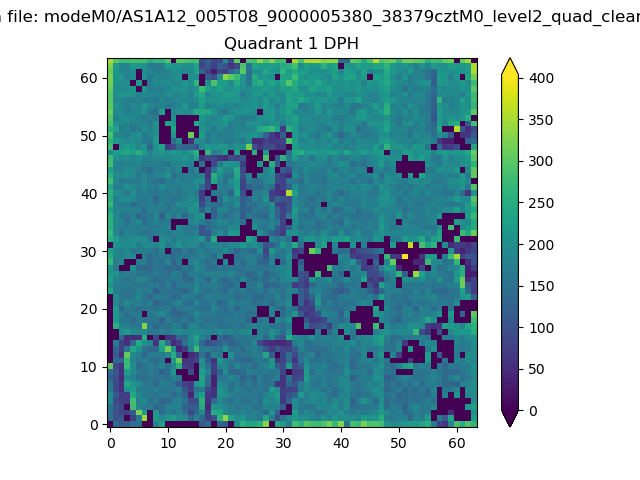 |
Quadrant B |
|---|---|---|---|
| Quadrant D | 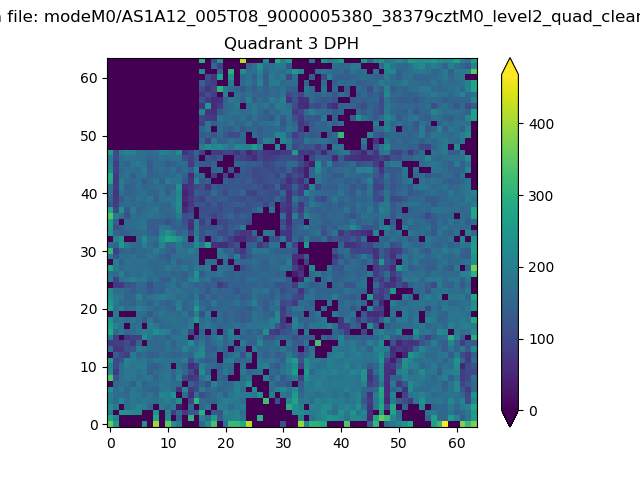 |
 |
Quadrant C |
| Plot type | Count rate plots | Images |
|---|---|---|
| Comparison with Poisson distribution Blue bars denote a histogram of data divided into 1 sec bins. Red curve is a Poisson curve with rate = median count rate of data. |
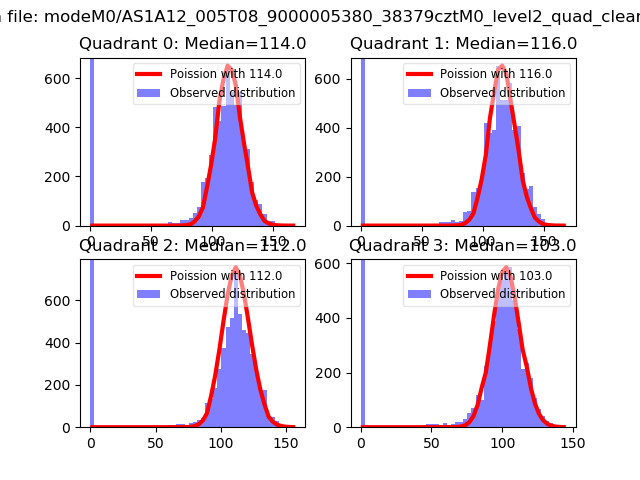 |
 |
| Quadrant-wise count rates Data is divided into 100 sec bins |
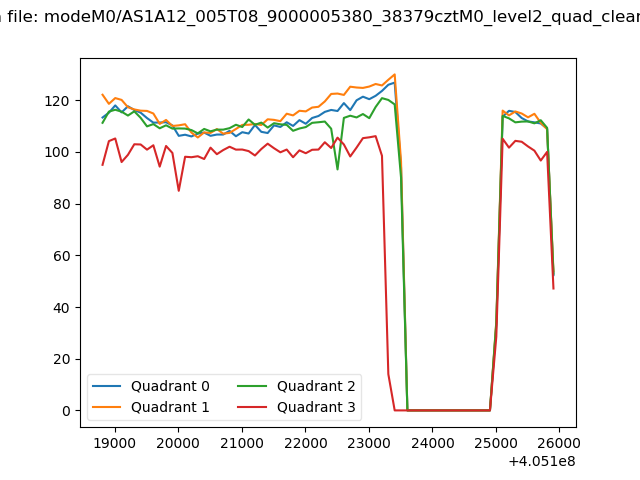 |
|
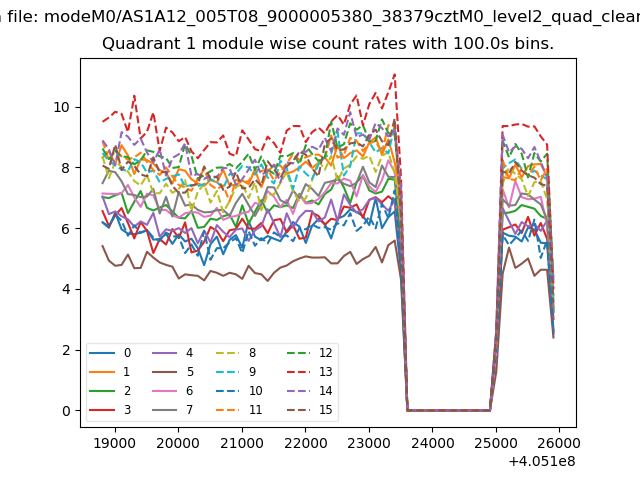
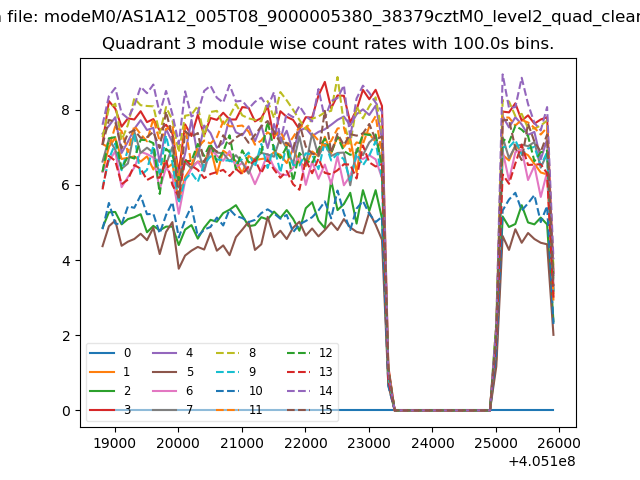
| Module-wise count rates for Quadrant A Data is divided into 100 sec bins |
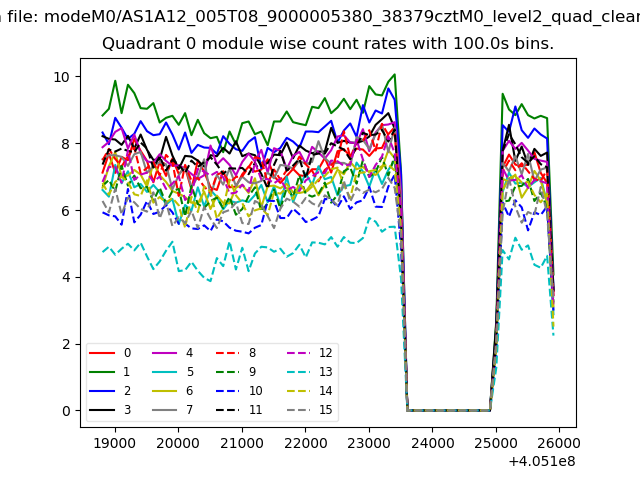 |
 |
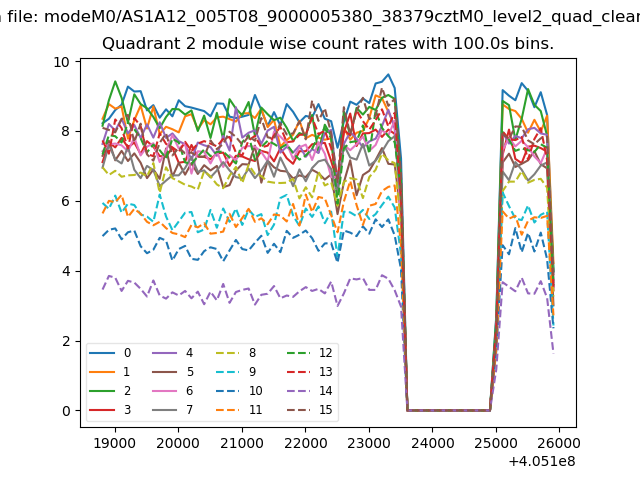
| Module-wise count rates for Quadrant B Data is divided into 100 sec bins |
 |
 |
| Module-wise count rates for Quadrant C Data is divided into 100 sec bins |
 |
 |
| Module-wise count rates for Quadrant D Data is divided into 100 sec bins |
 |
 |
| Parameter | Plot |
|---|---|
| CZT HV Monitor | 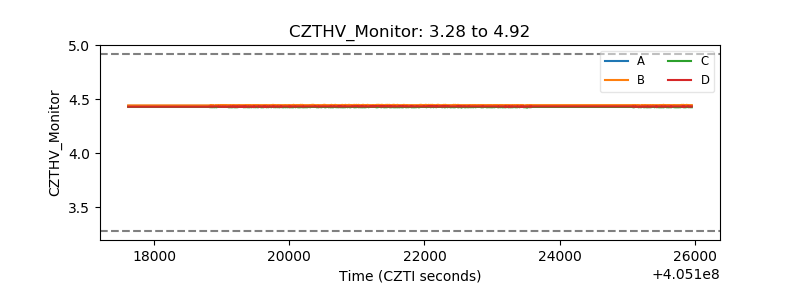 |
| D_VDD | 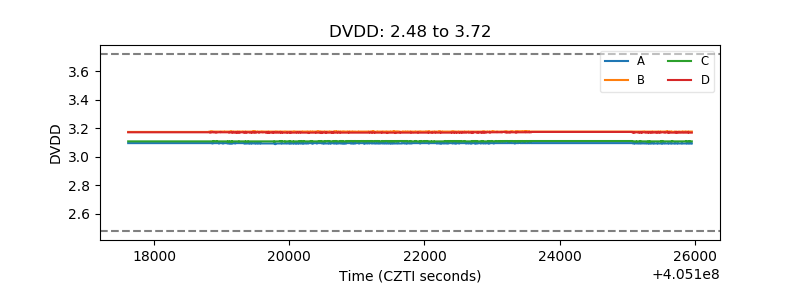 |
| Temperature 1 | 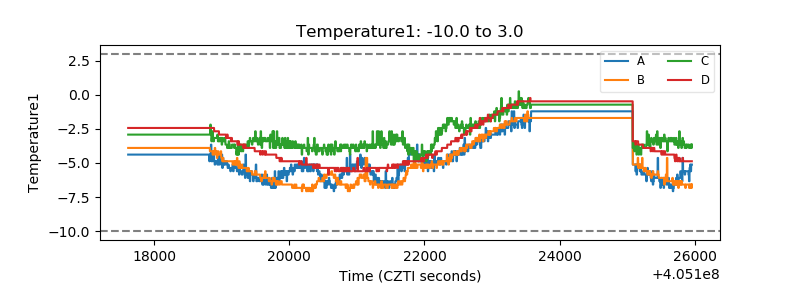 |
| Veto HV Monitor | 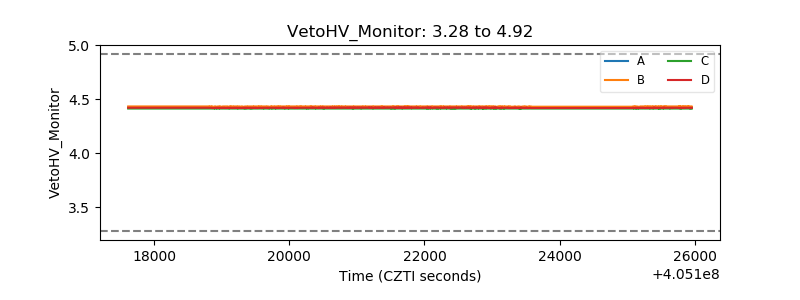 |
| Veto LLD | 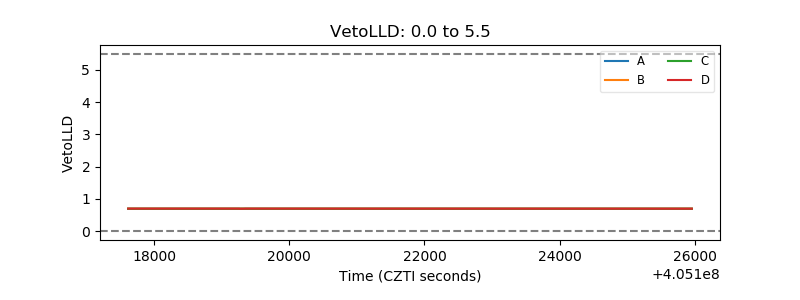 |
| Alpha Counter | 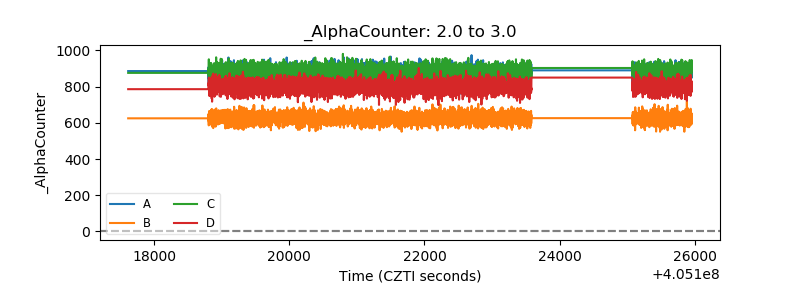 |
| _CPM_Rate | 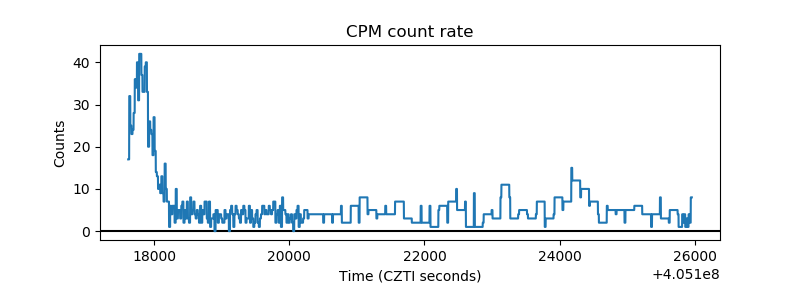 |
| CZT Counter | 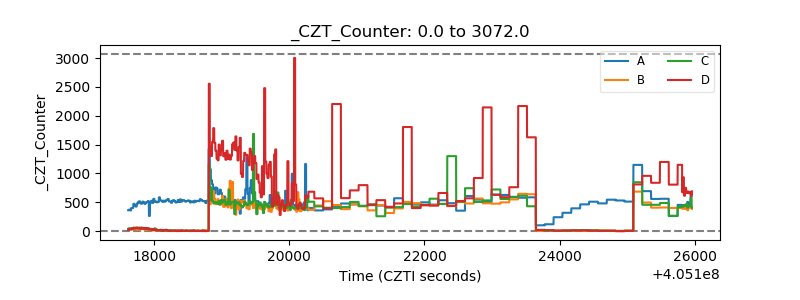 |
| +2.5 Volts monitor | 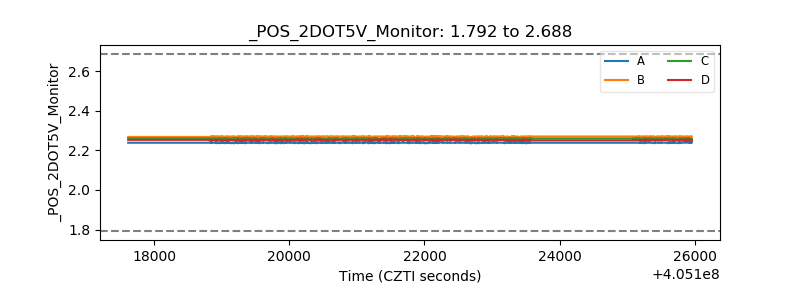 |
| +5 Volts monitor | 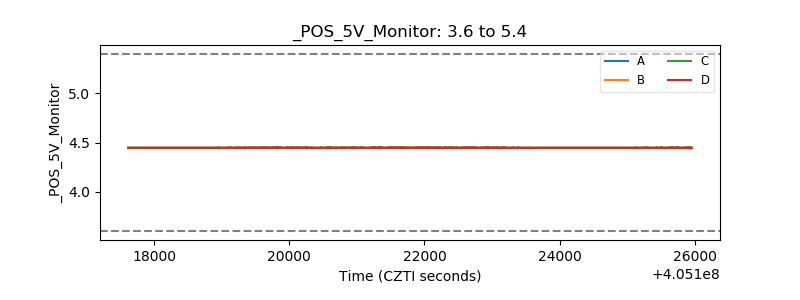 |
| _ROLL_ROT | 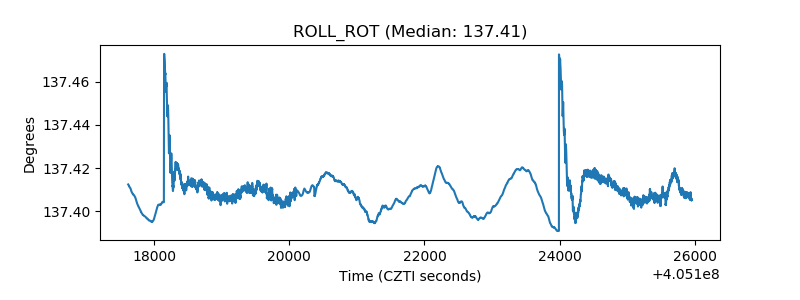 |
| _Roll_DEC | 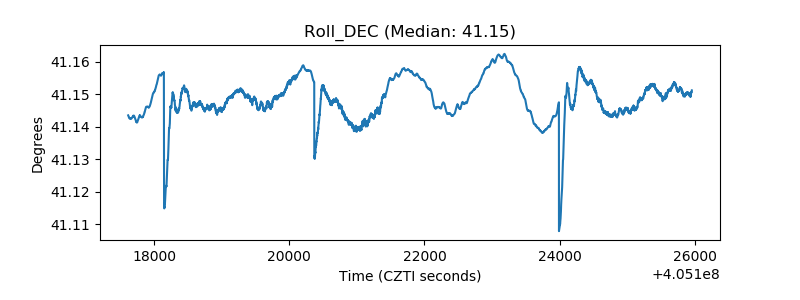 |
| _Roll_RA | 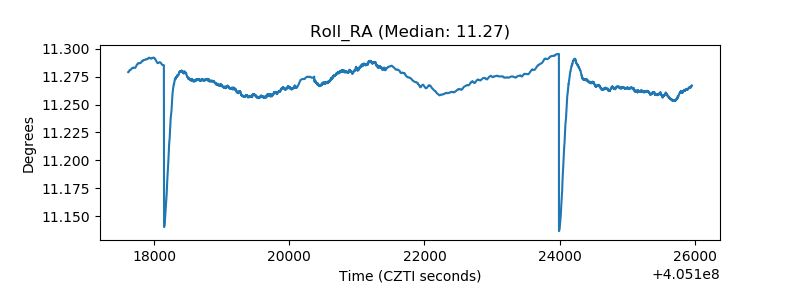 |
| Veto Counter | 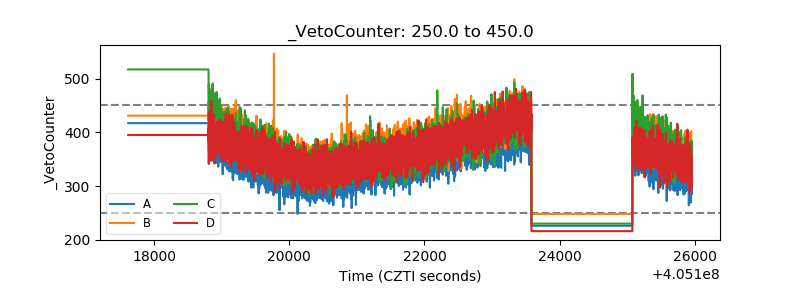 |