| Param | Original file | Final file |
|---|---|---|
| Filename | modeM0/AS1A12_005T08_9000005380_38380cztM0_level2.fits | modeM0/AS1A12_005T08_9000005380_38380cztM0_level2_quad_clean.evt |
| Size (bytes) | 435,617,280 | 104,241,600 |
| Size | 415.4 MB | 99.4 MB |
| Events in quadrant A | 3,695,664 | 701,389 |
| Events in quadrant B | 3,429,230 | 714,016 |
| Events in quadrant C | 3,055,728 | 699,963 |
| Events in quadrant D | 5,458,602 | 604,773 |
| Mode M0 | |||
|---|---|---|---|
| Quadrant | BADHDUFLAG | Total packets | Discarded packets |
| A | 0 | 15122 | 3 |
| B | 0 | 14507 | 2 |
| C | 0 | 13008 | 2 |
| D | 0 | 20628 | 2 |
| Mode M9 | |||
|---|---|---|---|
| Quadrant | BADHDUFLAG | Total packets | Discarded packets |
| A | 0 | 28 | 0 |
| B | 0 | 28 | 0 |
| C | 0 | 28 | 0 |
| D | 0 | 28 | 0 |
| Mode SS | |||
|---|---|---|---|
| Quadrant | BADHDUFLAG | Total packets | Discarded packets |
| A | 0 | 128 | 0 |
| B | 0 | 128 | 0 |
| C | 0 | 128 | 0 |
| D | 0 | 128 | 0 |
| Quadrant | Total seconds | Saturated seconds | Saturation percentage |
|---|---|---|---|
| A | 6255 | 60 | 0.959233% |
| B | 6255 | 79 | 1.262990% |
| C | 6255 | 12 | 0.191847% |
| D | 6255 | 381 | 6.091127% |
Noise dominated data is calculated using 1-second bins in cleaned event files. If a bin has >2000 counts, and if more than 50% of those come from <1% of pixels, then it is considered to be noise-dominated and hence unusable.
| Quadrant | # 1 sec bins | Bins with >0 counts | Bins with >2000 counts | High rate bins dominated by noise | Noise dominated (total time) | Noise dominated (detector-on time) | Marked lightcurve |
|---|---|---|---|---|---|---|---|
| A | 9061 | 6257 | 26 | 26 | 0.29% | 0.42% | 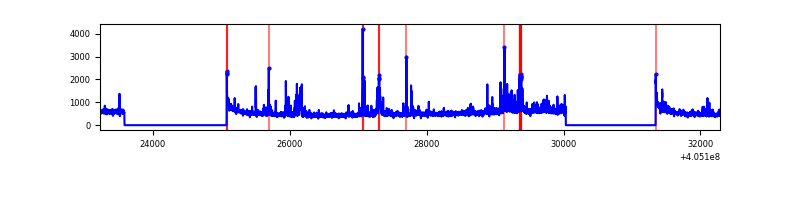 |
| B | 9061 | 6257 | 24 | 24 | 0.26% | 0.38% | 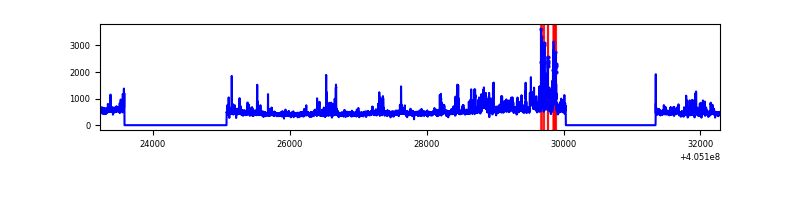 |
| C | 9061 | 6257 | 5 | 5 | 0.06% | 0.08% | 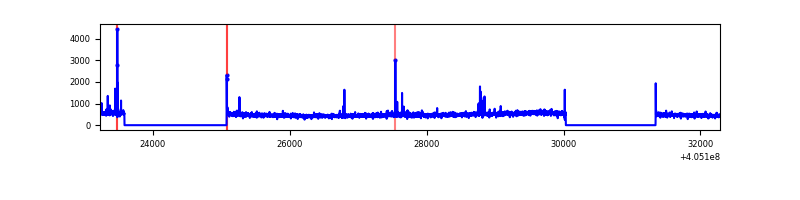 |
| D | 9061 | 6257 | 307 | 307 | 3.39% | 4.91% | 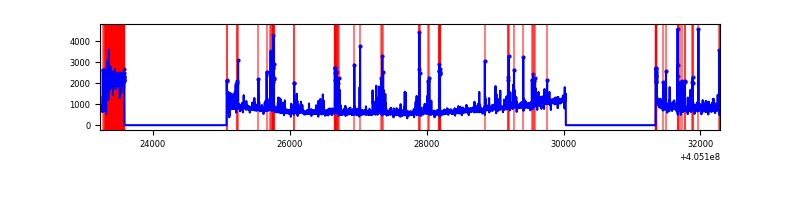 |
Top three noisy pixels from each quadrant. If the there are fewer than three noisy pixels in the level2.evt file, extra rows are filled as -1
| Pixel properties | Quadrant properties | ||||||
|---|---|---|---|---|---|---|---|
| Quadrant | DetID | PixID | Counts | Sigma | Mean | Median | Sigma |
| A | 10 | 83 | 420529 | 2919.92 | 705 | 690 | 143.8 |
| A | 12 | 16 | 380901 | 2644.31 | 705 | 690 | 143.8 |
| A | 9 | 143 | 73398 | 505.67 | 705 | 690 | 143.8 |
| B | 0 | 183 | 459255 | 3357.95 | 701 | 682 | 136.6 |
| B | 15 | 35 | 54233 | 392.13 | 701 | 682 | 136.6 |
| B | 0 | 189 | 44331 | 319.62 | 701 | 682 | 136.6 |
| C | 15 | 214 | 264708 | 1630.72 | 693 | 697 | 161.9 |
| C | 14 | 254 | 57663 | 351.86 | 693 | 697 | 161.9 |
| C | 0 | 10 | 14868 | 87.53 | 693 | 697 | 161.9 |
| D | 10 | 203 | 1839704 | 10996.83 | 677 | 657 | 167.2 |
| D | 1 | 20 | 249227 | 1486.36 | 677 | 657 | 167.2 |
| D | 12 | 235 | 212490 | 1266.68 | 677 | 657 | 167.2 |
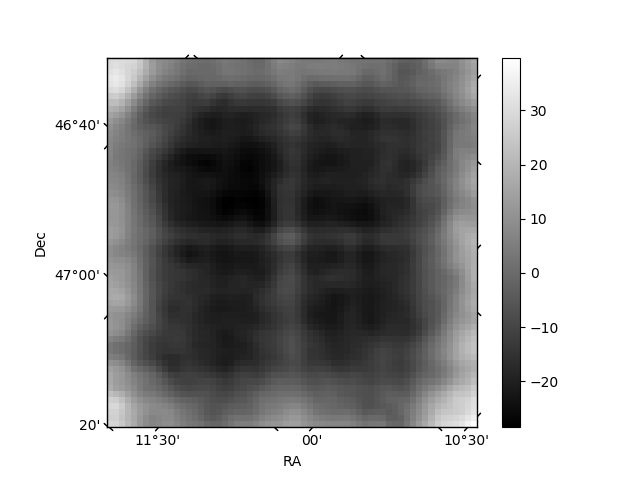
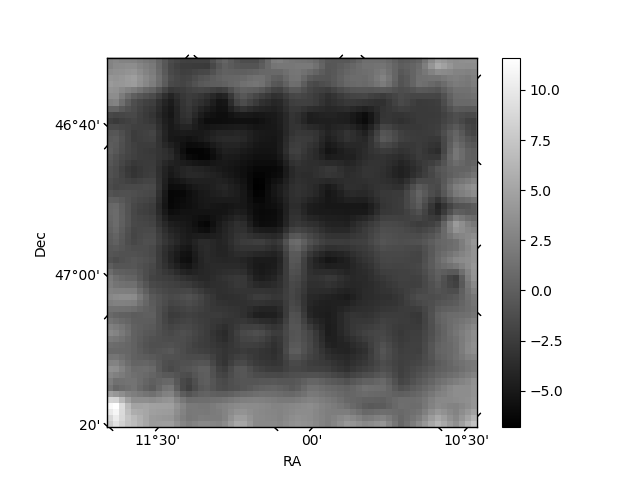
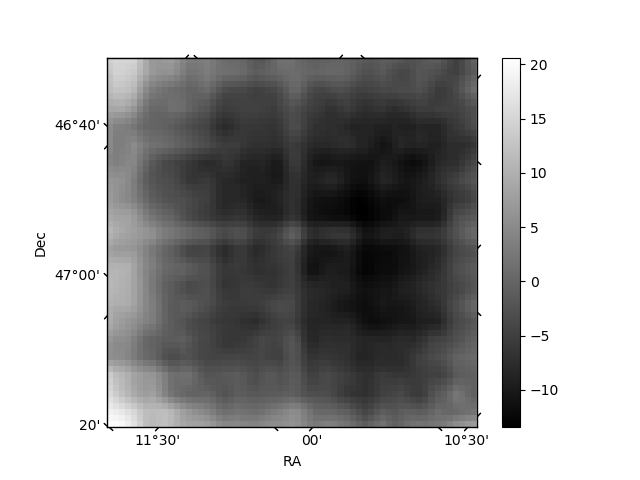
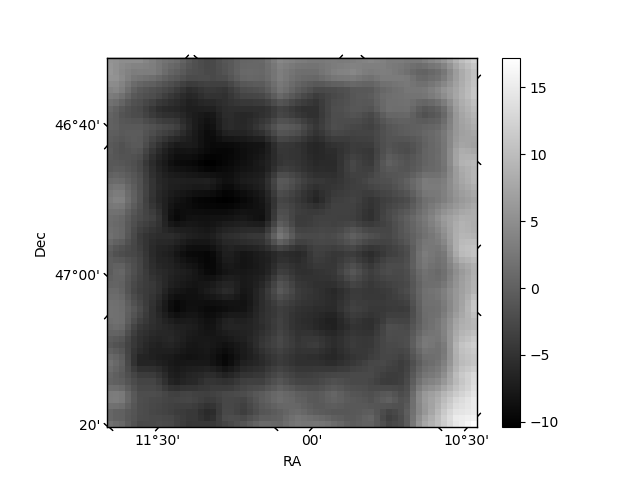
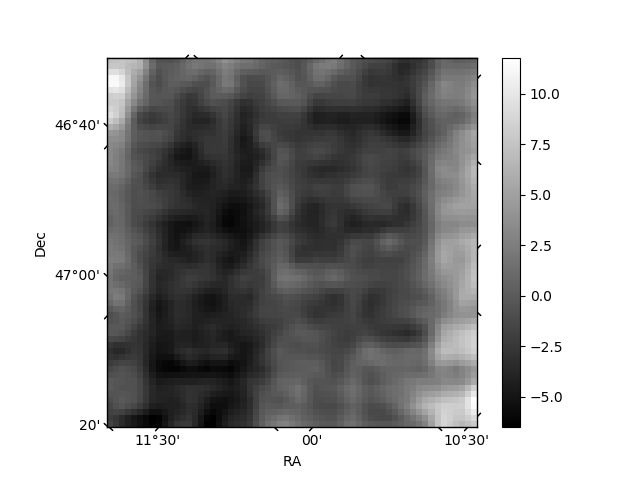
Histogram calculated using DETX and DETY for each event in the final _common_clean file
| Quadrant A | 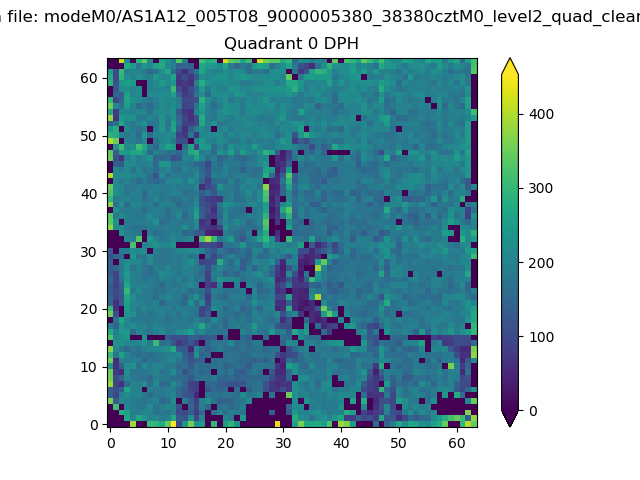 |
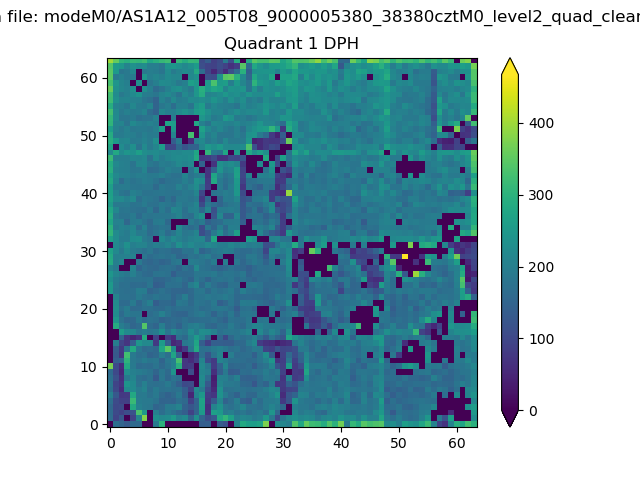 |
Quadrant B |
|---|---|---|---|
| Quadrant D | 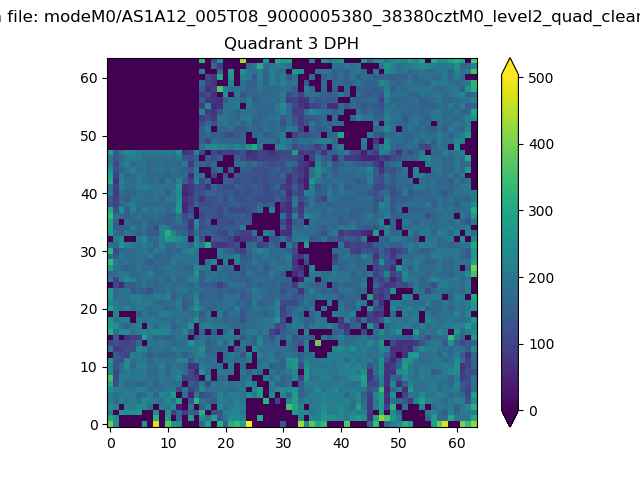 |
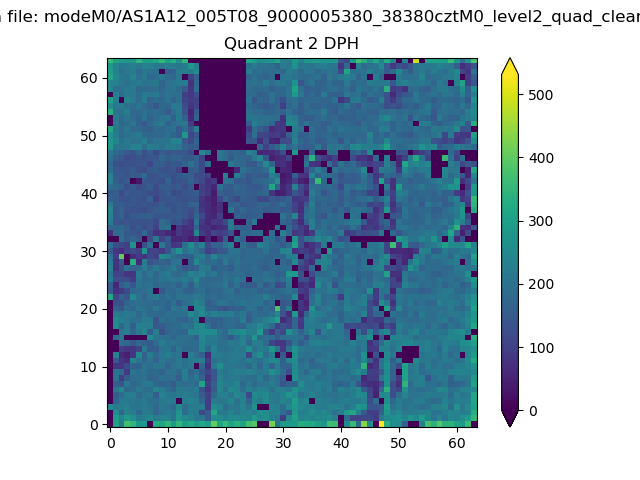 |
Quadrant C |
| Plot type | Count rate plots | Images |
|---|---|---|
| Comparison with Poisson distribution Blue bars denote a histogram of data divided into 1 sec bins. Red curve is a Poisson curve with rate = median count rate of data. |
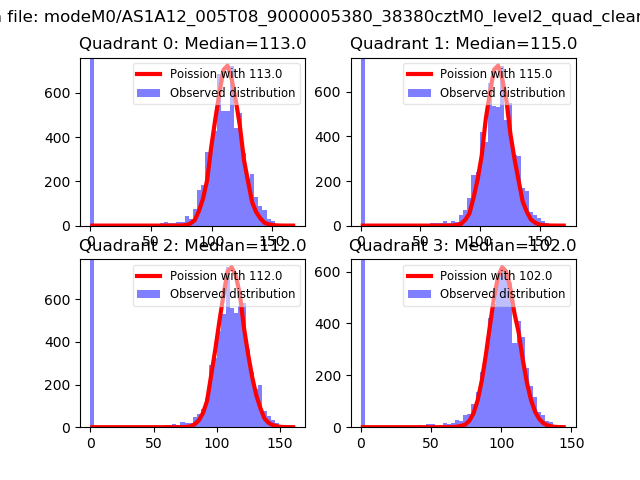 |
 |
| Quadrant-wise count rates Data is divided into 100 sec bins |
 |
|
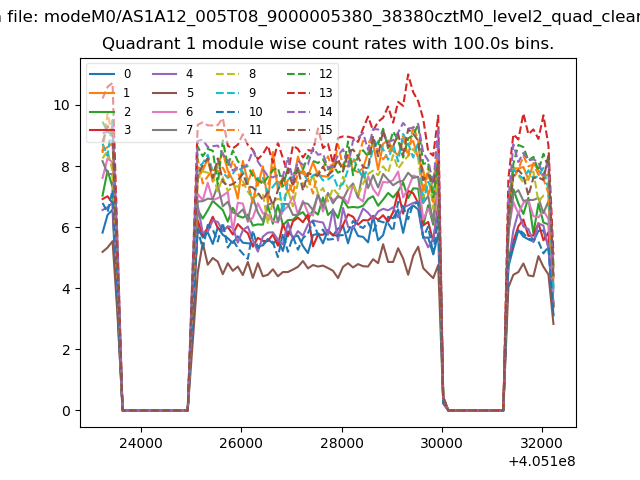
| Module-wise count rates for Quadrant A Data is divided into 100 sec bins |
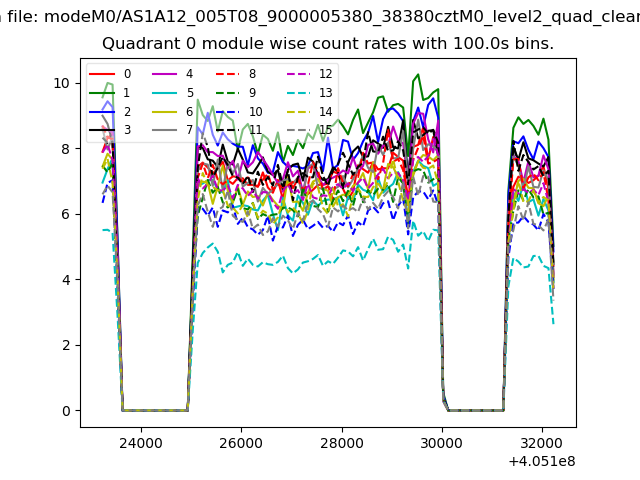 |
 |
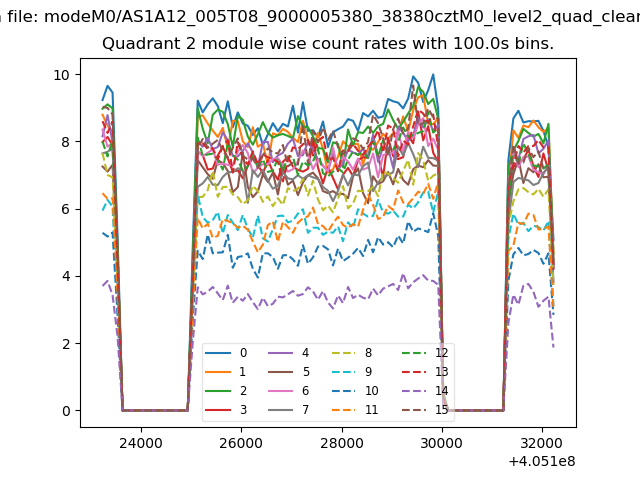
| Module-wise count rates for Quadrant B Data is divided into 100 sec bins |
 |
 |
| Module-wise count rates for Quadrant C Data is divided into 100 sec bins |
 |
 |
| Module-wise count rates for Quadrant D Data is divided into 100 sec bins |
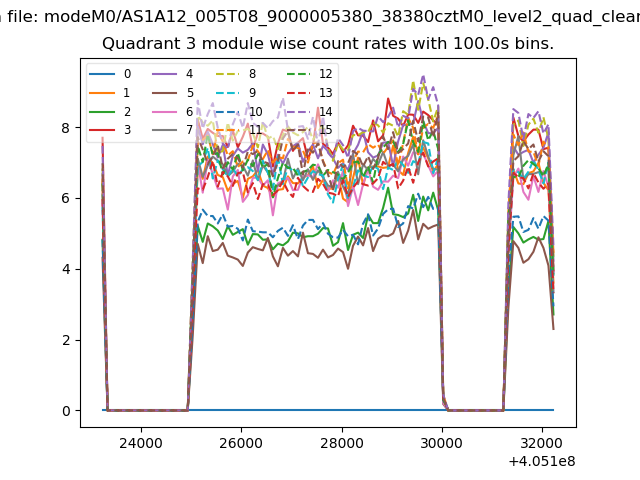 |
 |
| Parameter | Plot |
|---|---|
| CZT HV Monitor | 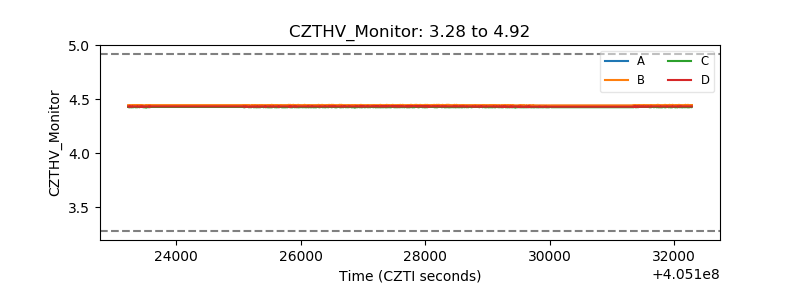 |
| D_VDD | 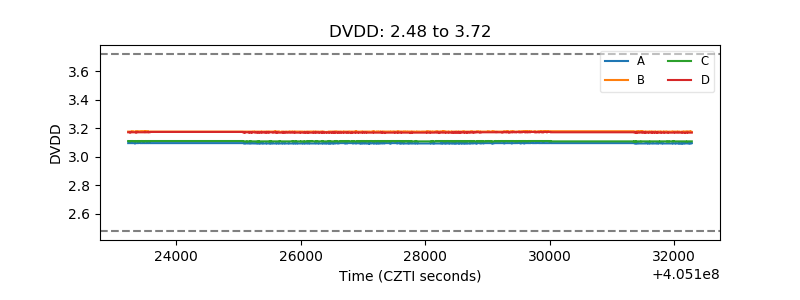 |
| Temperature 1 | 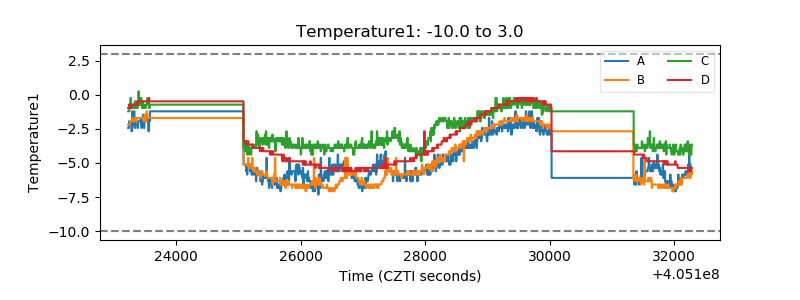 |
| Veto HV Monitor | 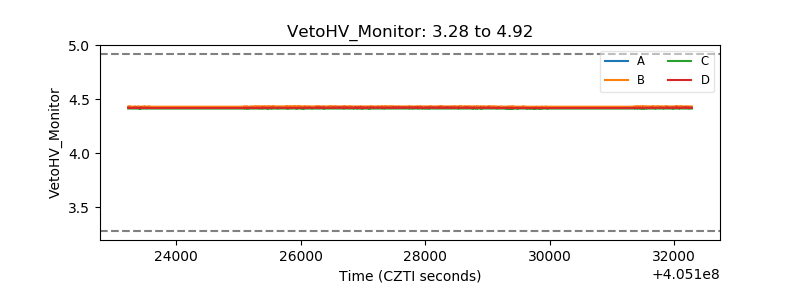 |
| Veto LLD | 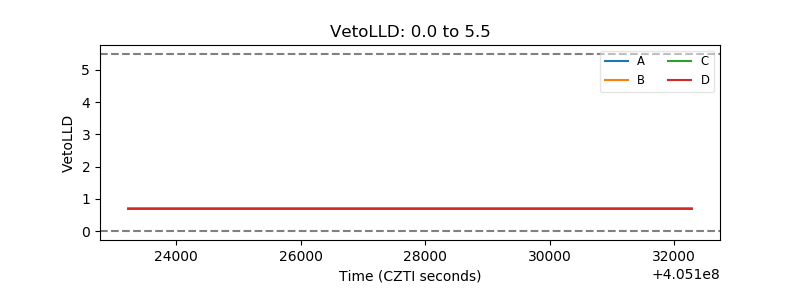 |
| Alpha Counter | 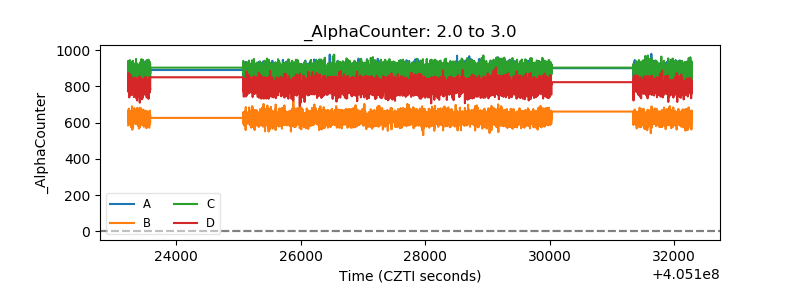 |
| _CPM_Rate | 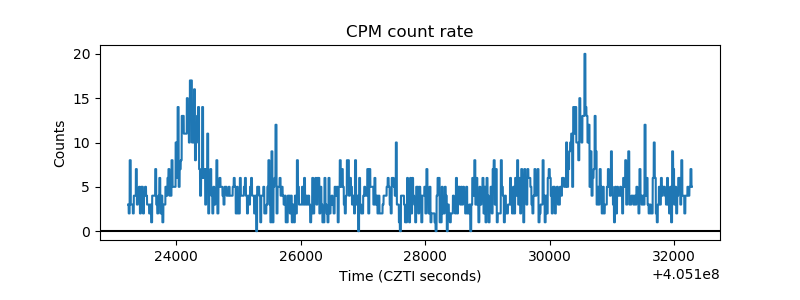 |
| CZT Counter | 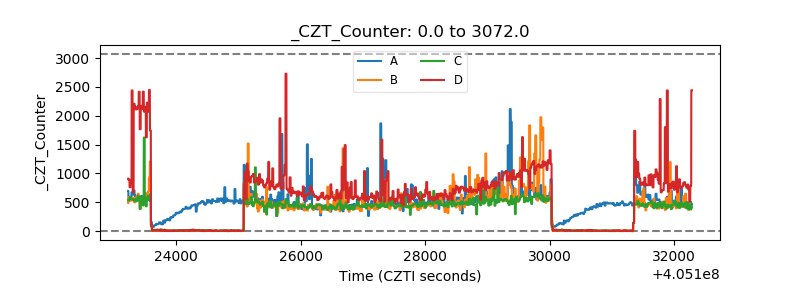 |
| +2.5 Volts monitor | 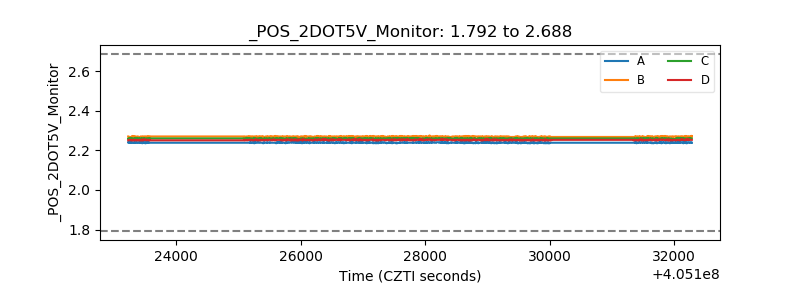 |
| +5 Volts monitor | 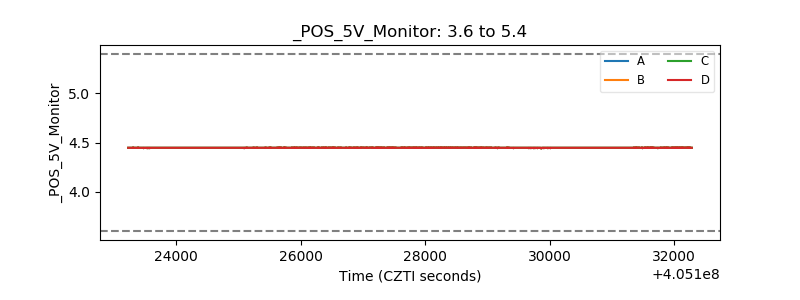 |
| _ROLL_ROT | 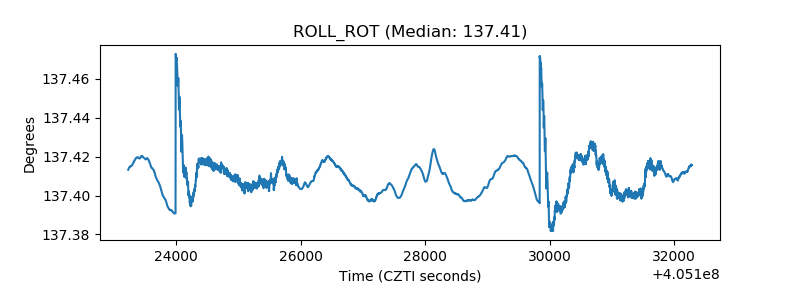 |
| _Roll_DEC | 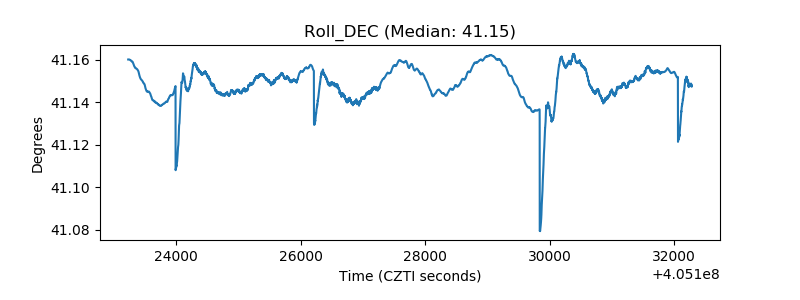 |
| _Roll_RA | 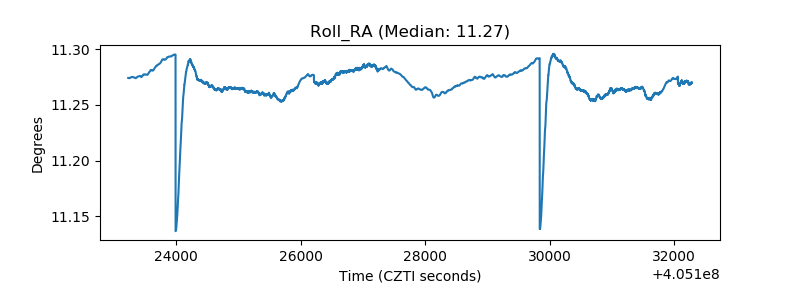 |
| Veto Counter | 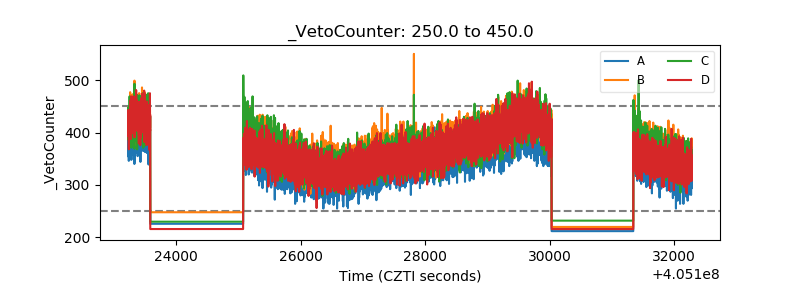 |