| Param | Original file | Final file |
|---|---|---|
| Filename | modeM0/AS1A12_005T08_9000005380_38383cztM0_level2.fits | modeM0/AS1A12_005T08_9000005380_38383cztM0_level2_quad_clean.evt |
| Size (bytes) | 1,165,230,720 | 257,794,560 |
| Size | 1.1 GB | 245.9 MB |
| Events in quadrant A | 9,150,823 | 1,747,290 |
| Events in quadrant B | 7,944,593 | 1,801,937 |
| Events in quadrant C | 7,736,513 | 1,743,267 |
| Events in quadrant D | 17,071,556 | 1,415,735 |
| Mode M0 | |||
|---|---|---|---|
| Quadrant | BADHDUFLAG | Total packets | Discarded packets |
| A | 0 | 36817 | 5 |
| B | 0 | 34106 | 4 |
| C | 0 | 32664 | 4 |
| D | 0 | 61878 | 4 |
| Mode M9 | |||
|---|---|---|---|
| Quadrant | BADHDUFLAG | Total packets | Discarded packets |
| A | 0 | 55 | 0 |
| B | 0 | 55 | 0 |
| C | 0 | 55 | 0 |
| D | 0 | 55 | 0 |
| Mode SS | |||
|---|---|---|---|
| Quadrant | BADHDUFLAG | Total packets | Discarded packets |
| A | 0 | 326 | 0 |
| B | 0 | 326 | 0 |
| C | 0 | 326 | 0 |
| D | 0 | 326 | 0 |
| Quadrant | Total seconds | Saturated seconds | Saturation percentage |
|---|---|---|---|
| A | 15903 | 148 | 0.930642% |
| B | 15903 | 68 | 0.427592% |
| C | 15903 | 35 | 0.220084% |
| D | 15903 | 2027 | 12.746023% |
Noise dominated data is calculated using 1-second bins in cleaned event files. If a bin has >2000 counts, and if more than 50% of those come from <1% of pixels, then it is considered to be noise-dominated and hence unusable.
| Quadrant | # 1 sec bins | Bins with >0 counts | Bins with >2000 counts | High rate bins dominated by noise | Noise dominated (total time) | Noise dominated (detector-on time) | Marked lightcurve |
|---|---|---|---|---|---|---|---|
| A | 21365 | 15907 | 114 | 114 | 0.53% | 0.72% | 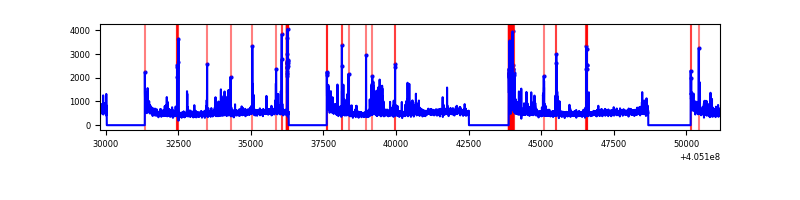 |
| B | 21365 | 15907 | 25 | 25 | 0.12% | 0.16% | 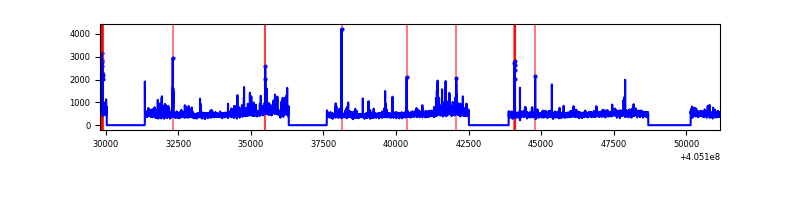 |
| C | 21365 | 15907 | 15 | 15 | 0.07% | 0.09% | 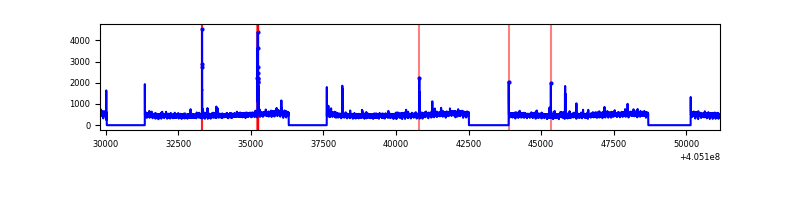 |
| D | 21365 | 15906 | 1921 | 1921 | 8.99% | 12.08% | 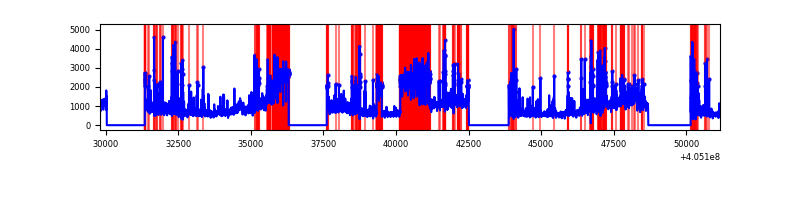 |
Top three noisy pixels from each quadrant. If the there are fewer than three noisy pixels in the level2.evt file, extra rows are filled as -1
| Pixel properties | Quadrant properties | ||||||
|---|---|---|---|---|---|---|---|
| Quadrant | DetID | PixID | Counts | Sigma | Mean | Median | Sigma |
| A | 10 | 83 | 1006519 | 2764.39 | 1807 | 1770 | 363.5 |
| A | 12 | 16 | 575560 | 1578.68 | 1807 | 1770 | 363.5 |
| A | 9 | 143 | 232270 | 634.18 | 1807 | 1770 | 363.5 |
| B | 0 | 183 | 392873 | 1124.73 | 1800 | 1748 | 347.8 |
| B | 0 | 189 | 100106 | 282.84 | 1800 | 1748 | 347.8 |
| B | 15 | 35 | 86072 | 242.48 | 1800 | 1748 | 347.8 |
| C | 15 | 214 | 671188 | 1626.0 | 1768 | 1782 | 411.7 |
| C | 14 | 254 | 103309 | 246.61 | 1768 | 1782 | 411.7 |
| C | 4 | 0 | 31777 | 72.86 | 1768 | 1782 | 411.7 |
| D | 10 | 203 | 6913464 | 16970.34 | 1663 | 1616 | 407.3 |
| D | 12 | 235 | 1456333 | 3571.7 | 1663 | 1616 | 407.3 |
| D | 1 | 20 | 675669 | 1654.97 | 1663 | 1616 | 407.3 |
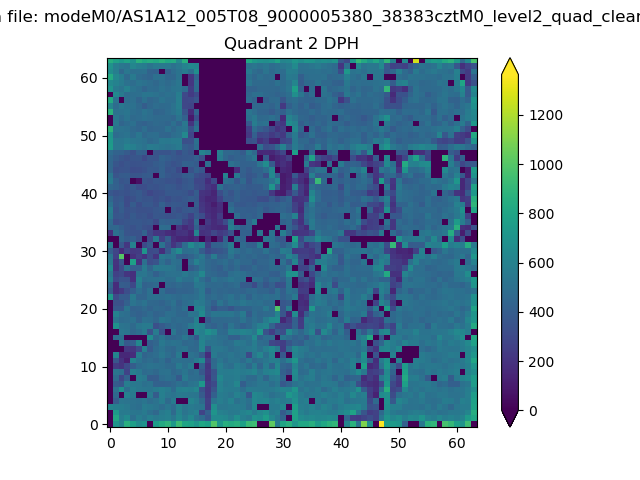
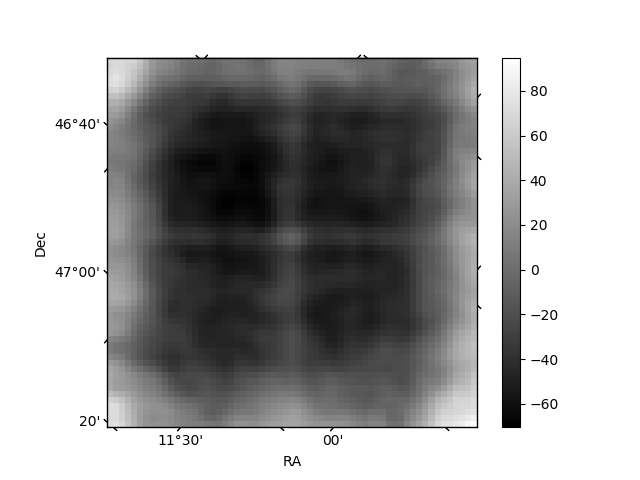
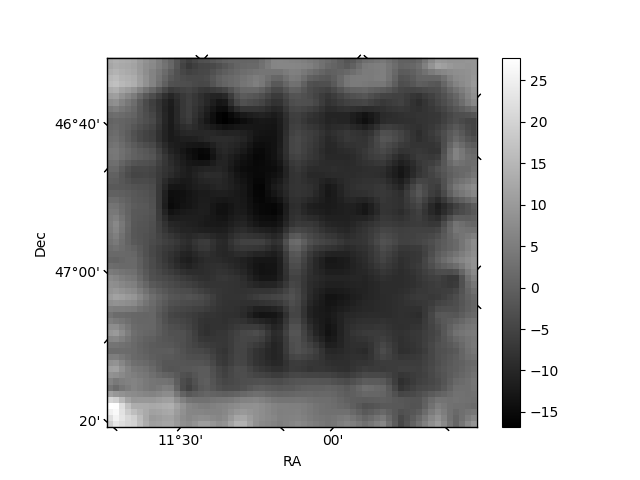
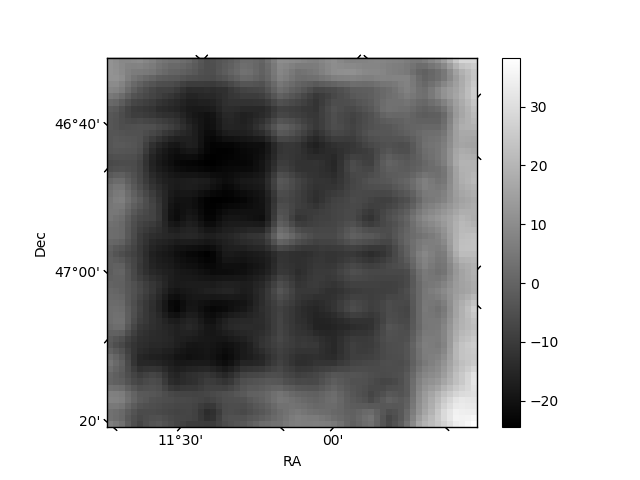
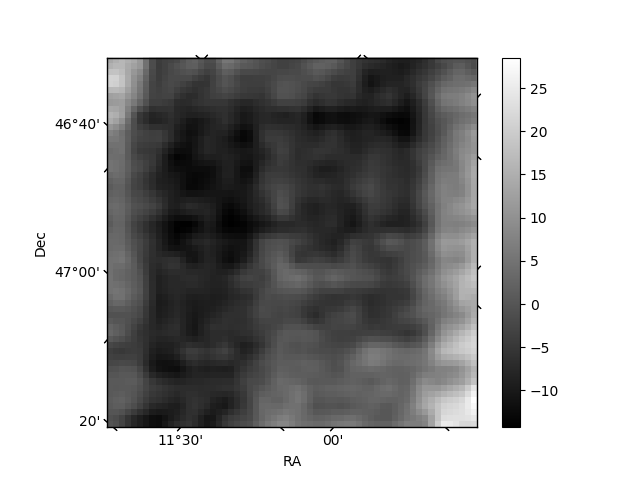
Histogram calculated using DETX and DETY for each event in the final _common_clean file
| Quadrant A | 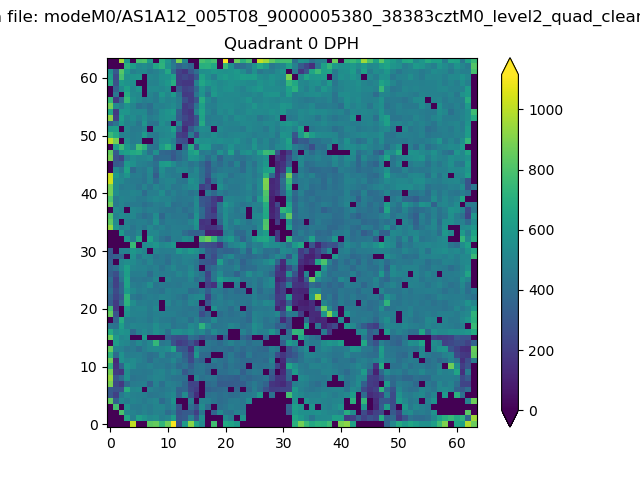 |
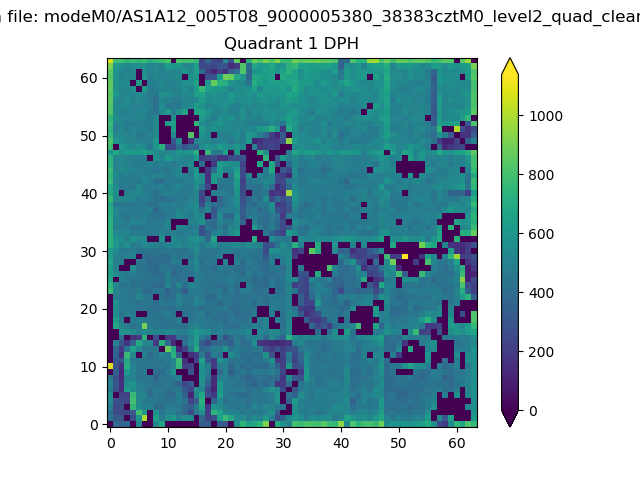 |
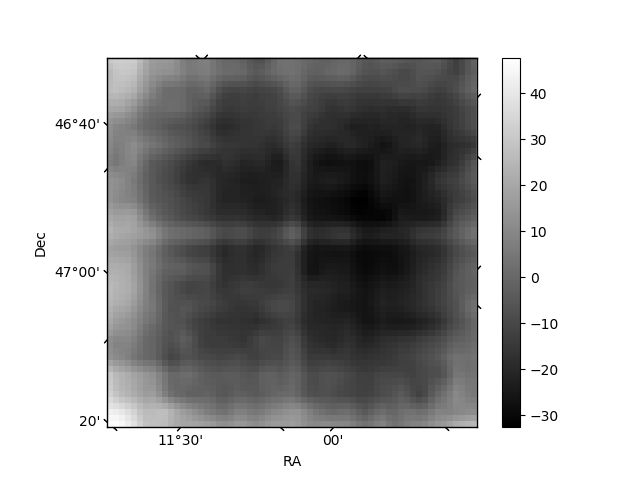
Quadrant B |
|---|---|---|---|
| Quadrant D | 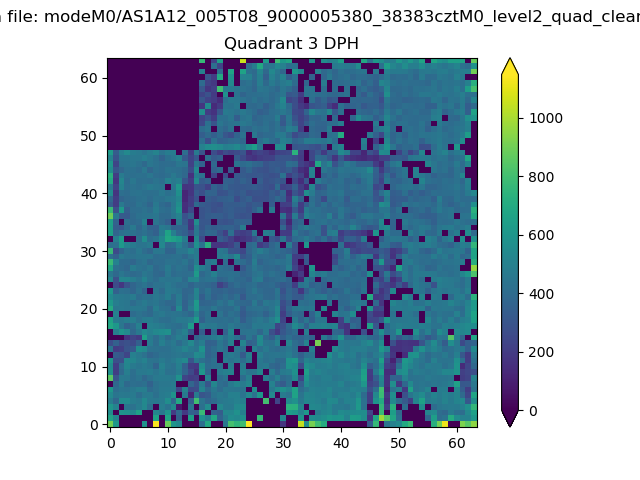 |
 |
Quadrant C |
| Plot type | Count rate plots | Images |
|---|---|---|
| Comparison with Poisson distribution Blue bars denote a histogram of data divided into 1 sec bins. Red curve is a Poisson curve with rate = median count rate of data. |
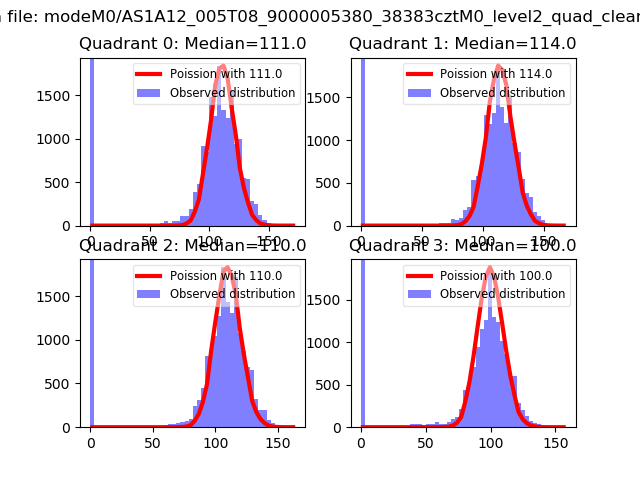 |
 |
| Quadrant-wise count rates Data is divided into 100 sec bins |
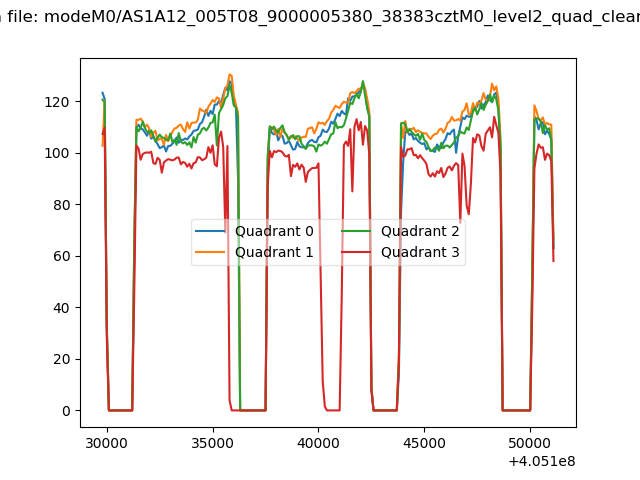 |
|
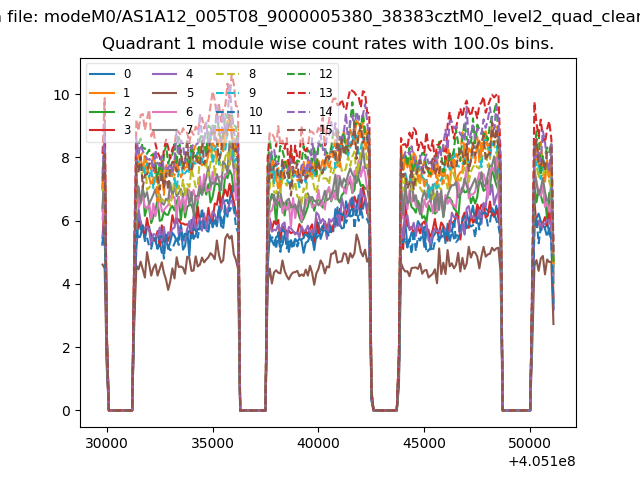
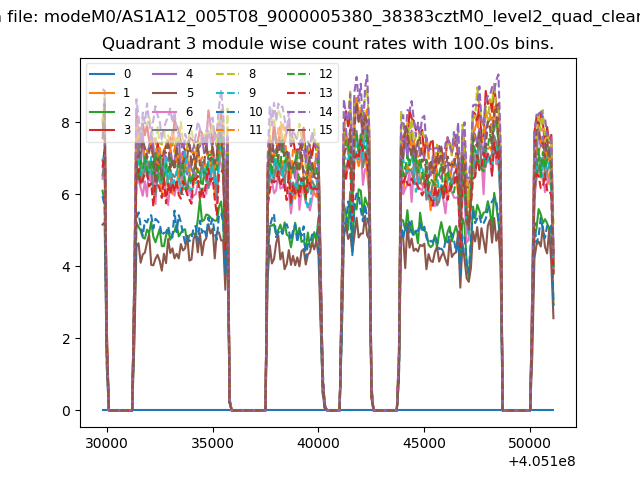
| Module-wise count rates for Quadrant A Data is divided into 100 sec bins |
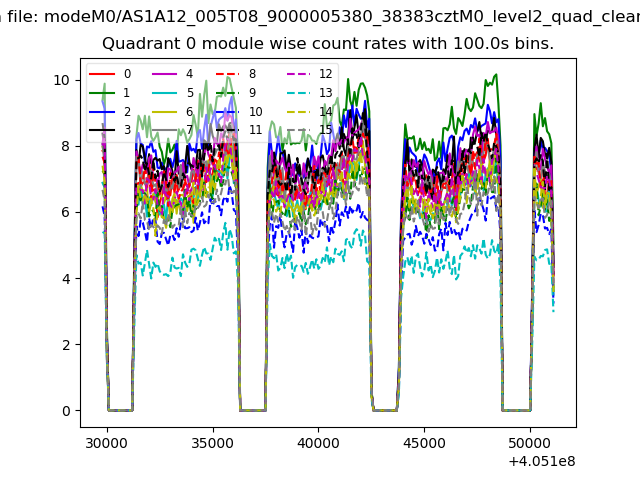 |
 |
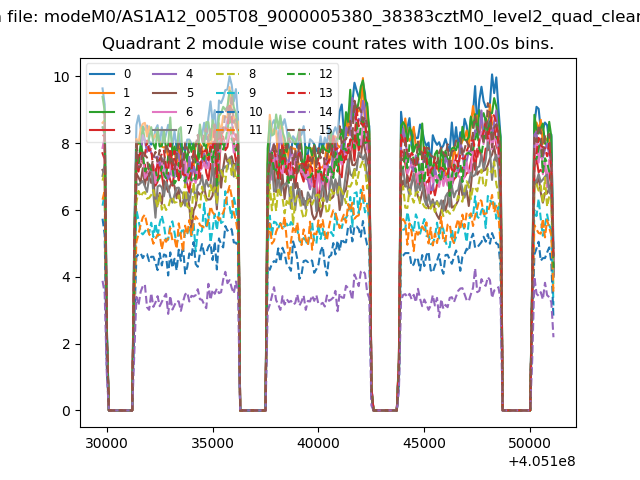
| Module-wise count rates for Quadrant B Data is divided into 100 sec bins |
 |
 |
| Module-wise count rates for Quadrant C Data is divided into 100 sec bins |
 |
 |
| Module-wise count rates for Quadrant D Data is divided into 100 sec bins |
 |
 |
| Parameter | Plot |
|---|---|
| CZT HV Monitor |  |
| D_VDD | 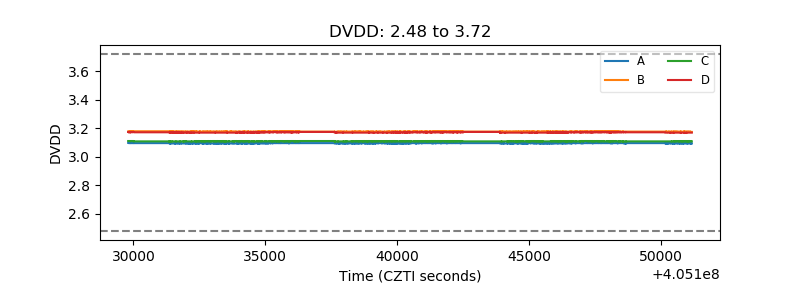 |
| Temperature 1 | 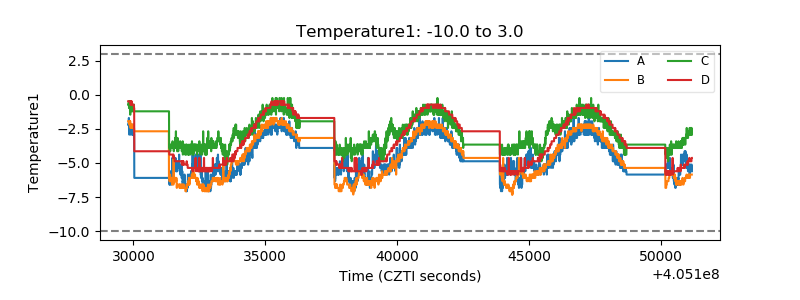 |
| Veto HV Monitor | 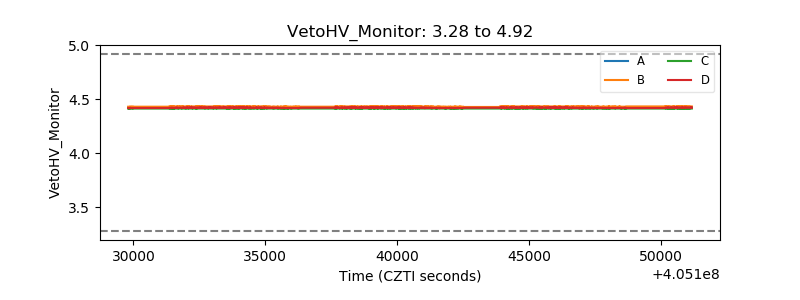 |
| Veto LLD | 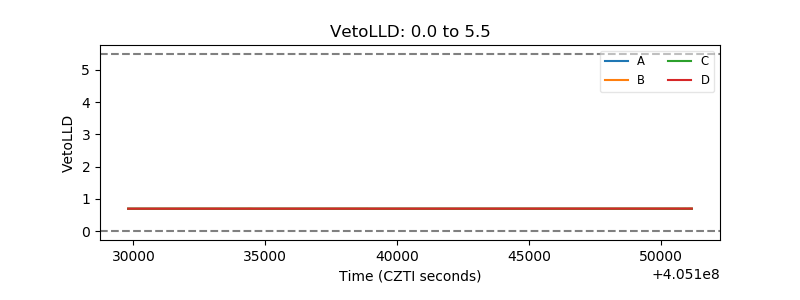 |
| Alpha Counter | 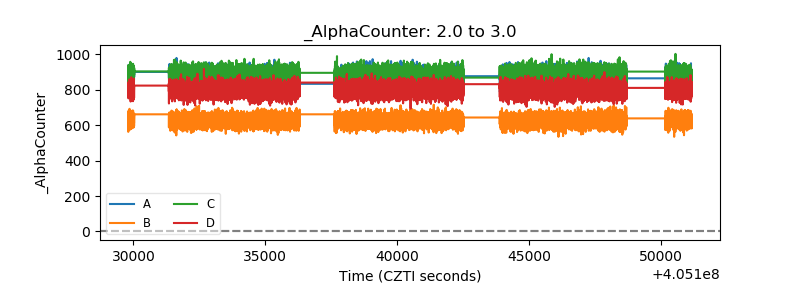 |
| _CPM_Rate | 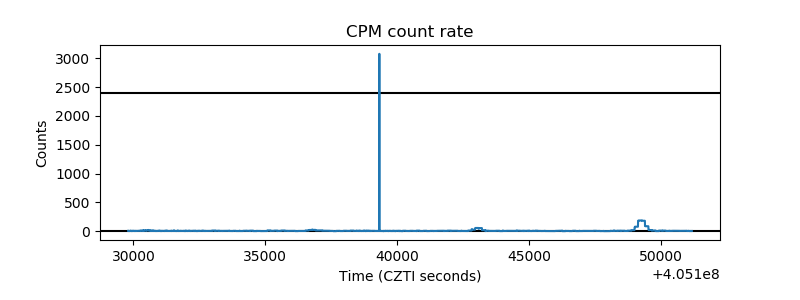 |
| CZT Counter | 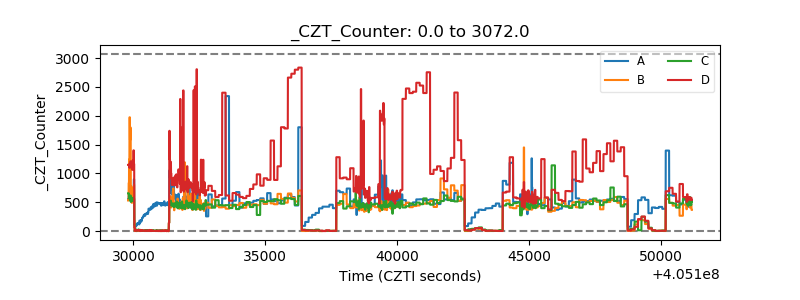 |
| +2.5 Volts monitor | 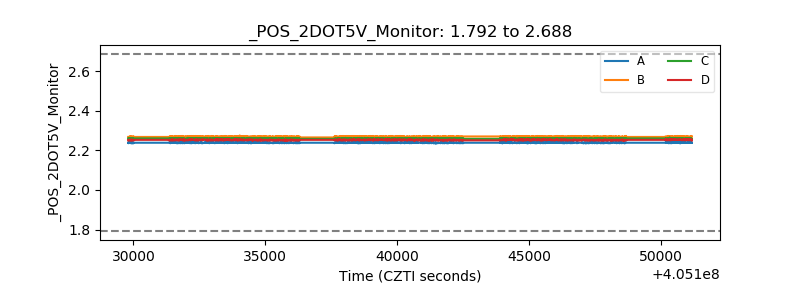 |
| +5 Volts monitor | 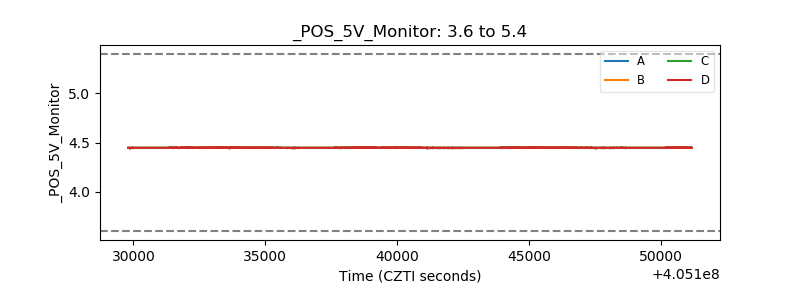 |
| _ROLL_ROT | 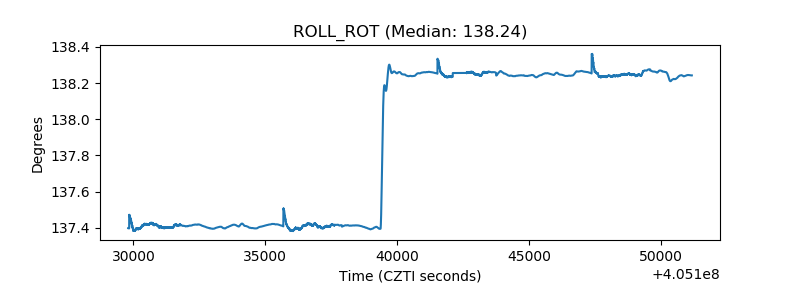 |
| _Roll_DEC | 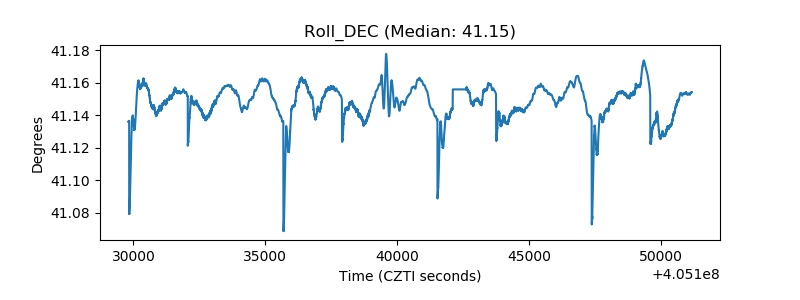 |
| _Roll_RA | 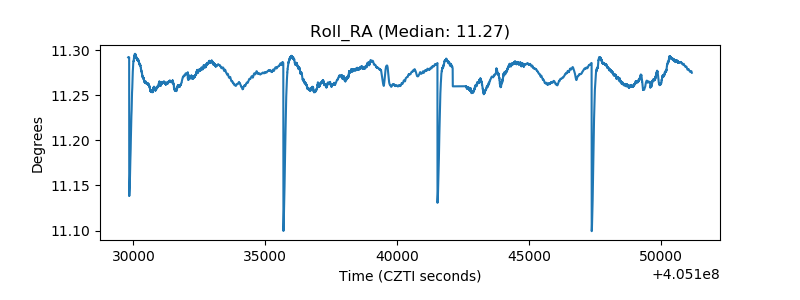 |
| Veto Counter | 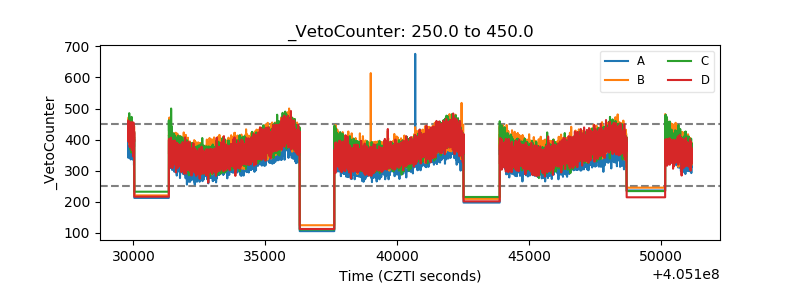 |