| Param | Original file | Final file |
|---|---|---|
| Filename | modeM0/AS1A12_005T08_9000005380_38384cztM0_level2.fits | modeM0/AS1A12_005T08_9000005380_38384cztM0_level2_quad_clean.evt |
| Size (bytes) | 438,269,760 | 95,783,040 |
| Size | 418.0 MB | 91.3 MB |
| Events in quadrant A | 3,237,654 | 663,334 |
| Events in quadrant B | 2,916,694 | 684,396 |
| Events in quadrant C | 2,865,804 | 653,704 |
| Events in quadrant D | 6,745,652 | 487,455 |
| Mode M0 | |||
|---|---|---|---|
| Quadrant | BADHDUFLAG | Total packets | Discarded packets |
| A | 0 | 13063 | 3 |
| B | 0 | 12324 | 2 |
| C | 0 | 11939 | 2 |
| D | 0 | 24309 | 2 |
| Mode M9 | |||
|---|---|---|---|
| Quadrant | BADHDUFLAG | Total packets | Discarded packets |
| A | 0 | 31 | 0 |
| B | 0 | 31 | 0 |
| C | 0 | 31 | 0 |
| D | 0 | 31 | 0 |
| Mode SS | |||
|---|---|---|---|
| Quadrant | BADHDUFLAG | Total packets | Discarded packets |
| A | 0 | 122 | 0 |
| B | 0 | 122 | 0 |
| C | 0 | 122 | 0 |
| D | 0 | 122 | 0 |
| Quadrant | Total seconds | Saturated seconds | Saturation percentage |
|---|---|---|---|
| A | 5883 | 27 | 0.458950% |
| B | 5883 | 9 | 0.152983% |
| C | 5883 | 8 | 0.135985% |
| D | 5883 | 1116 | 18.969913% |
Noise dominated data is calculated using 1-second bins in cleaned event files. If a bin has >2000 counts, and if more than 50% of those come from <1% of pixels, then it is considered to be noise-dominated and hence unusable.
| Quadrant | # 1 sec bins | Bins with >0 counts | Bins with >2000 counts | High rate bins dominated by noise | Noise dominated (total time) | Noise dominated (detector-on time) | Marked lightcurve |
|---|---|---|---|---|---|---|---|
| A | 8929 | 5885 | 10 | 10 | 0.11% | 0.17% | 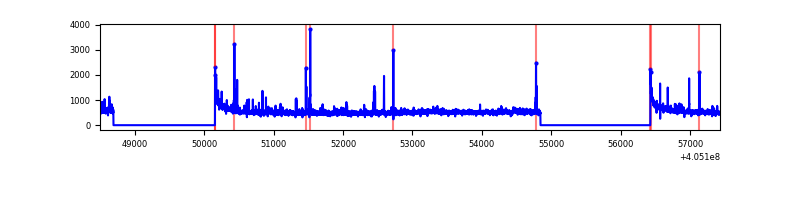 |
| B | 8929 | 5885 | 0 | 0 | 0.00% | 0.00% | 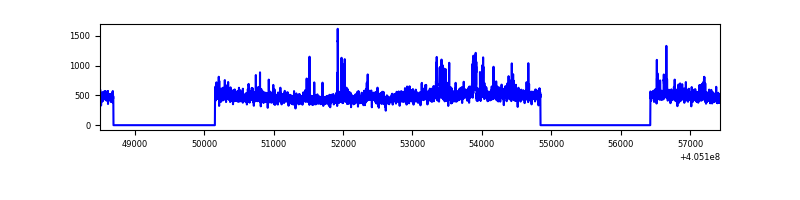 |
| C | 8929 | 5885 | 1 | 1 | 0.01% | 0.02% | 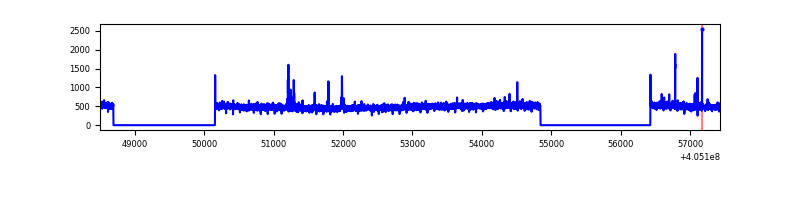 |
| D | 8929 | 5885 | 1081 | 1081 | 12.11% | 18.37% | 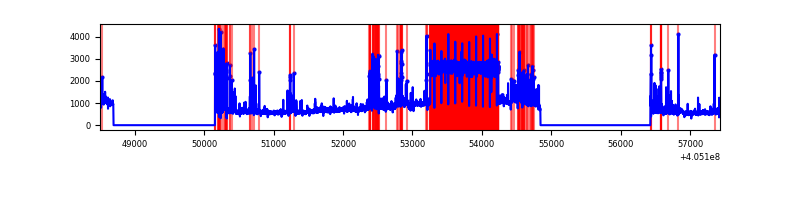 |
Top three noisy pixels from each quadrant. If the there are fewer than three noisy pixels in the level2.evt file, extra rows are filled as -1
| Pixel properties | Quadrant properties | ||||||
|---|---|---|---|---|---|---|---|
| Quadrant | DetID | PixID | Counts | Sigma | Mean | Median | Sigma |
| A | 10 | 83 | 414901 | 3026.57 | 676 | 664 | 136.9 |
| A | 9 | 143 | 74999 | 543.12 | 676 | 664 | 136.9 |
| A | 12 | 16 | 66149 | 478.46 | 676 | 664 | 136.9 |
| B | 0 | 183 | 165469 | 1257.49 | 671 | 654 | 131.1 |
| B | 4 | 21 | 45293 | 340.58 | 671 | 654 | 131.1 |
| B | 12 | 111 | 16648 | 122.03 | 671 | 654 | 131.1 |
| C | 15 | 214 | 250863 | 1602.9 | 659 | 663 | 156.1 |
| C | 15 | 159 | 12577 | 76.33 | 659 | 663 | 156.1 |
| C | 5 | 250 | 10822 | 65.08 | 659 | 663 | 156.1 |
| D | 10 | 203 | 3414416 | 23727.58 | 587 | 569 | 143.9 |
| D | 7 | 223 | 299881 | 2080.34 | 587 | 569 | 143.9 |
| D | 1 | 20 | 241812 | 1676.73 | 587 | 569 | 143.9 |
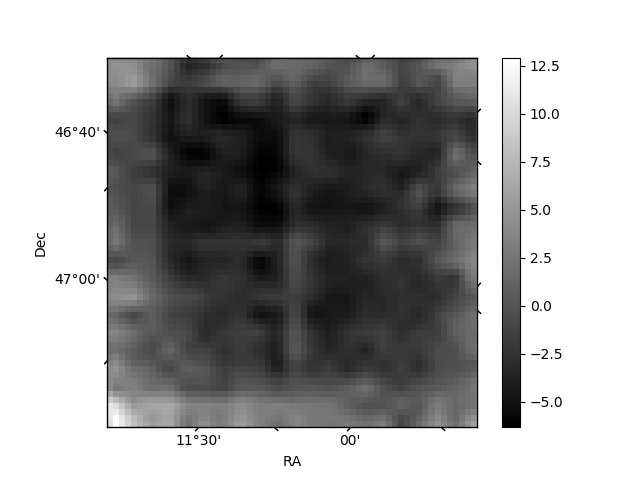
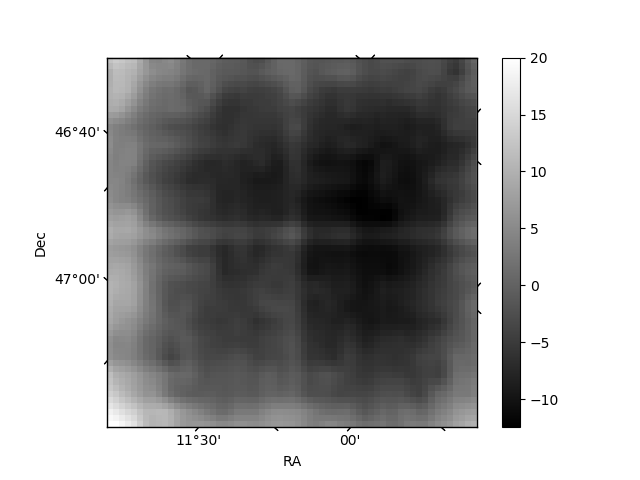
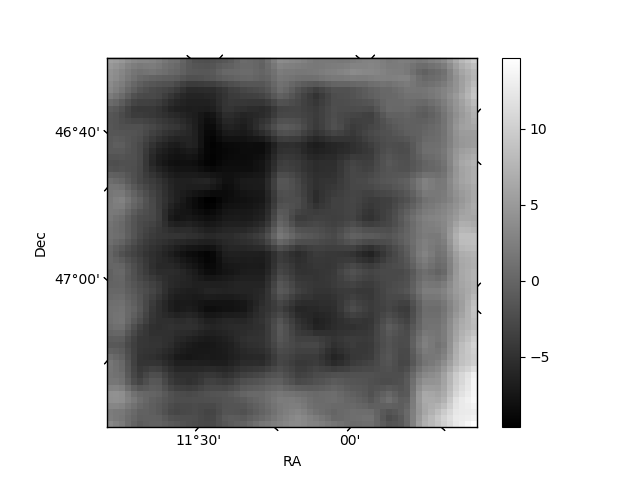
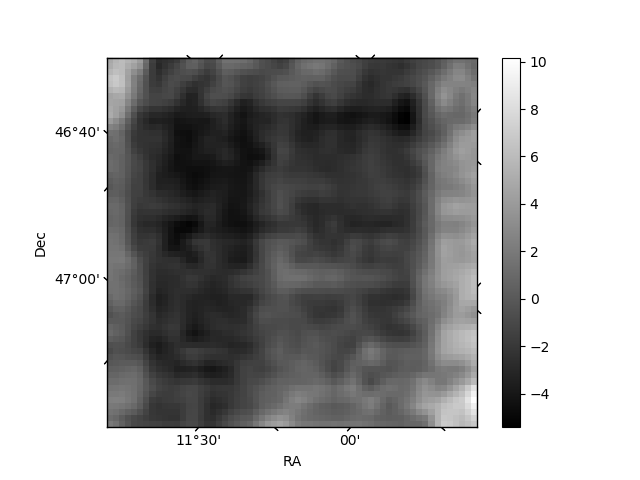
Histogram calculated using DETX and DETY for each event in the final _common_clean file
| Quadrant A | 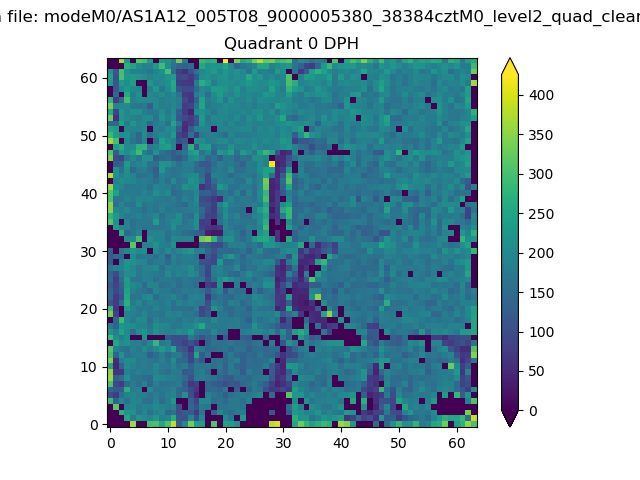 |
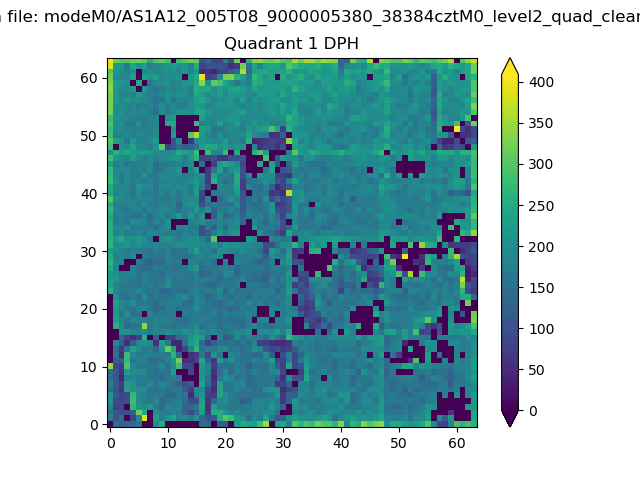 |
Quadrant B |
|---|---|---|---|
| Quadrant D | 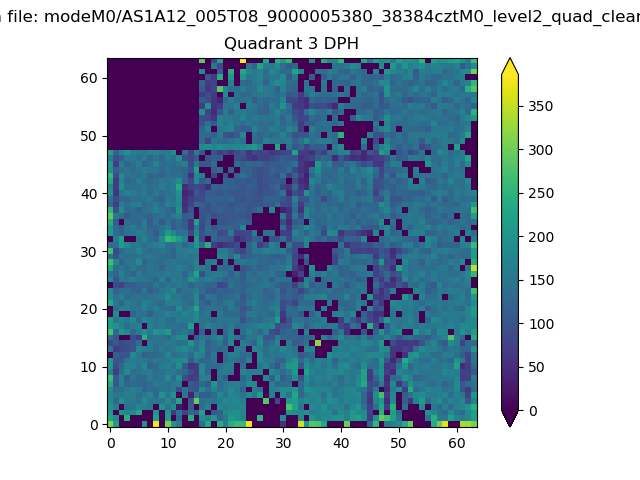 |
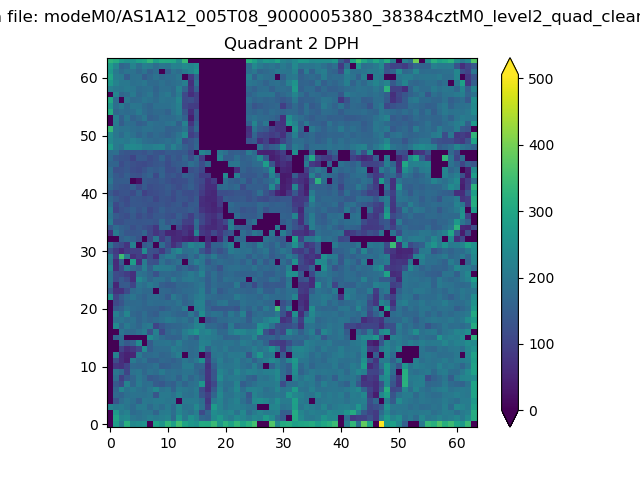 |
Quadrant C |
| Plot type | Count rate plots | Images |
|---|---|---|
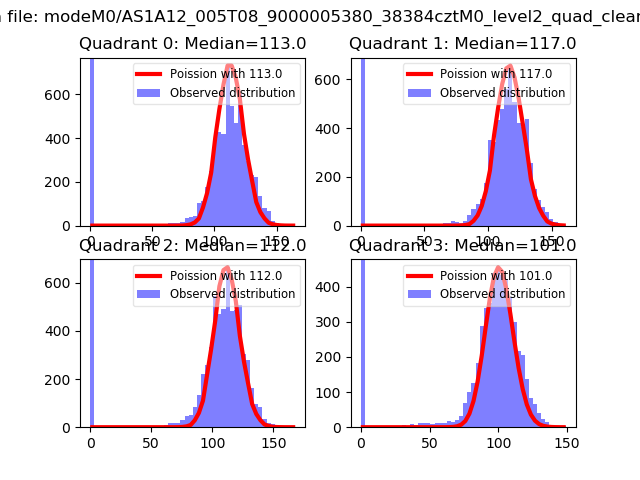
| Comparison with Poisson distribution Blue bars denote a histogram of data divided into 1 sec bins. Red curve is a Poisson curve with rate = median count rate of data. |
 |
 |
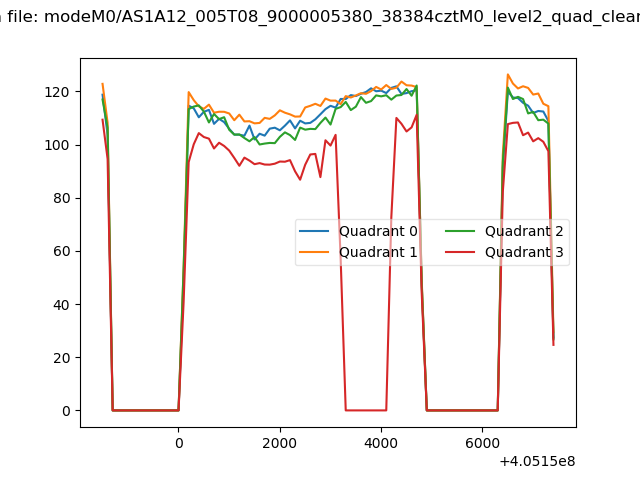
| Quadrant-wise count rates Data is divided into 100 sec bins |
 |
|
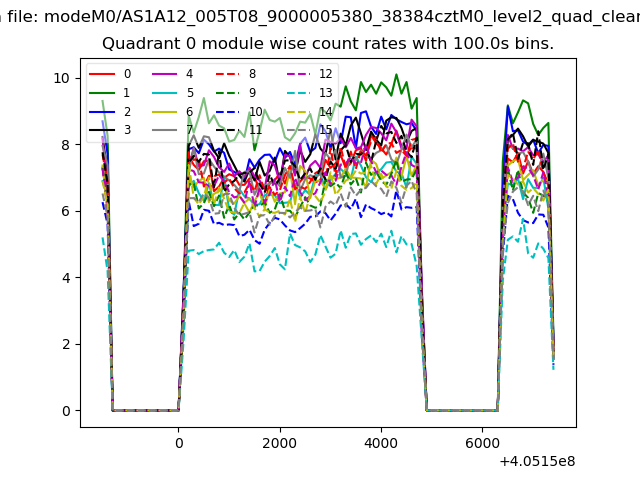
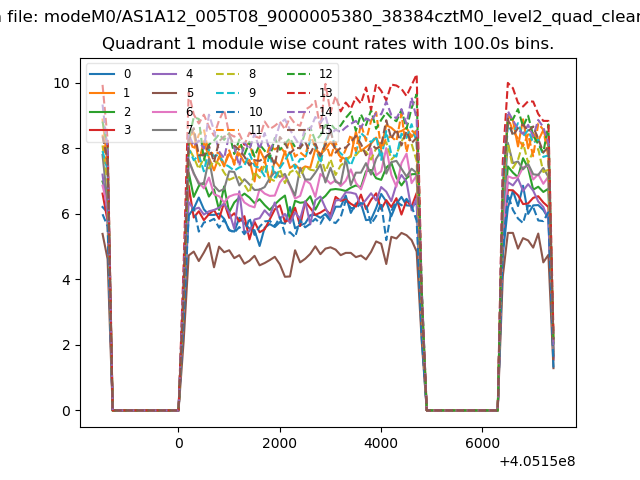
| Module-wise count rates for Quadrant A Data is divided into 100 sec bins |
 |
 |
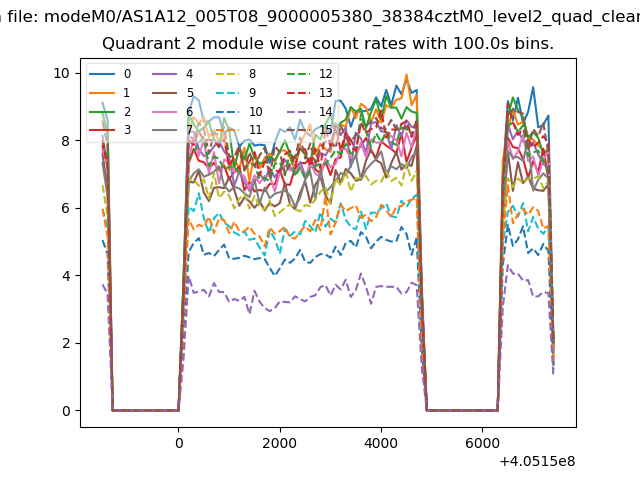
| Module-wise count rates for Quadrant B Data is divided into 100 sec bins |
 |
 |
| Module-wise count rates for Quadrant C Data is divided into 100 sec bins |
 |
 |
| Module-wise count rates for Quadrant D Data is divided into 100 sec bins |
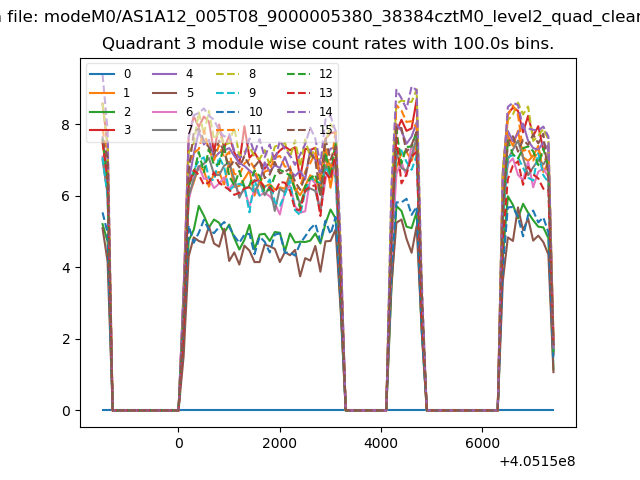 |
 |
| Parameter | Plot |
|---|---|
| CZT HV Monitor | 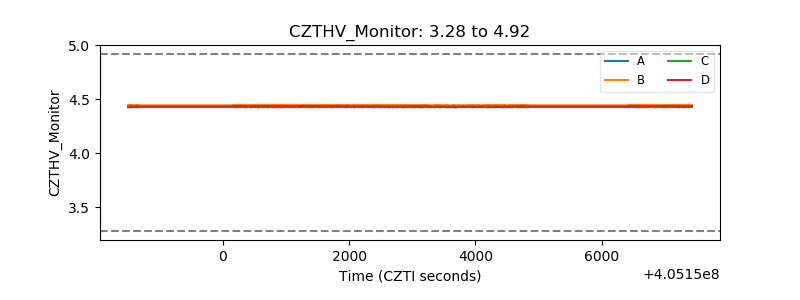 |
| D_VDD | 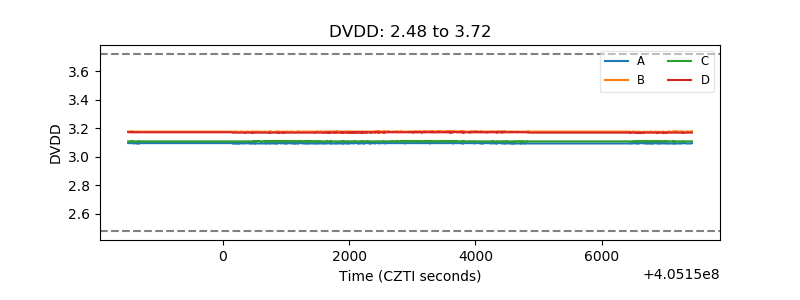 |
| Temperature 1 | 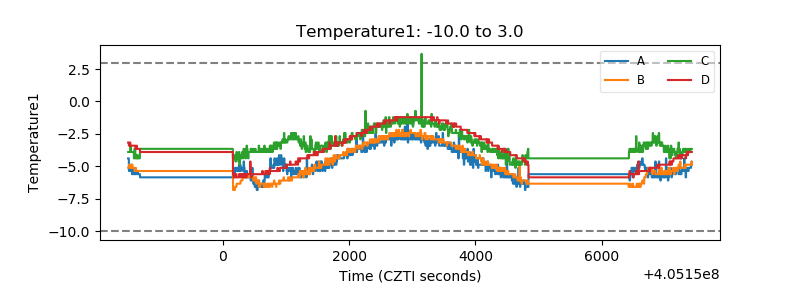 |
| Veto HV Monitor |  |
| Veto LLD | 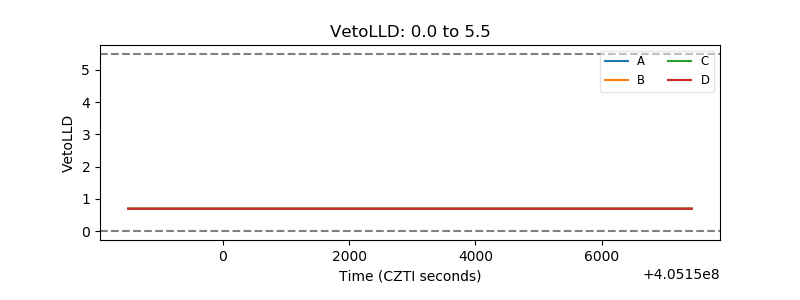 |
| Alpha Counter | 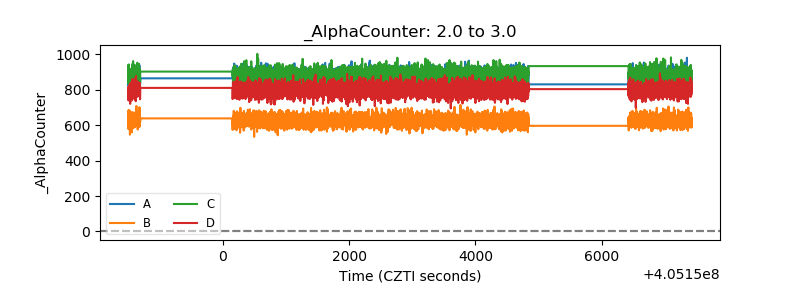 |
| _CPM_Rate | 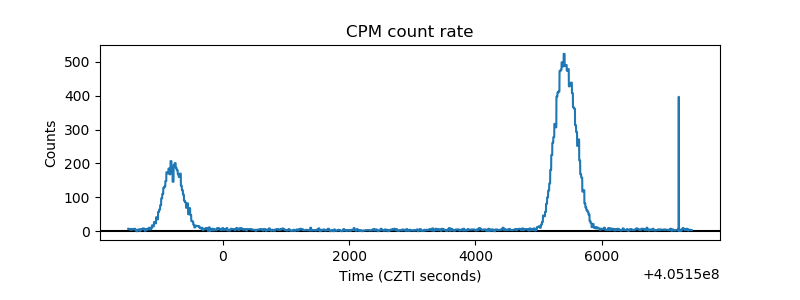 |
| CZT Counter | 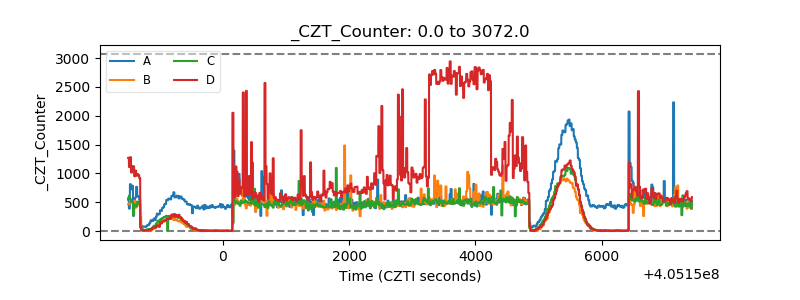 |
| +2.5 Volts monitor | 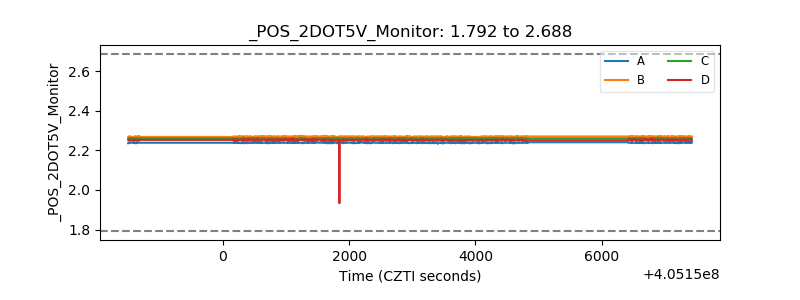 |
| +5 Volts monitor | 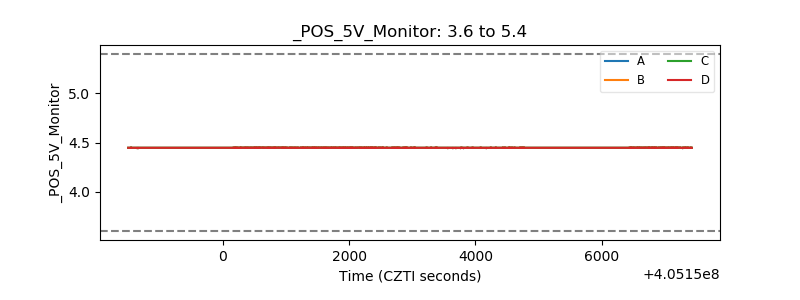 |
| _ROLL_ROT | 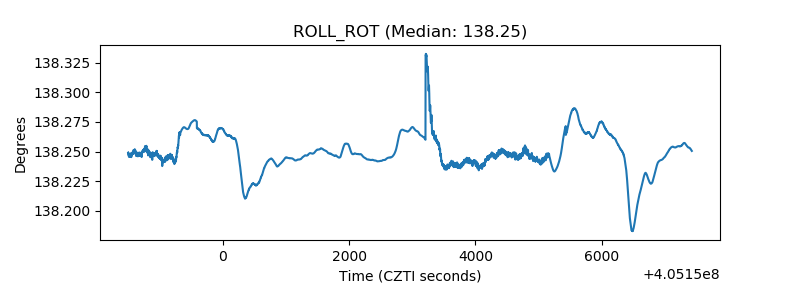 |
| _Roll_DEC | 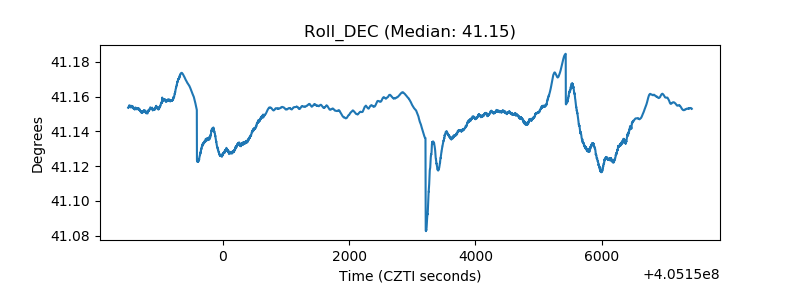 |
| _Roll_RA | 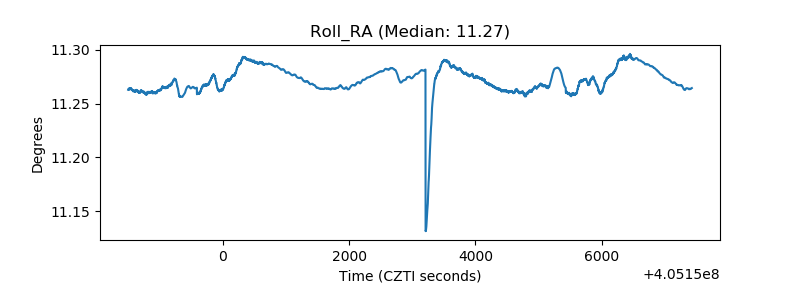 |
| Veto Counter | 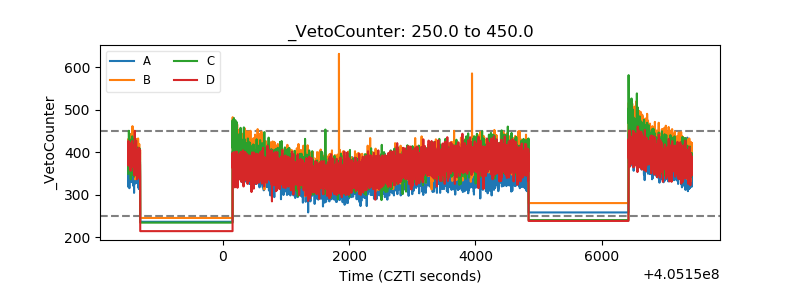 |