| Param | Original file | Final file |
|---|---|---|
| Filename | modeM0/AS1A12_005T08_9000005380_38385cztM0_level2.fits | modeM0/AS1A12_005T08_9000005380_38385cztM0_level2_quad_clean.evt |
| Size (bytes) | 395,784,000 | 89,568,000 |
| Size | 377.4 MB | 85.4 MB |
| Events in quadrant A | 3,000,315 | 618,492 |
| Events in quadrant B | 4,270,604 | 567,936 |
| Events in quadrant C | 2,594,103 | 604,468 |
| Events in quadrant D | 4,372,262 | 548,950 |
| Mode M0 | |||
|---|---|---|---|
| Quadrant | BADHDUFLAG | Total packets | Discarded packets |
| A | 0 | 12189 | 3 |
| B | 0 | 16071 | 2 |
| C | 0 | 10788 | 2 |
| D | 0 | 16764 | 2 |
| Mode M9 | |||
|---|---|---|---|
| Quadrant | BADHDUFLAG | Total packets | Discarded packets |
| A | 0 | 28 | 0 |
| B | 0 | 28 | 0 |
| C | 0 | 28 | 0 |
| D | 0 | 29 | 0 |
| Mode SS | |||
|---|---|---|---|
| Quadrant | BADHDUFLAG | Total packets | Discarded packets |
| A | 0 | 108 | 0 |
| B | 0 | 108 | 0 |
| C | 0 | 108 | 0 |
| D | 0 | 108 | 0 |
| Quadrant | Total seconds | Saturated seconds | Saturation percentage |
|---|---|---|---|
| A | 5317 | 33 | 0.620651% |
| B | 5317 | 692 | 13.014858% |
| C | 5317 | 9 | 0.169268% |
| D | 5317 | 109 | 2.050028% |
Noise dominated data is calculated using 1-second bins in cleaned event files. If a bin has >2000 counts, and if more than 50% of those come from <1% of pixels, then it is considered to be noise-dominated and hence unusable.
| Quadrant | # 1 sec bins | Bins with >0 counts | Bins with >2000 counts | High rate bins dominated by noise | Noise dominated (total time) | Noise dominated (detector-on time) | Marked lightcurve |
|---|---|---|---|---|---|---|---|
| A | 7050 | 5318 | 15 | 15 | 0.21% | 0.28% | 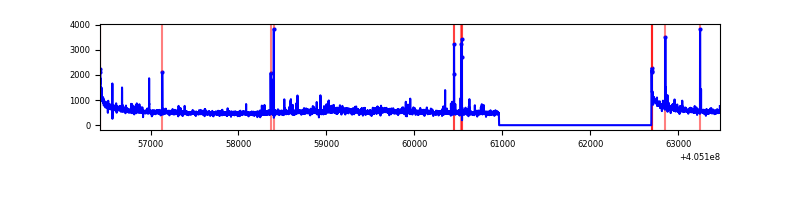 |
| B | 7050 | 5318 | 517 | 517 | 7.33% | 9.72% | 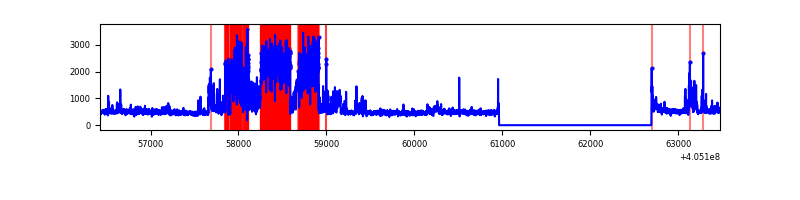 |
| C | 7050 | 5318 | 2 | 2 | 0.03% | 0.04% | 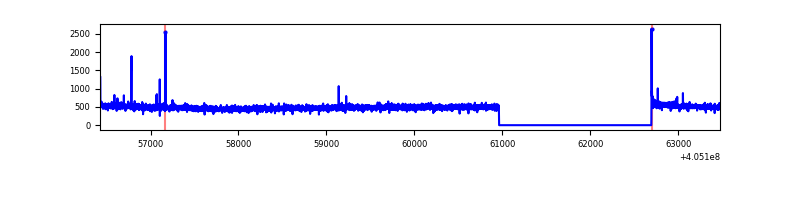 |
| D | 7050 | 5318 | 81 | 81 | 1.15% | 1.52% | 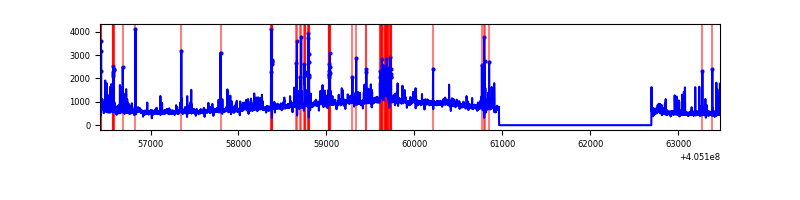 |
Top three noisy pixels from each quadrant. If the there are fewer than three noisy pixels in the level2.evt file, extra rows are filled as -1
| Pixel properties | Quadrant properties | ||||||
|---|---|---|---|---|---|---|---|
| Quadrant | DetID | PixID | Counts | Sigma | Mean | Median | Sigma |
| A | 10 | 83 | 382559 | 3037.82 | 618 | 607 | 125.7 |
| A | 12 | 189 | 111742 | 883.9 | 618 | 607 | 125.7 |
| A | 9 | 143 | 70863 | 558.77 | 618 | 607 | 125.7 |
| B | 0 | 183 | 1800338 | 15709.96 | 589 | 574 | 114.6 |
| B | 4 | 21 | 114865 | 997.63 | 589 | 574 | 114.6 |
| B | 0 | 189 | 15975 | 134.43 | 589 | 574 | 114.6 |
| C | 15 | 214 | 228212 | 1604.8 | 602 | 606 | 141.8 |
| C | 0 | 10 | 11690 | 78.15 | 602 | 606 | 141.8 |
| C | 2 | 16 | 5683 | 35.8 | 602 | 606 | 141.8 |
| D | 10 | 203 | 1332229 | 9137.35 | 596 | 579 | 145.7 |
| D | 1 | 20 | 209902 | 1436.3 | 596 | 579 | 145.7 |
| D | 2 | 250 | 173330 | 1185.36 | 596 | 579 | 145.7 |
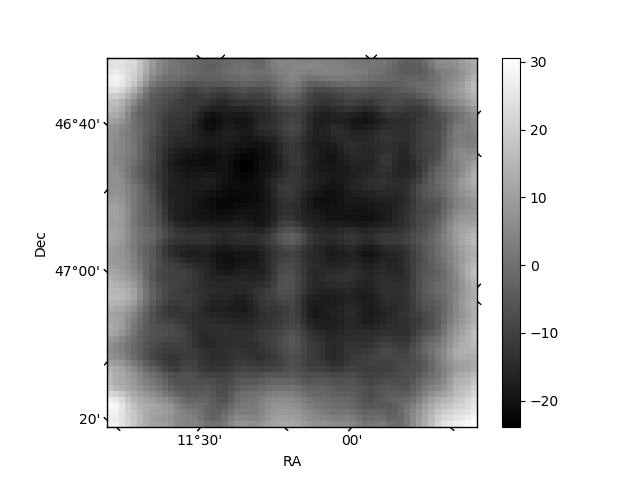
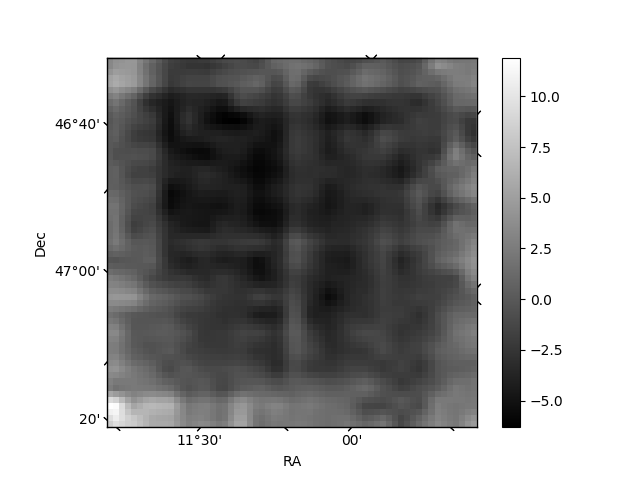
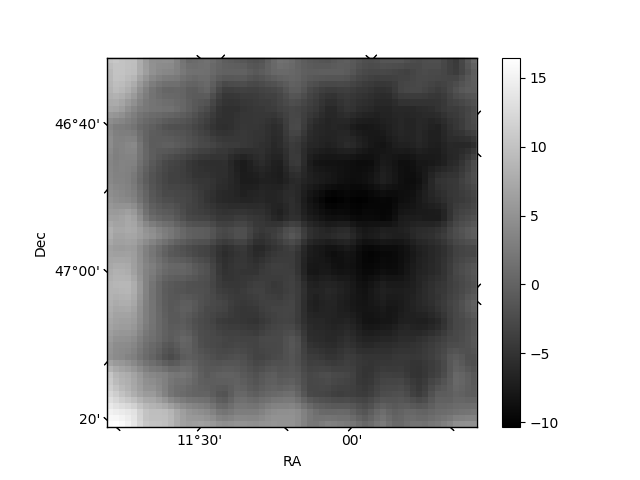
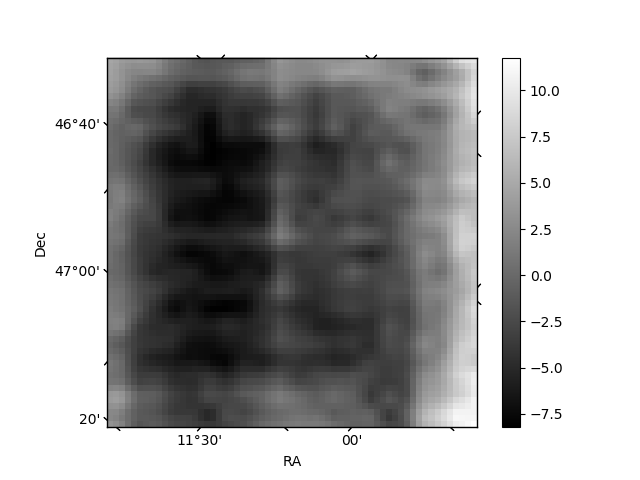
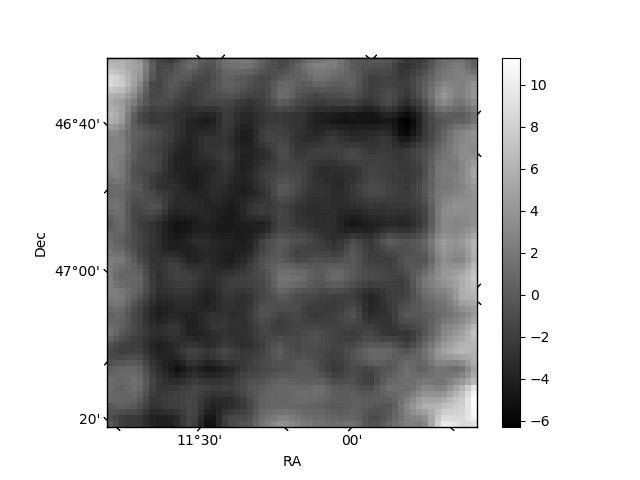
Histogram calculated using DETX and DETY for each event in the final _common_clean file
| Quadrant A | 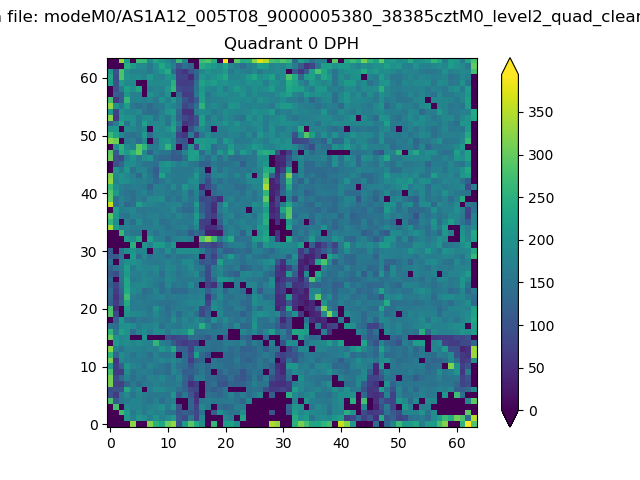 |
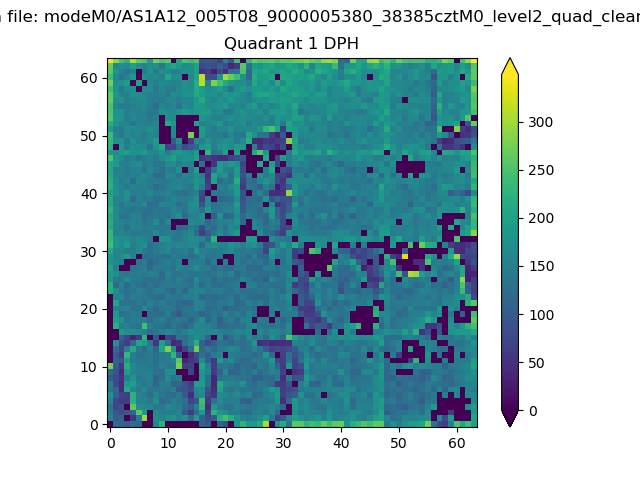 |
Quadrant B |
|---|---|---|---|
| Quadrant D | 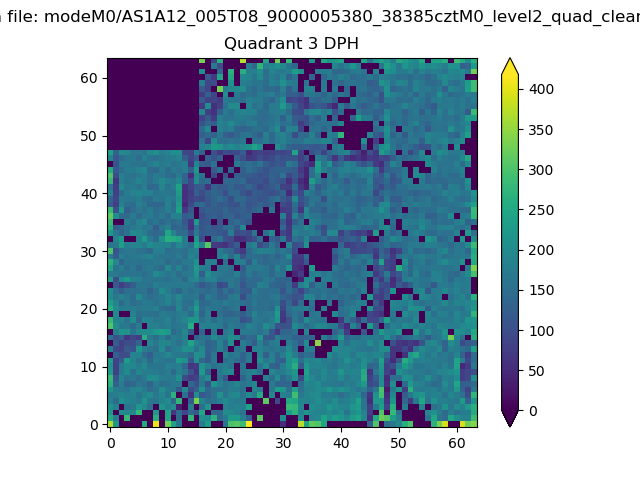 |
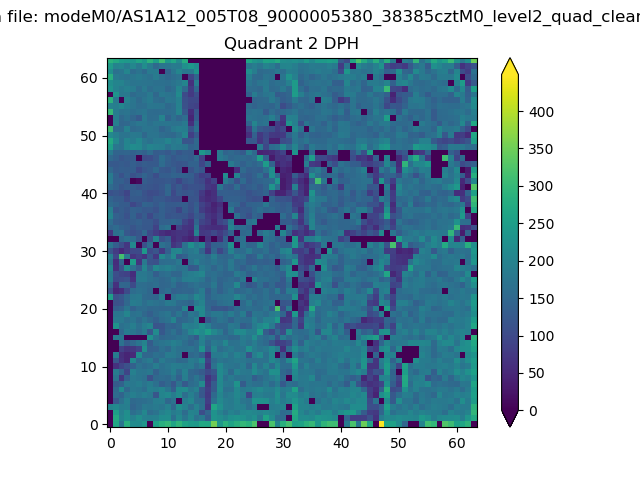 |
Quadrant C |
| Plot type | Count rate plots | Images |
|---|---|---|
| Comparison with Poisson distribution Blue bars denote a histogram of data divided into 1 sec bins. Red curve is a Poisson curve with rate = median count rate of data. |
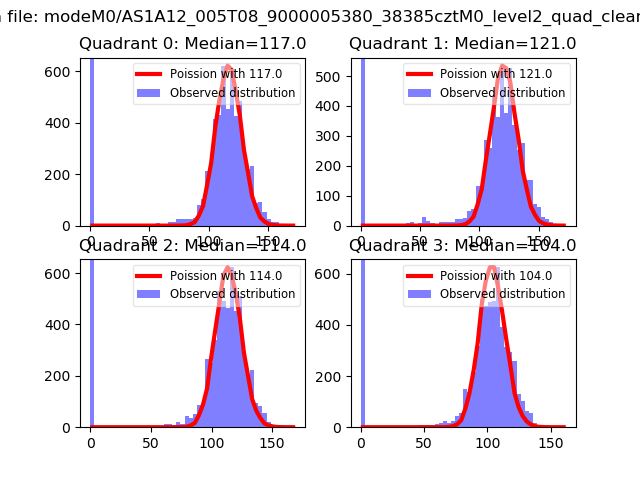 |
 |
| Quadrant-wise count rates Data is divided into 100 sec bins |
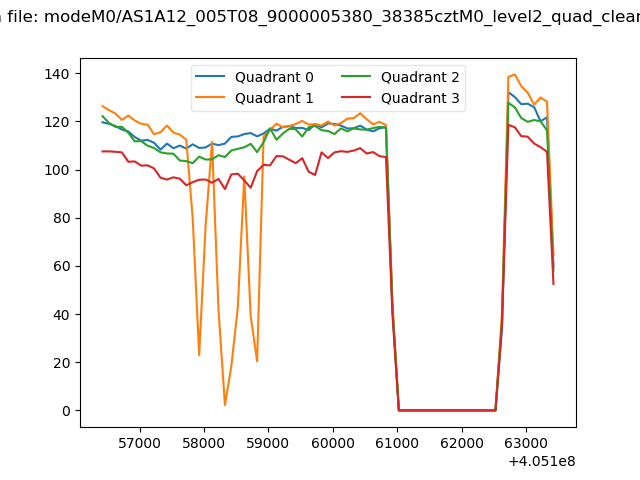 |
|
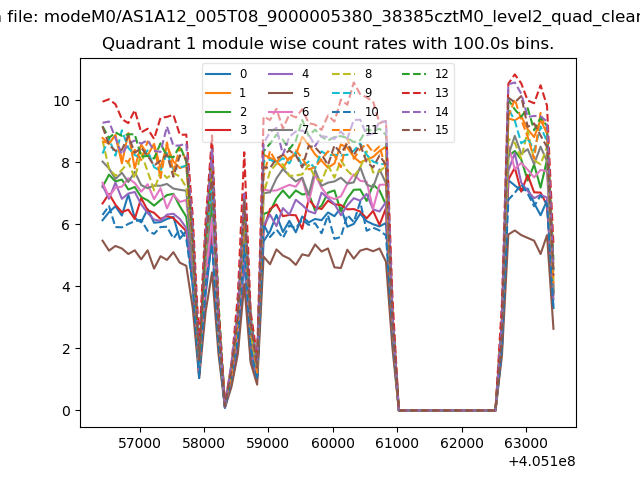
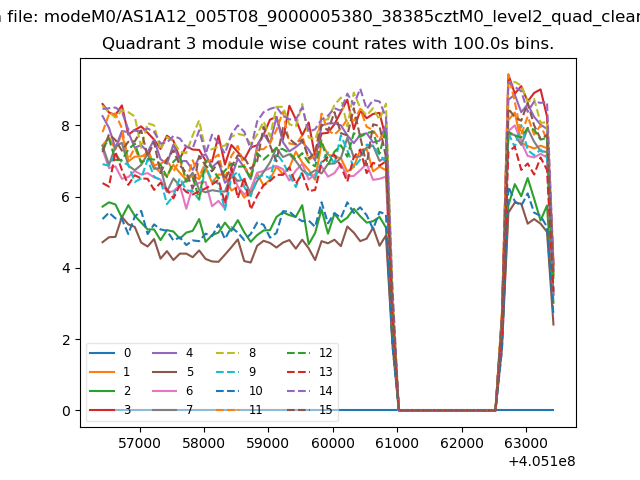
| Module-wise count rates for Quadrant A Data is divided into 100 sec bins |
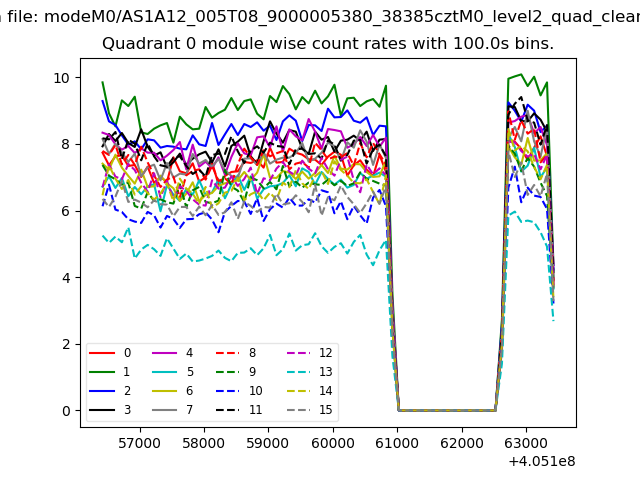 |
 |
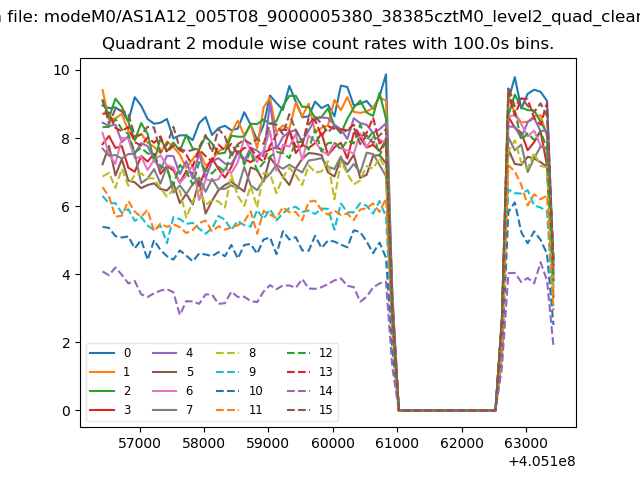
| Module-wise count rates for Quadrant B Data is divided into 100 sec bins |
 |
 |
| Module-wise count rates for Quadrant C Data is divided into 100 sec bins |
 |
 |
| Module-wise count rates for Quadrant D Data is divided into 100 sec bins |
 |
 |
| Parameter | Plot |
|---|---|
| CZT HV Monitor | 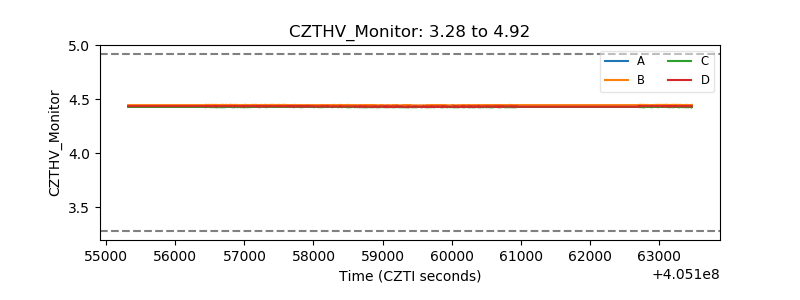 |
| D_VDD | 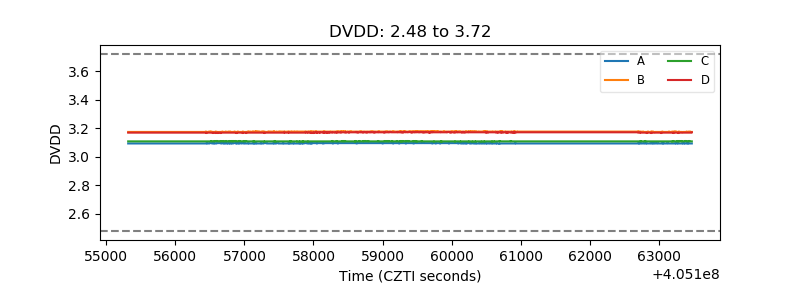 |
| Temperature 1 | 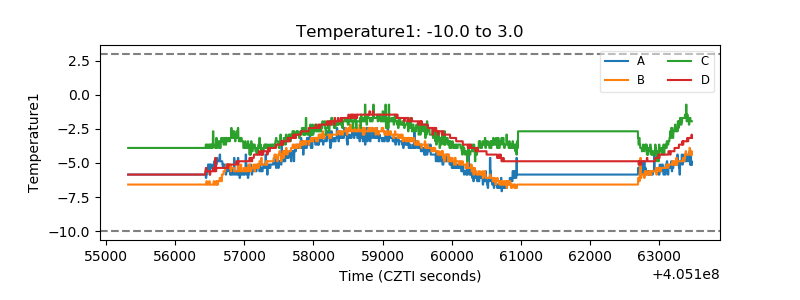 |
| Veto HV Monitor | 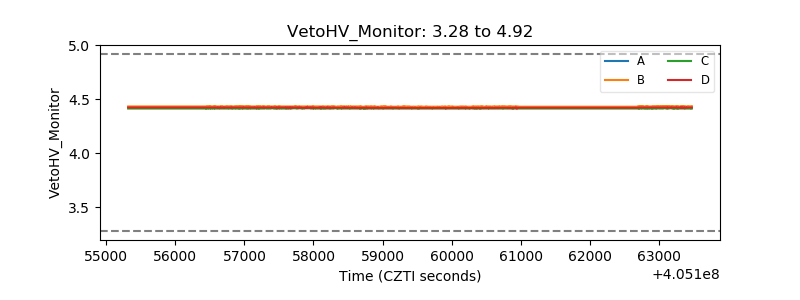 |
| Veto LLD | 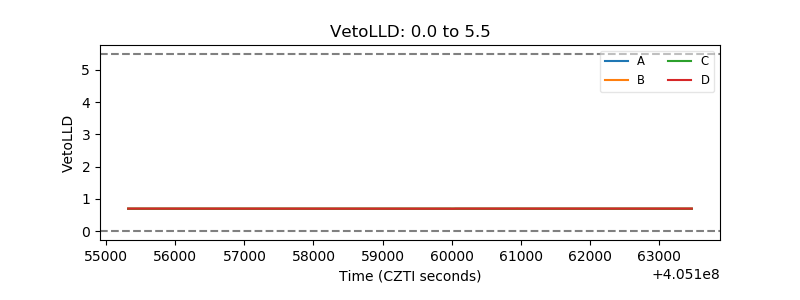 |
| Alpha Counter | 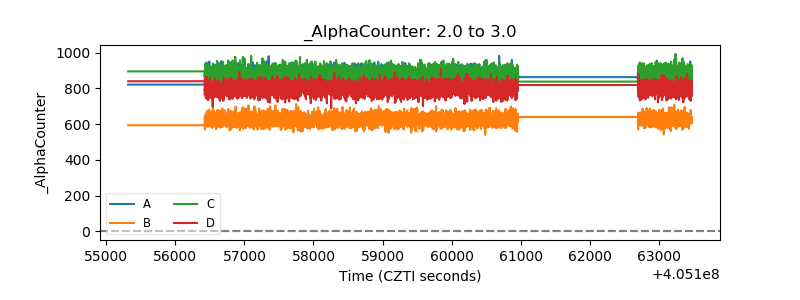 |
| _CPM_Rate | 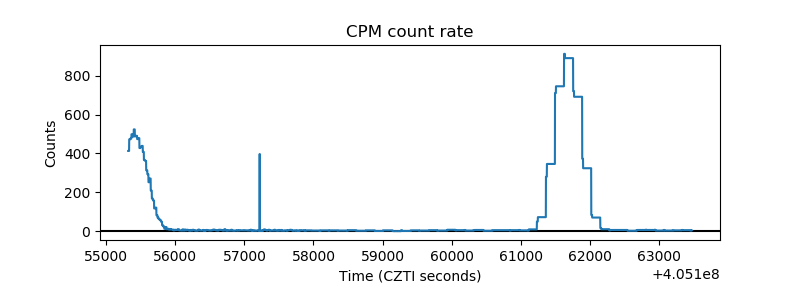 |
| CZT Counter | 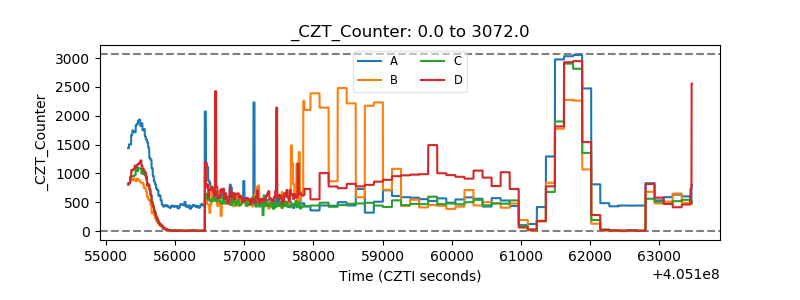 |
| +2.5 Volts monitor | 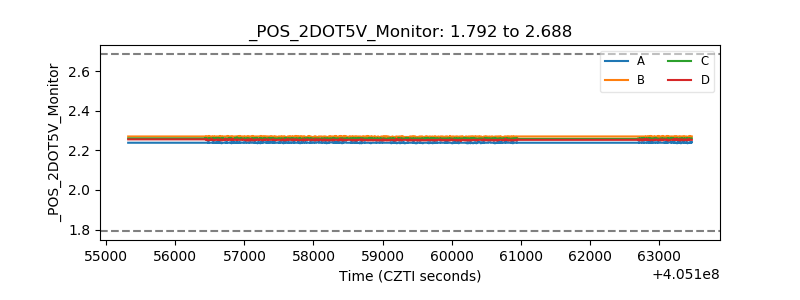 |
| +5 Volts monitor | 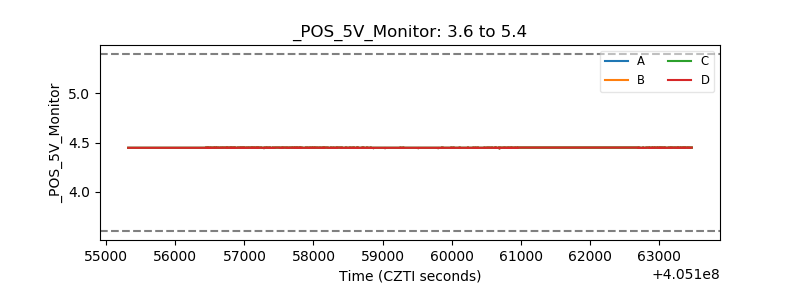 |
| _ROLL_ROT | 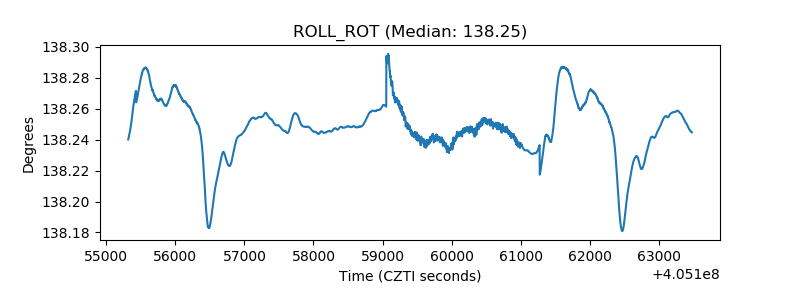 |
| _Roll_DEC | 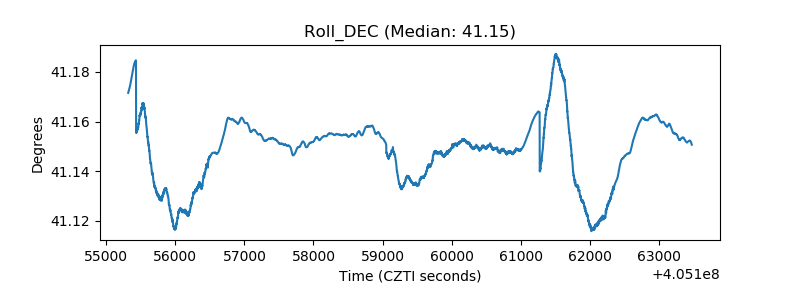 |
| _Roll_RA | 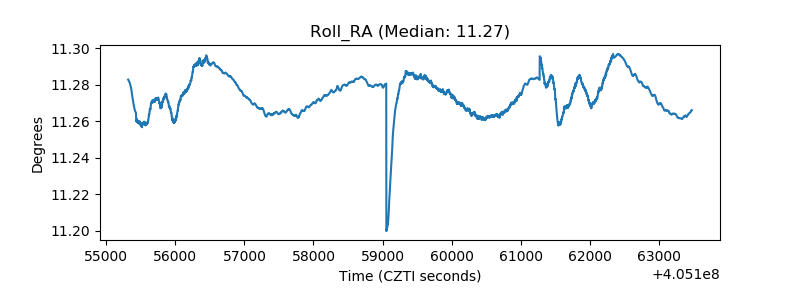 |
| Veto Counter | 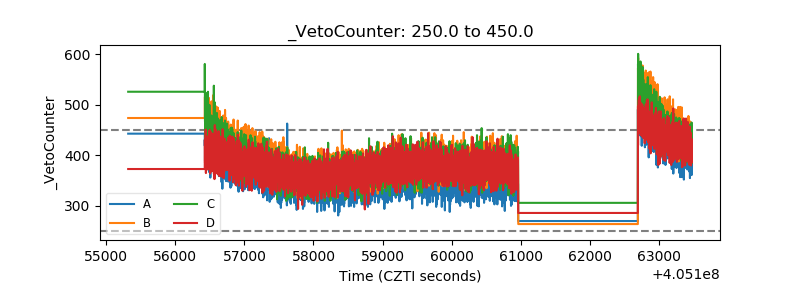 |