| Param | Original file | Final file |
|---|---|---|
| Filename | modeM0/AS1A12_005T08_9000005380_38387cztM0_level2.fits | modeM0/AS1A12_005T08_9000005380_38387cztM0_level2_quad_clean.evt |
| Size (bytes) | 400,213,440 | 111,602,880 |
| Size | 381.7 MB | 106.4 MB |
| Events in quadrant A | 3,519,433 | 761,339 |
| Events in quadrant B | 3,916,267 | 778,791 |
| Events in quadrant C | 3,083,863 | 736,018 |
| Events in quadrant D | 3,814,922 | 672,039 |
| Mode M0 | |||
|---|---|---|---|
| Quadrant | BADHDUFLAG | Total packets | Discarded packets |
| A | 0 | 14182 | 3 |
| B | 0 | 15617 | 2 |
| C | 0 | 12643 | 2 |
| D | 0 | 15038 | 2 |
| Mode M9 | |||
|---|---|---|---|
| Quadrant | BADHDUFLAG | Total packets | Discarded packets |
| A | 0 | 36 | 0 |
| B | 0 | 36 | 0 |
| C | 0 | 36 | 0 |
| D | 0 | 36 | 0 |
| Mode SS | |||
|---|---|---|---|
| Quadrant | BADHDUFLAG | Total packets | Discarded packets |
| A | 0 | 128 | 0 |
| B | 0 | 128 | 0 |
| C | 0 | 128 | 0 |
| D | 0 | 128 | 0 |
| Quadrant | Total seconds | Saturated seconds | Saturation percentage |
|---|---|---|---|
| A | 6177 | 29 | 0.469484% |
| B | 6177 | 69 | 1.117047% |
| C | 6177 | 10 | 0.161891% |
| D | 6177 | 109 | 1.764611% |
Noise dominated data is calculated using 1-second bins in cleaned event files. If a bin has >2000 counts, and if more than 50% of those come from <1% of pixels, then it is considered to be noise-dominated and hence unusable.
| Quadrant | # 1 sec bins | Bins with >0 counts | Bins with >2000 counts | High rate bins dominated by noise | Noise dominated (total time) | Noise dominated (detector-on time) | Marked lightcurve |
|---|---|---|---|---|---|---|---|
| A | 9734 | 6179 | 13 | 13 | 0.13% | 0.21% |  |
| B | 9734 | 6179 | 31 | 31 | 0.32% | 0.50% | 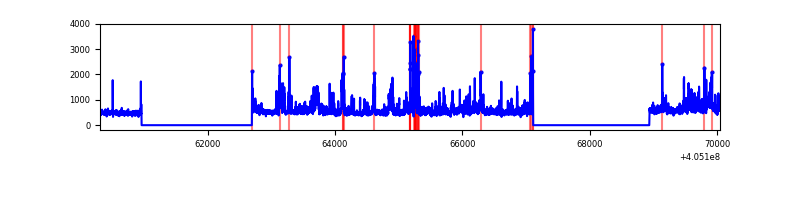 |
| C | 9734 | 6179 | 1 | 1 | 0.01% | 0.02% | 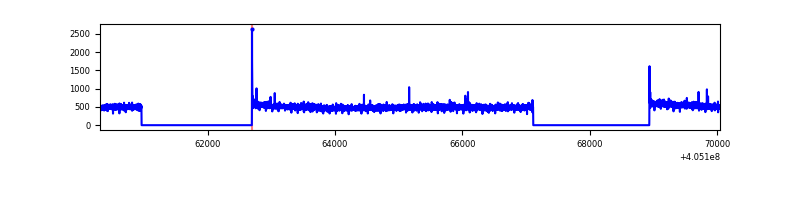 |
| D | 9734 | 6179 | 74 | 74 | 0.76% | 1.20% | 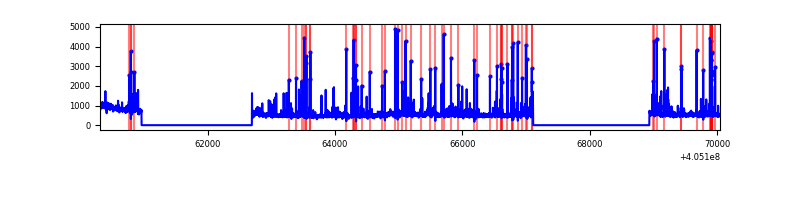 |
Top three noisy pixels from each quadrant. If the there are fewer than three noisy pixels in the level2.evt file, extra rows are filled as -1
| Pixel properties | Quadrant properties | ||||||
|---|---|---|---|---|---|---|---|
| Quadrant | DetID | PixID | Counts | Sigma | Mean | Median | Sigma |
| A | 10 | 83 | 431272 | 2886.27 | 740 | 726 | 149.2 |
| A | 12 | 16 | 122860 | 818.75 | 740 | 726 | 149.2 |
| A | 9 | 143 | 67730 | 449.17 | 740 | 726 | 149.2 |
| B | 0 | 183 | 735675 | 5233.13 | 730 | 708 | 140.4 |
| B | 4 | 21 | 194598 | 1380.54 | 730 | 708 | 140.4 |
| B | 0 | 189 | 49087 | 344.47 | 730 | 708 | 140.4 |
| C | 15 | 214 | 262035 | 1562.03 | 718 | 724 | 167.3 |
| C | 0 | 10 | 12980 | 73.26 | 718 | 724 | 167.3 |
| C | 13 | 61 | 4687 | 23.69 | 718 | 724 | 167.3 |
| D | 10 | 203 | 380544 | 2208.32 | 714 | 696 | 172.0 |
| D | 1 | 20 | 188837 | 1093.79 | 714 | 696 | 172.0 |
| D | 2 | 250 | 117027 | 676.31 | 714 | 696 | 172.0 |
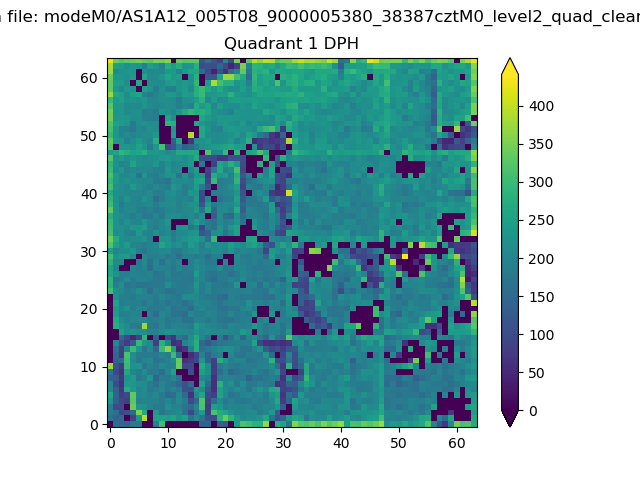
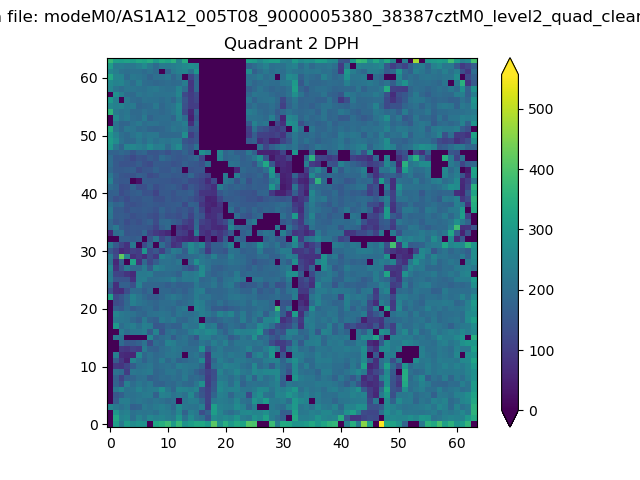
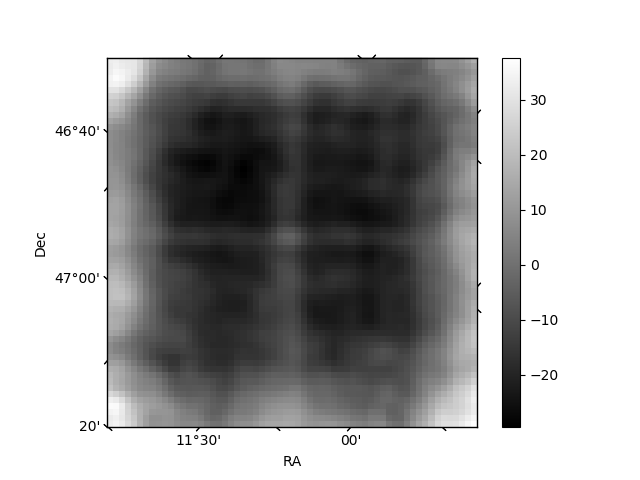
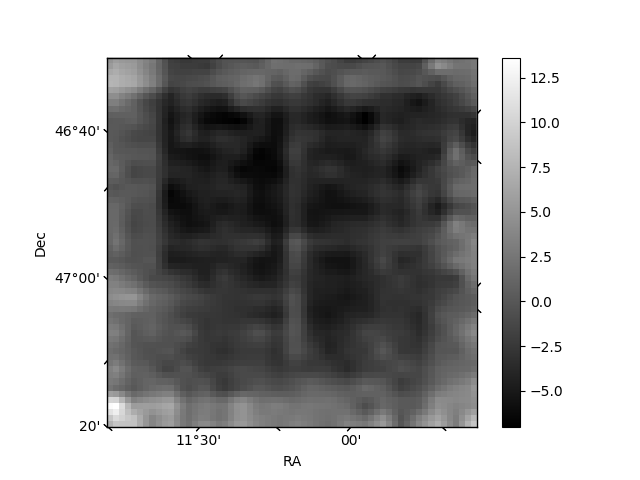
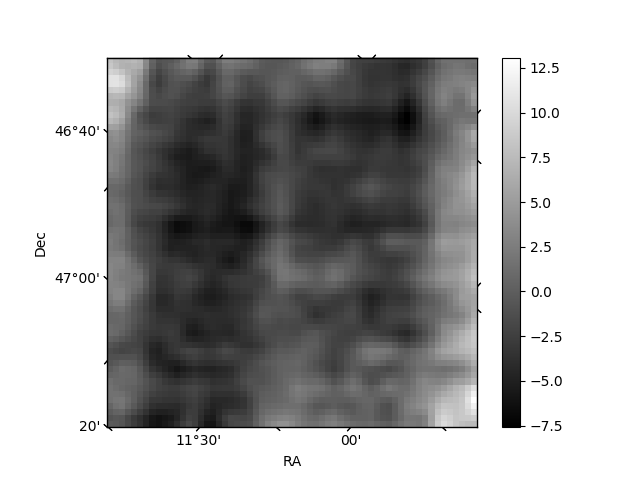
Histogram calculated using DETX and DETY for each event in the final _common_clean file
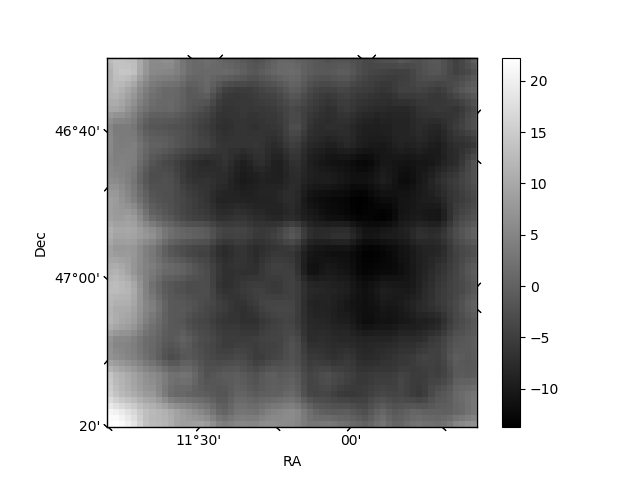
| Quadrant A | 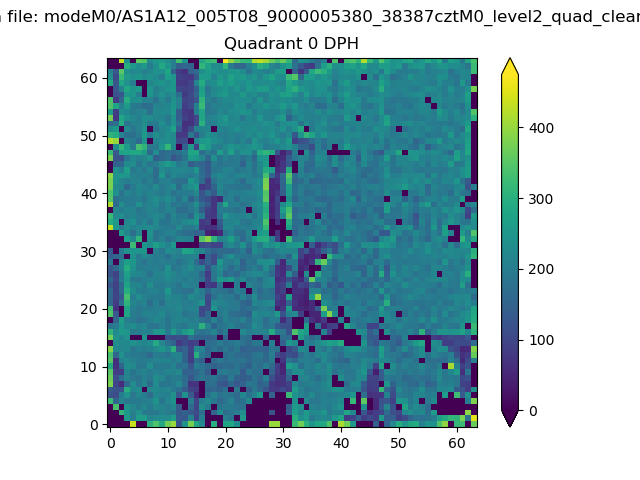 |
 |
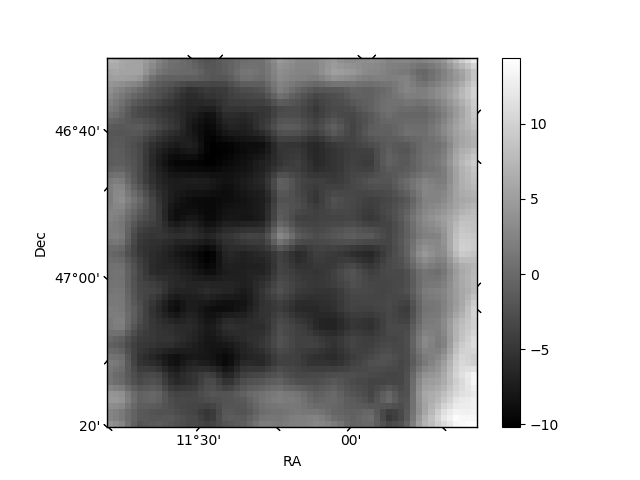
Quadrant B |
|---|---|---|---|
| Quadrant D | 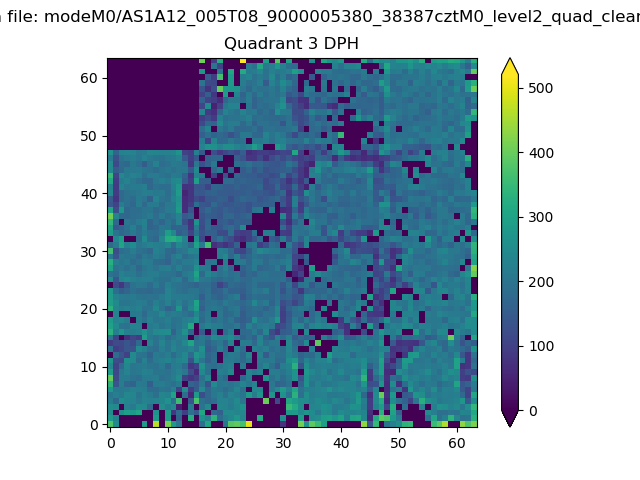 |
 |
Quadrant C |
| Plot type | Count rate plots | Images |
|---|---|---|
| Comparison with Poisson distribution Blue bars denote a histogram of data divided into 1 sec bins. Red curve is a Poisson curve with rate = median count rate of data. |
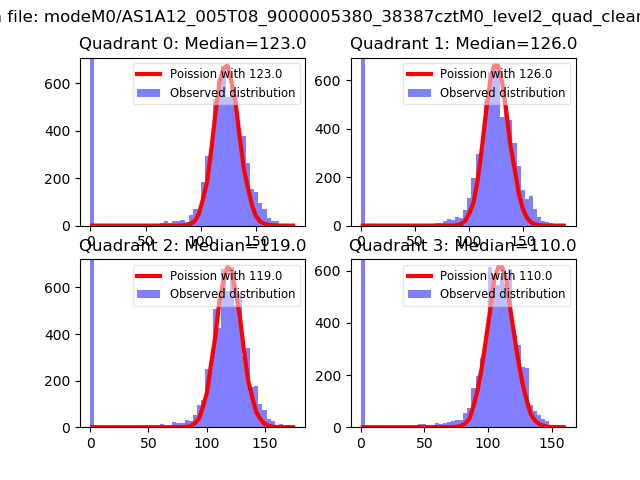 |
 |
| Quadrant-wise count rates Data is divided into 100 sec bins |
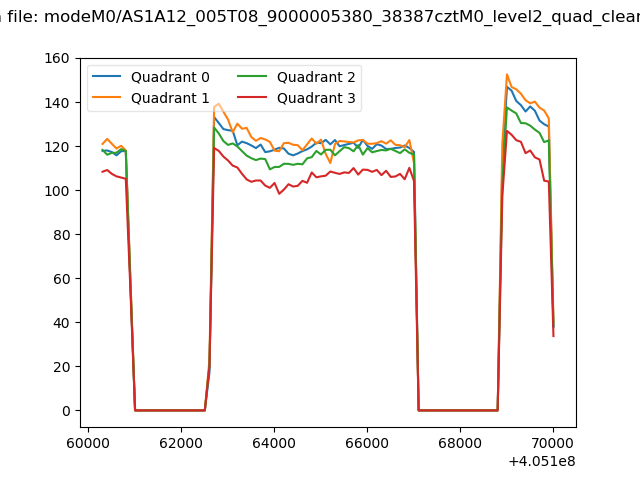 |
|
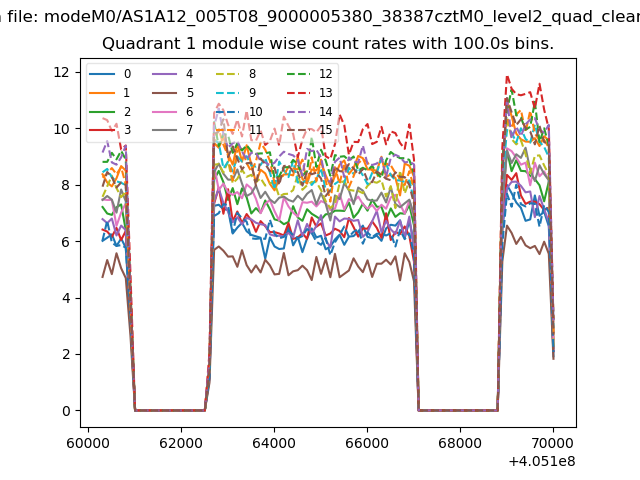
| Module-wise count rates for Quadrant A Data is divided into 100 sec bins |
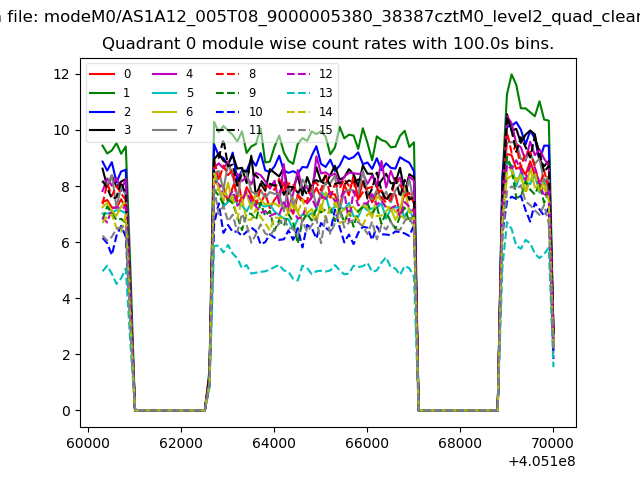 |
 |
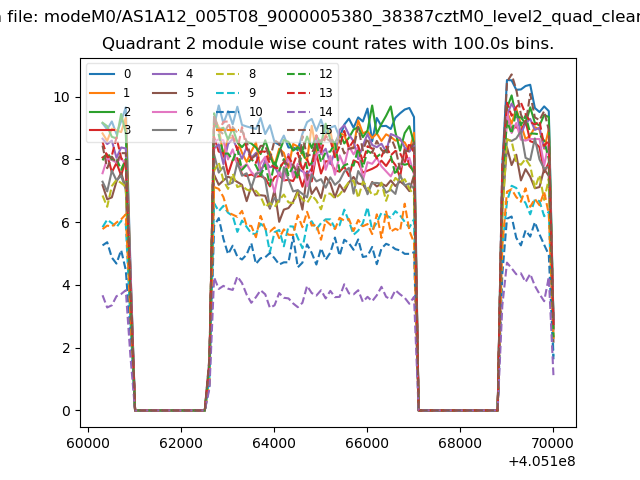
| Module-wise count rates for Quadrant B Data is divided into 100 sec bins |
 |
 |
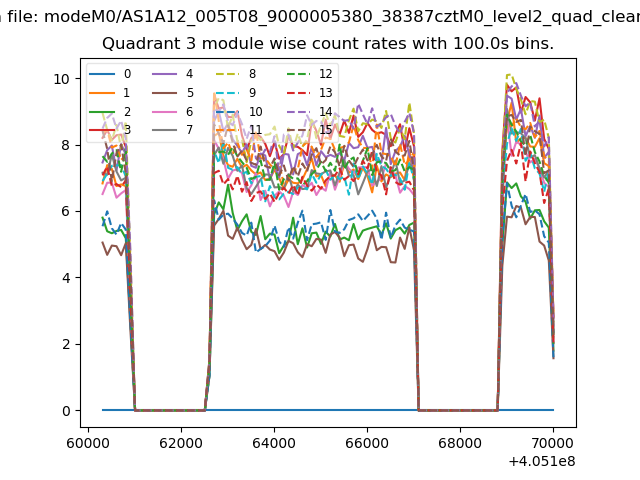
| Module-wise count rates for Quadrant C Data is divided into 100 sec bins |
 |
 |
| Module-wise count rates for Quadrant D Data is divided into 100 sec bins |
 |
 |
| Parameter | Plot |
|---|---|
| CZT HV Monitor | 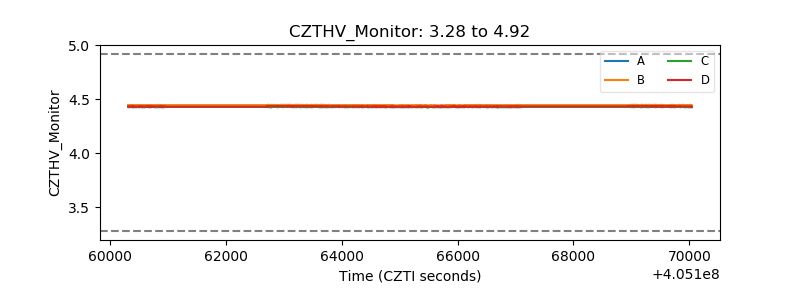 |
| D_VDD | 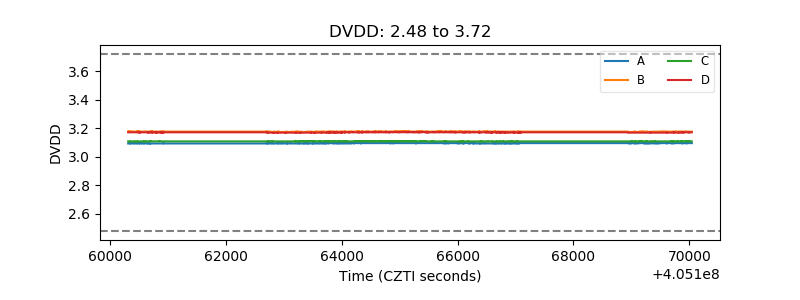 |
| Temperature 1 | 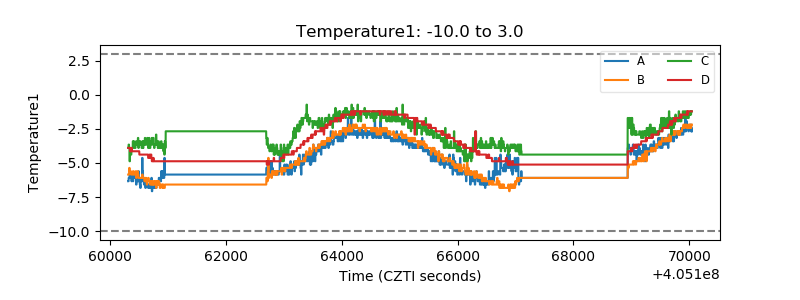 |
| Veto HV Monitor | 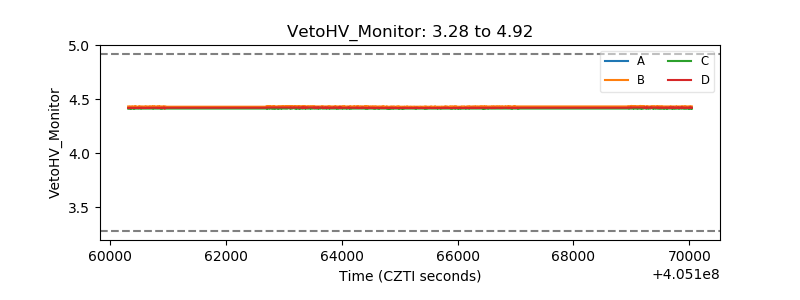 |
| Veto LLD | 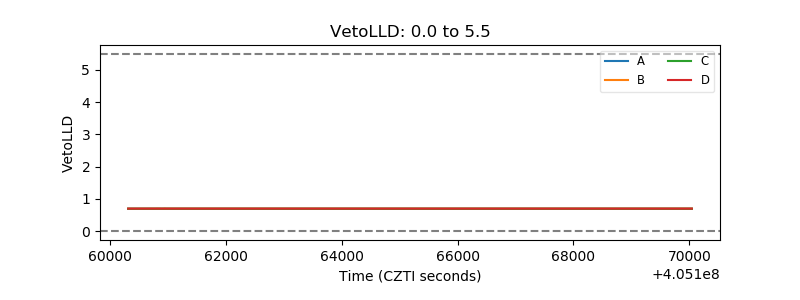 |
| Alpha Counter | 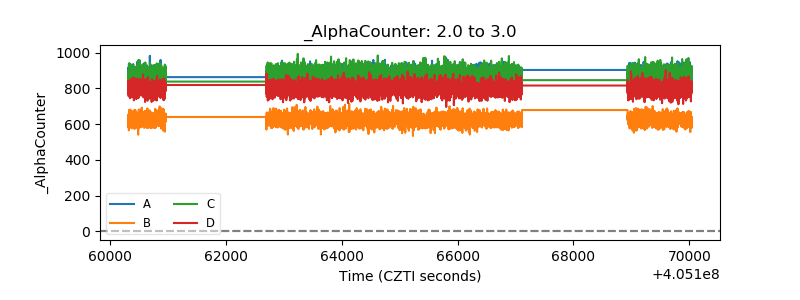 |
| _CPM_Rate | 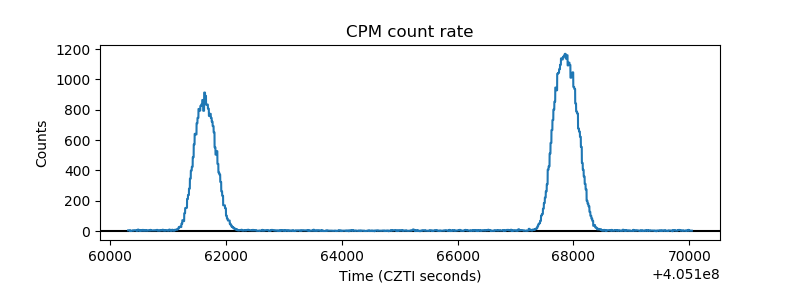 |
| CZT Counter | 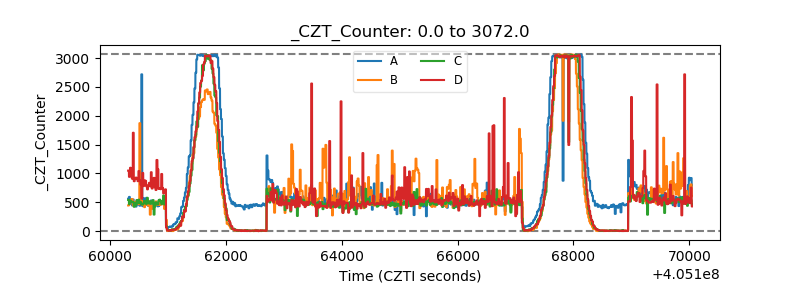 |
| +2.5 Volts monitor |  |
| +5 Volts monitor | 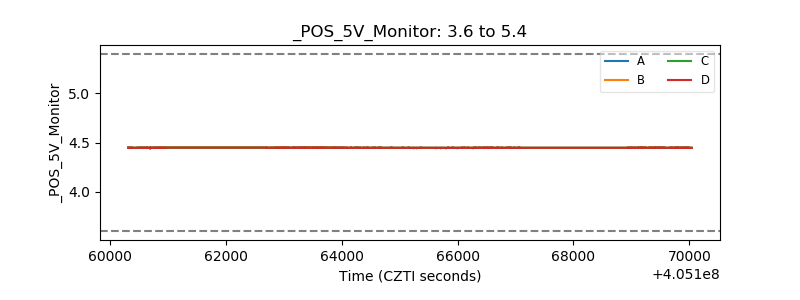 |
| _ROLL_ROT | 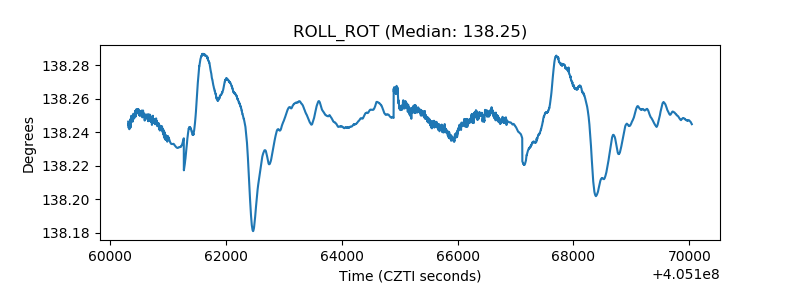 |
| _Roll_DEC | 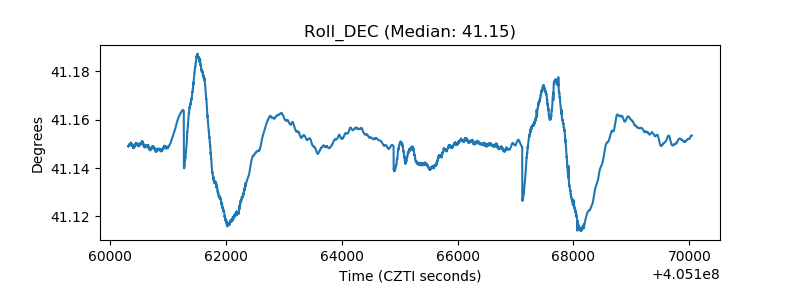 |
| _Roll_RA | 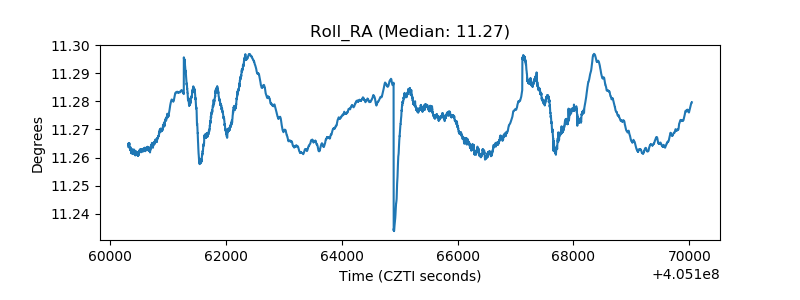 |
| Veto Counter | 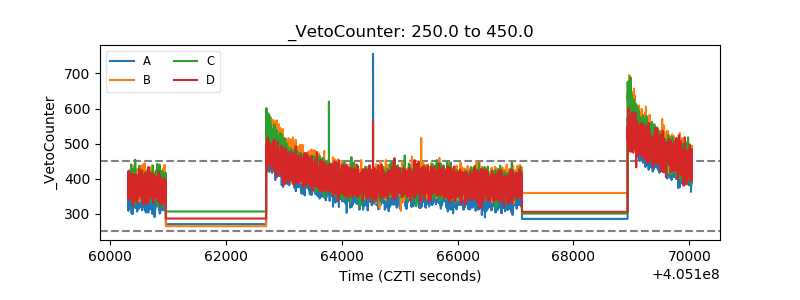 |