| Param | Original file | Final file |
|---|---|---|
| Filename | modeM0/AS1A12_005T08_9000005380_38388cztM0_level2.fits | modeM0/AS1A12_005T08_9000005380_38388cztM0_level2_quad_clean.evt |
| Size (bytes) | 354,355,200 | 103,340,160 |
| Size | 337.9 MB | 98.6 MB |
| Events in quadrant A | 3,249,440 | 712,853 |
| Events in quadrant B | 3,298,622 | 726,297 |
| Events in quadrant C | 2,814,278 | 683,606 |
| Events in quadrant D | 3,332,071 | 626,500 |
| Mode M0 | |||
|---|---|---|---|
| Quadrant | BADHDUFLAG | Total packets | Discarded packets |
| A | 0 | 13103 | 3 |
| B | 0 | 13249 | 2 |
| C | 0 | 11356 | 2 |
| D | 0 | 13067 | 2 |
| Mode M9 | |||
|---|---|---|---|
| Quadrant | BADHDUFLAG | Total packets | Discarded packets |
| A | 0 | 33 | 0 |
| B | 0 | 33 | 0 |
| C | 0 | 33 | 0 |
| D | 0 | 34 | 0 |
| Mode SS | |||
|---|---|---|---|
| Quadrant | BADHDUFLAG | Total packets | Discarded packets |
| A | 0 | 110 | 0 |
| B | 0 | 110 | 0 |
| C | 0 | 110 | 0 |
| D | 0 | 110 | 0 |
| Quadrant | Total seconds | Saturated seconds | Saturation percentage |
|---|---|---|---|
| A | 5434 | 20 | 0.368053% |
| B | 5434 | 23 | 0.423261% |
| C | 5434 | 9 | 0.165624% |
| D | 5434 | 84 | 1.545823% |
Noise dominated data is calculated using 1-second bins in cleaned event files. If a bin has >2000 counts, and if more than 50% of those come from <1% of pixels, then it is considered to be noise-dominated and hence unusable.
| Quadrant | # 1 sec bins | Bins with >0 counts | Bins with >2000 counts | High rate bins dominated by noise | Noise dominated (total time) | Noise dominated (detector-on time) | Marked lightcurve |
|---|---|---|---|---|---|---|---|
| A | 7376 | 5435 | 8 | 8 | 0.11% | 0.15% | 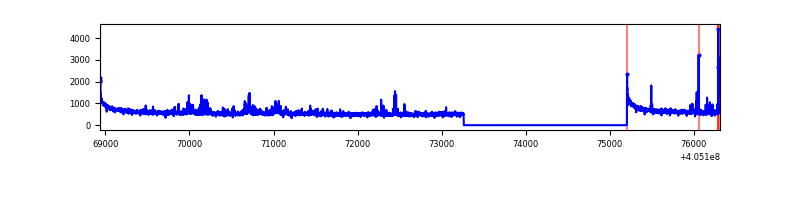 |
| B | 7376 | 5435 | 6 | 6 | 0.08% | 0.11% | 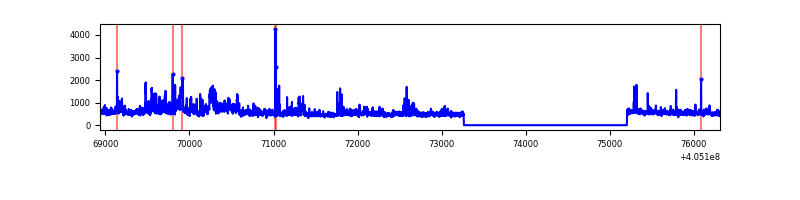 |
| C | 7376 | 5435 | 2 | 2 | 0.03% | 0.04% | 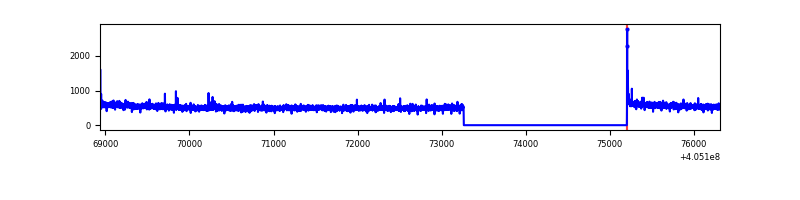 |
| D | 7376 | 5435 | 62 | 62 | 0.84% | 1.14% | 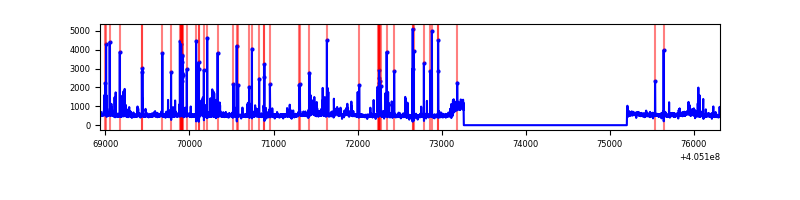 |
Top three noisy pixels from each quadrant. If the there are fewer than three noisy pixels in the level2.evt file, extra rows are filled as -1
| Pixel properties | Quadrant properties | ||||||
|---|---|---|---|---|---|---|---|
| Quadrant | DetID | PixID | Counts | Sigma | Mean | Median | Sigma |
| A | 10 | 83 | 413080 | 3028.24 | 676 | 665 | 136.2 |
| A | 12 | 16 | 128956 | 942.0 | 676 | 665 | 136.2 |
| A | 9 | 143 | 61243 | 444.81 | 676 | 665 | 136.2 |
| B | 0 | 183 | 537390 | 4253.01 | 664 | 646 | 126.2 |
| B | 4 | 21 | 74277 | 583.43 | 664 | 646 | 126.2 |
| B | 15 | 35 | 28148 | 217.92 | 664 | 646 | 126.2 |
| C | 15 | 214 | 231066 | 1529.82 | 652 | 656 | 150.6 |
| C | 0 | 10 | 15807 | 100.6 | 652 | 656 | 150.6 |
| C | 14 | 67 | 15669 | 99.68 | 652 | 656 | 150.6 |
| D | 1 | 20 | 155174 | 985.68 | 652 | 637 | 156.8 |
| D | 12 | 235 | 148139 | 940.8 | 652 | 637 | 156.8 |
| D | 10 | 203 | 132950 | 843.92 | 652 | 637 | 156.8 |
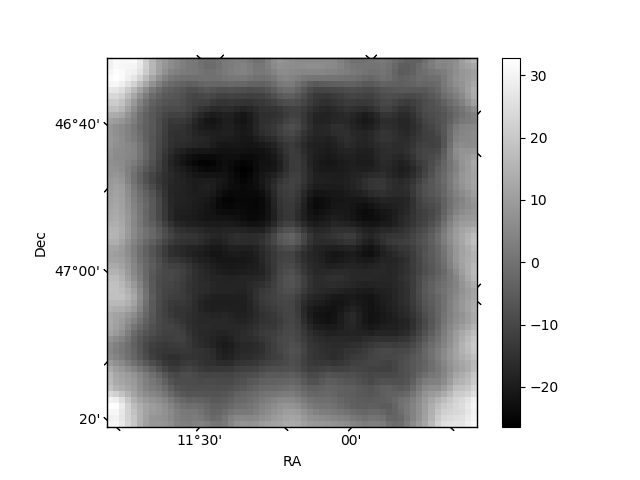
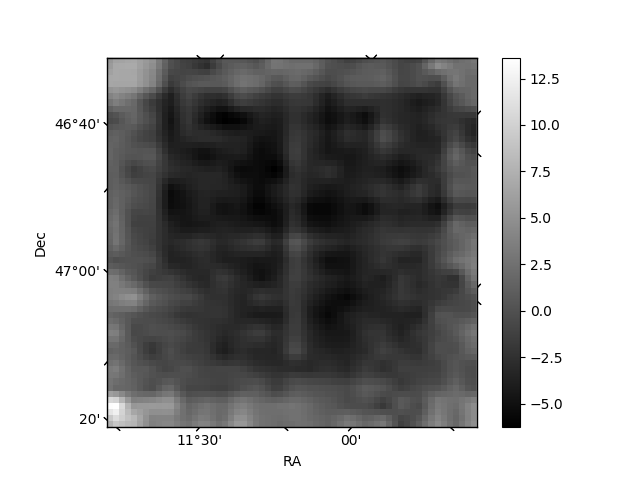
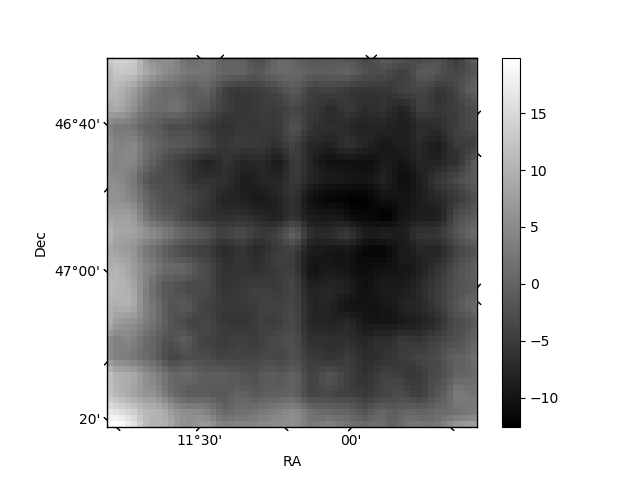
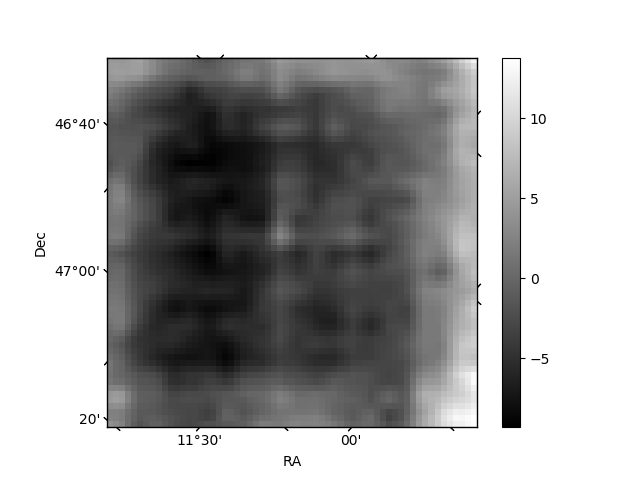
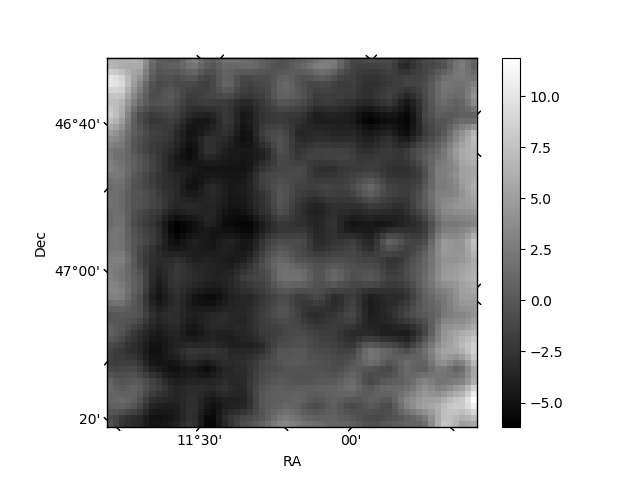
Histogram calculated using DETX and DETY for each event in the final _common_clean file
| Quadrant A | 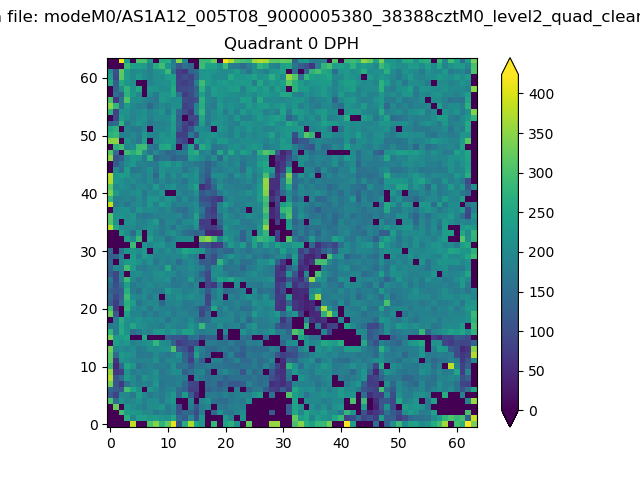 |
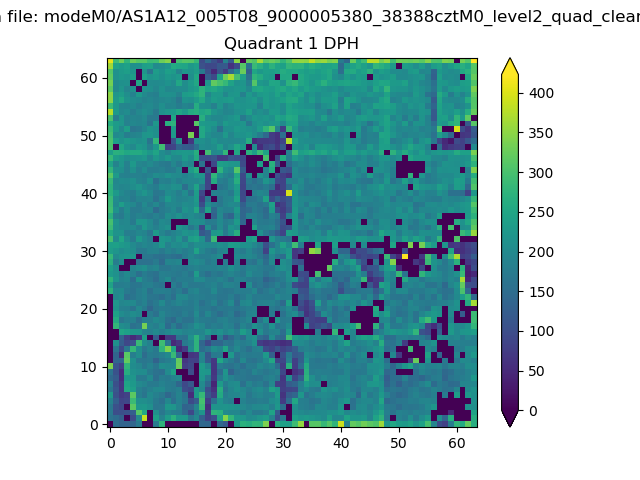 |
Quadrant B |
|---|---|---|---|
| Quadrant D | 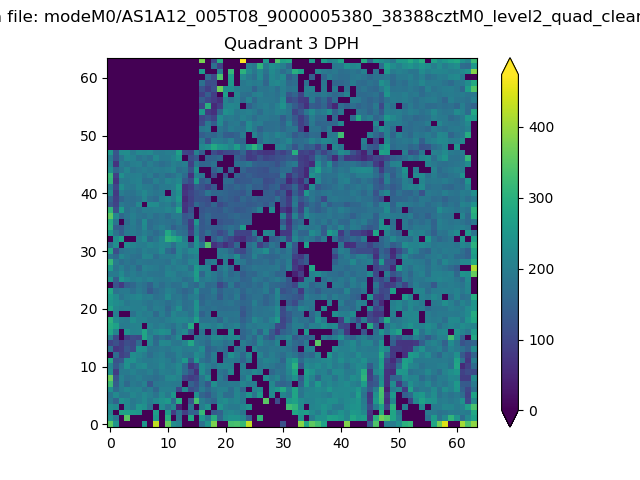 |
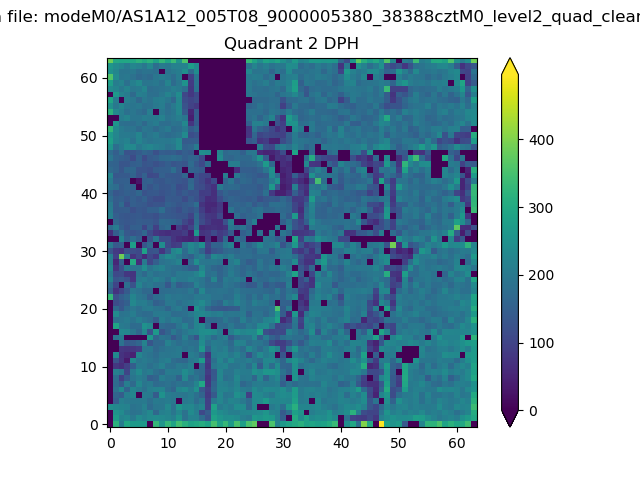 |
Quadrant C |
| Plot type | Count rate plots | Images |
|---|---|---|
| Comparison with Poisson distribution Blue bars denote a histogram of data divided into 1 sec bins. Red curve is a Poisson curve with rate = median count rate of data. |
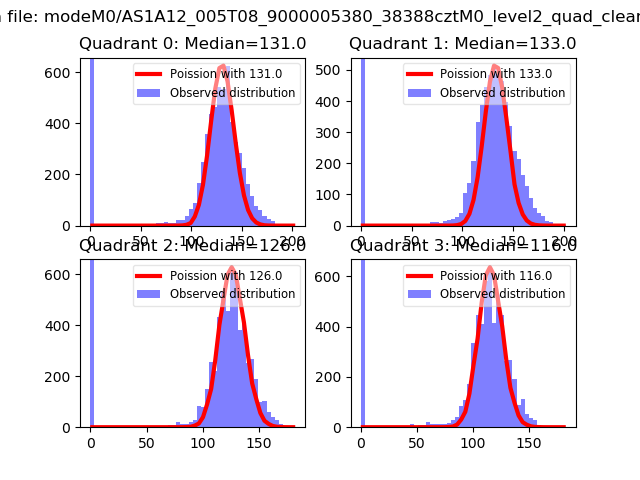 |
 |
| Quadrant-wise count rates Data is divided into 100 sec bins |
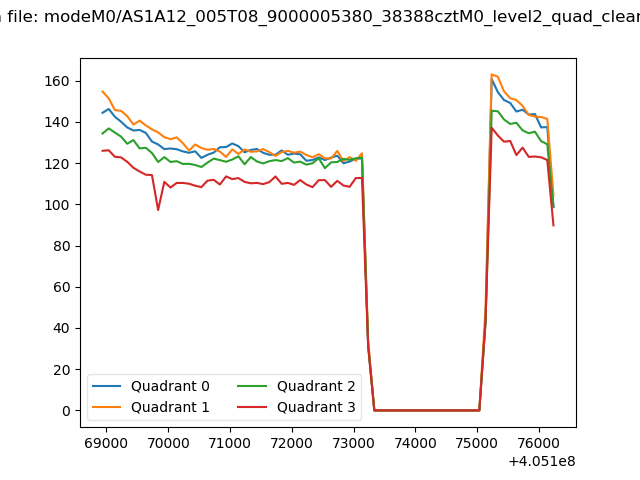 |
|
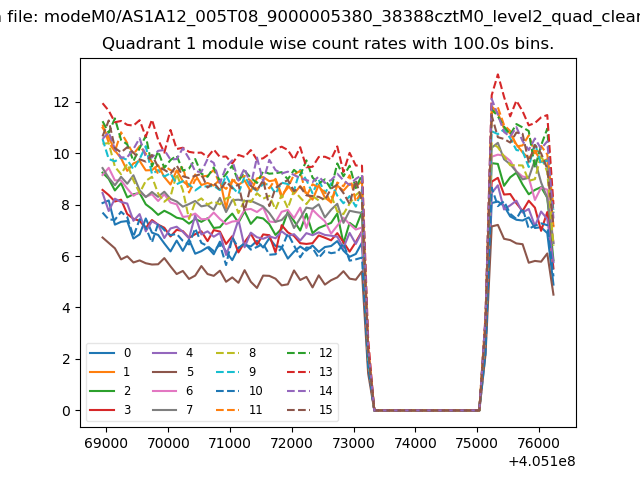
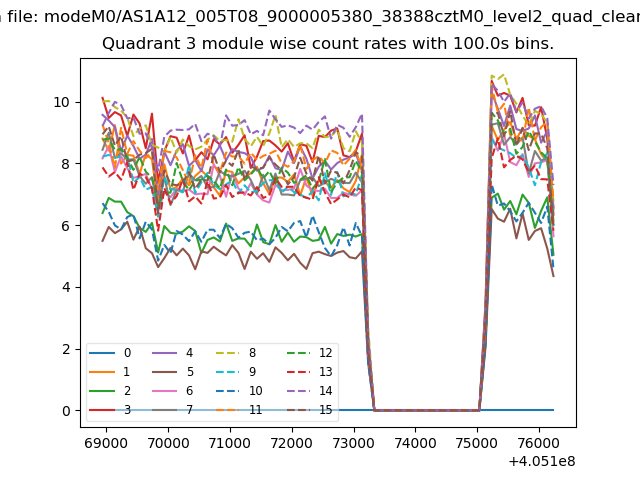
| Module-wise count rates for Quadrant A Data is divided into 100 sec bins |
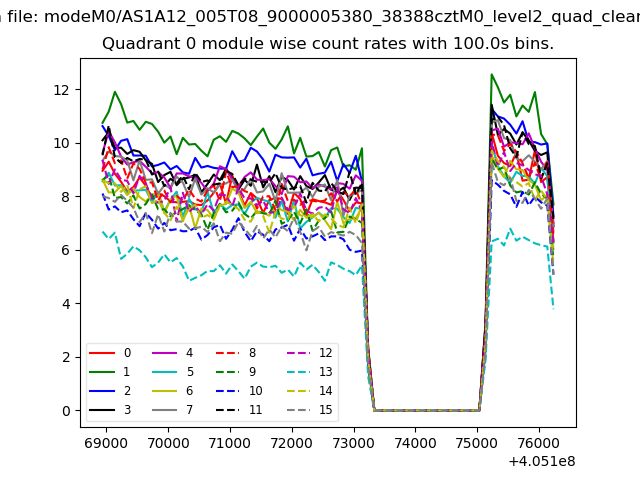 |
 |
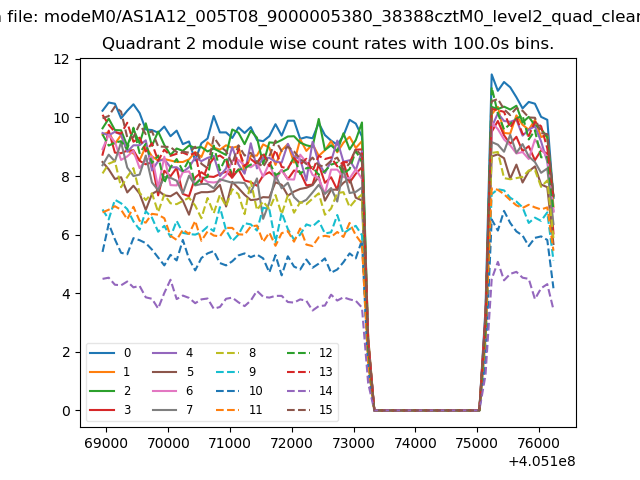
| Module-wise count rates for Quadrant B Data is divided into 100 sec bins |
 |
 |
| Module-wise count rates for Quadrant C Data is divided into 100 sec bins |
 |
 |
| Module-wise count rates for Quadrant D Data is divided into 100 sec bins |
 |
 |
| Parameter | Plot |
|---|---|
| CZT HV Monitor | 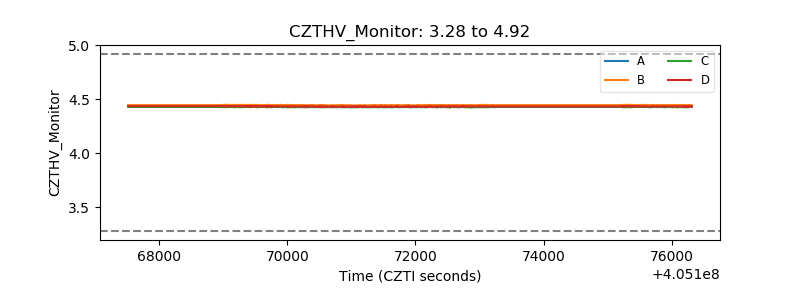 |
| D_VDD | 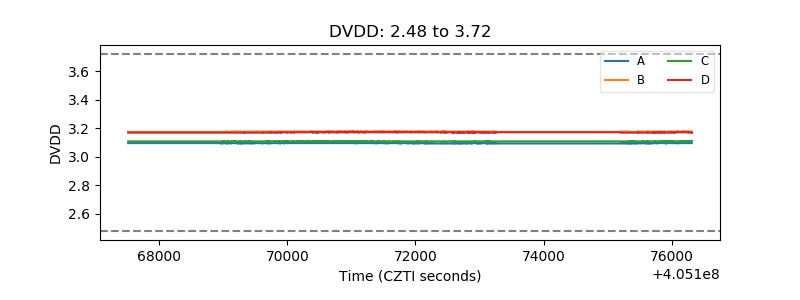 |
| Temperature 1 | 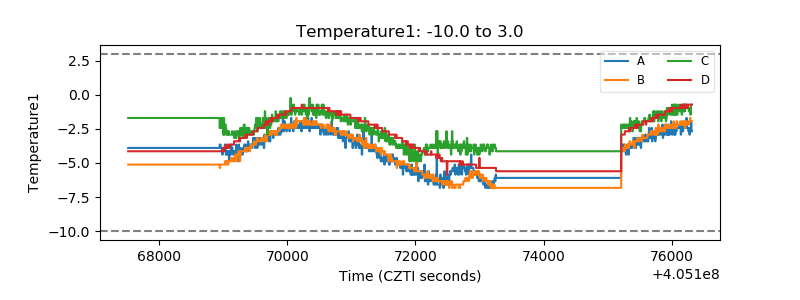 |
| Veto HV Monitor | 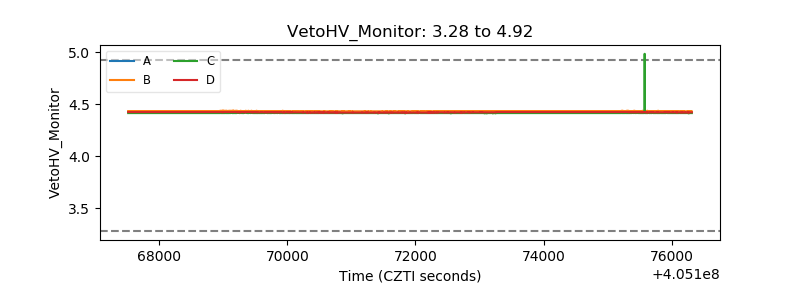 |
| Veto LLD | 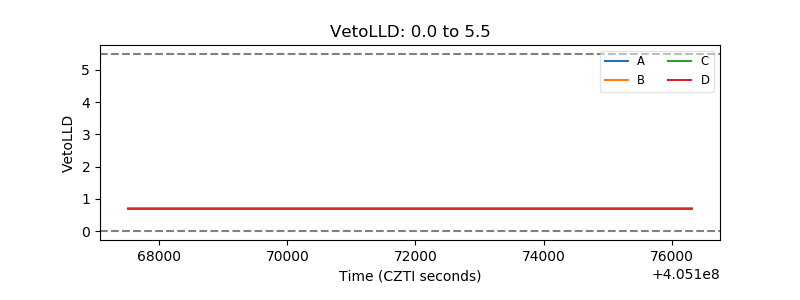 |
| Alpha Counter | 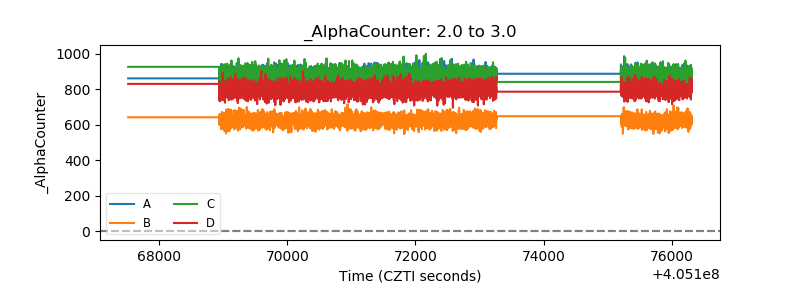 |
| _CPM_Rate | 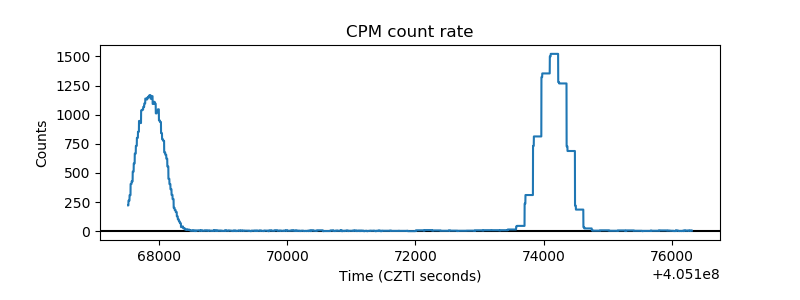 |
| CZT Counter | 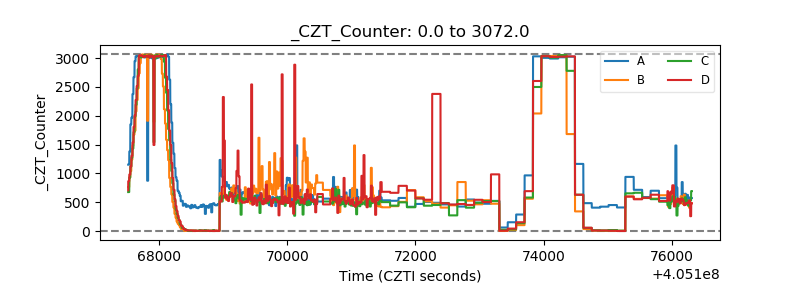 |
| +2.5 Volts monitor | 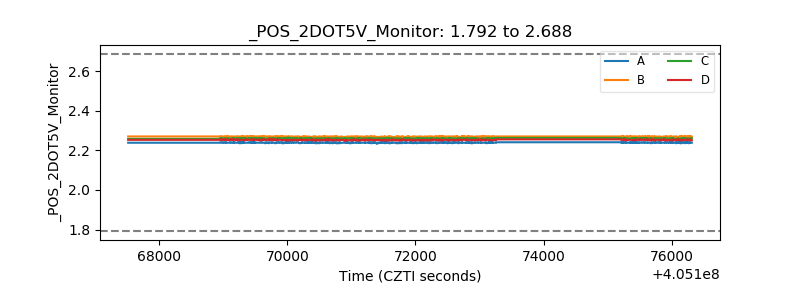 |
| +5 Volts monitor | 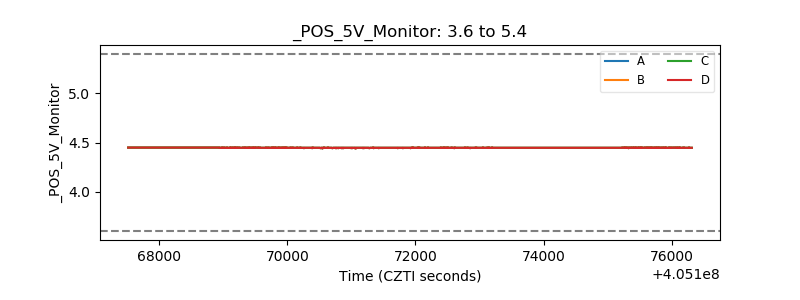 |
| _ROLL_ROT | 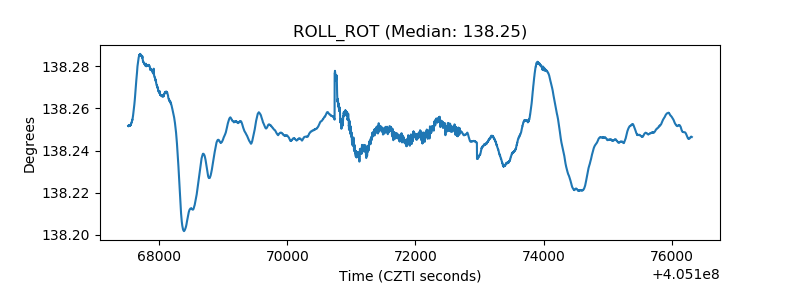 |
| _Roll_DEC | 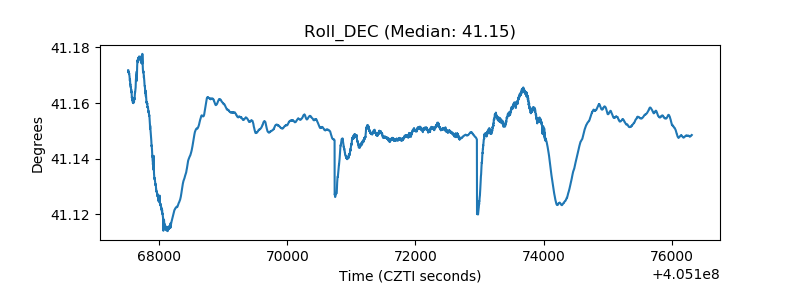 |
| _Roll_RA | 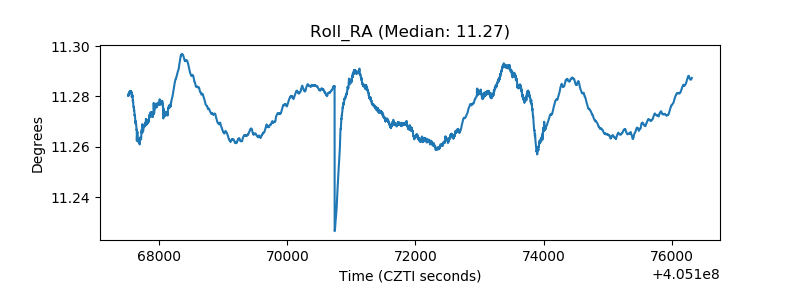 |
| Veto Counter | 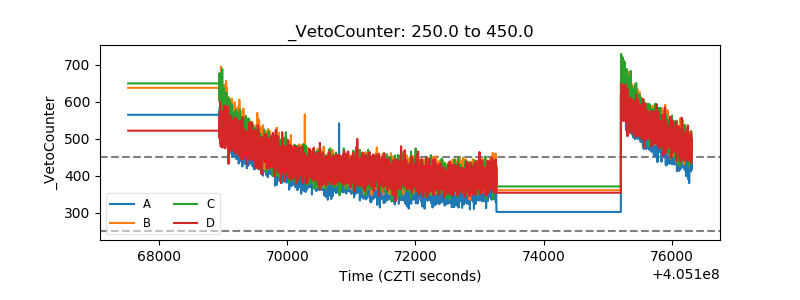 |