| Param | Original file | Final file |
|---|---|---|
| Filename | modeM0/AS1A12_005T08_9000005380_38389cztM0_level2.fits | modeM0/AS1A12_005T08_9000005380_38389cztM0_level2_quad_clean.evt |
| Size (bytes) | 312,275,520 | 95,325,120 |
| Size | 297.8 MB | 90.9 MB |
| Events in quadrant A | 2,920,767 | 659,768 |
| Events in quadrant B | 2,607,722 | 667,506 |
| Events in quadrant C | 2,588,671 | 638,560 |
| Events in quadrant D | 3,058,942 | 576,598 |
| Mode M0 | |||
|---|---|---|---|
| Quadrant | BADHDUFLAG | Total packets | Discarded packets |
| A | 0 | 11713 | 2 |
| B | 0 | 10716 | 1 |
| C | 0 | 10367 | 1 |
| D | 0 | 12050 | 1 |
| Mode M9 | |||
|---|---|---|---|
| Quadrant | BADHDUFLAG | Total packets | Discarded packets |
| A | 0 | 21 | 0 |
| B | 0 | 21 | 0 |
| C | 0 | 21 | 0 |
| D | 0 | 21 | 0 |
| Mode SS | |||
|---|---|---|---|
| Quadrant | BADHDUFLAG | Total packets | Discarded packets |
| A | 0 | 98 | 0 |
| B | 0 | 98 | 0 |
| C | 0 | 98 | 0 |
| D | 0 | 98 | 0 |
| Quadrant | Total seconds | Saturated seconds | Saturation percentage |
|---|---|---|---|
| A | 4918 | 36 | 0.732005% |
| B | 4918 | 19 | 0.386336% |
| C | 4918 | 7 | 0.142334% |
| D | 4918 | 150 | 3.050020% |
Noise dominated data is calculated using 1-second bins in cleaned event files. If a bin has >2000 counts, and if more than 50% of those come from <1% of pixels, then it is considered to be noise-dominated and hence unusable.
| Quadrant | # 1 sec bins | Bins with >0 counts | Bins with >2000 counts | High rate bins dominated by noise | Noise dominated (total time) | Noise dominated (detector-on time) | Marked lightcurve |
|---|---|---|---|---|---|---|---|
| A | 6981 | 4919 | 22 | 22 | 0.32% | 0.45% | 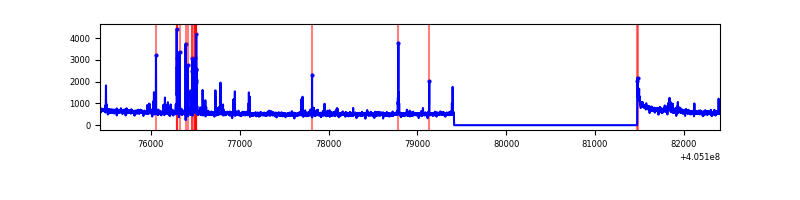 |
| B | 6981 | 4919 | 5 | 5 | 0.07% | 0.10% | 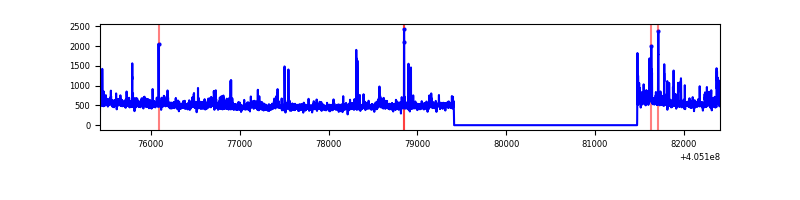 |
| C | 6981 | 4919 | 5 | 5 | 0.07% | 0.10% | 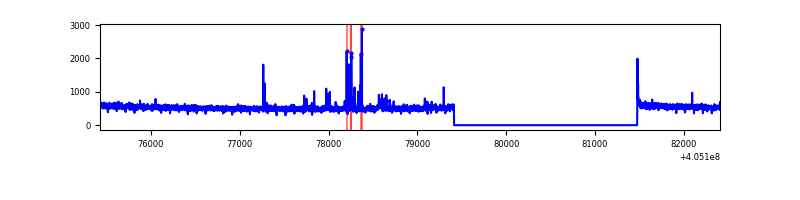 |
| D | 6981 | 4919 | 127 | 127 | 1.82% | 2.58% | 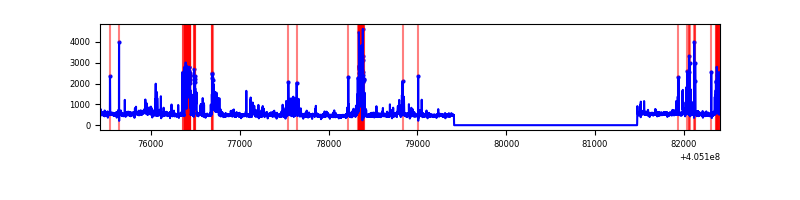 |
Top three noisy pixels from each quadrant. If the there are fewer than three noisy pixels in the level2.evt file, extra rows are filled as -1
| Pixel properties | Quadrant properties | ||||||
|---|---|---|---|---|---|---|---|
| Quadrant | DetID | PixID | Counts | Sigma | Mean | Median | Sigma |
| A | 10 | 83 | 329780 | 2655.44 | 612 | 602 | 124.0 |
| A | 9 | 143 | 150784 | 1211.5 | 612 | 602 | 124.0 |
| A | 12 | 16 | 32137 | 254.39 | 612 | 602 | 124.0 |
| B | 0 | 183 | 128116 | 1129.16 | 601 | 588 | 112.9 |
| B | 4 | 21 | 27144 | 235.13 | 601 | 588 | 112.9 |
| B | 0 | 230 | 26814 | 232.21 | 601 | 588 | 112.9 |
| C | 15 | 214 | 207363 | 1497.77 | 594 | 598 | 138.0 |
| C | 2 | 16 | 53444 | 382.81 | 594 | 598 | 138.0 |
| C | 0 | 10 | 8962 | 60.59 | 594 | 598 | 138.0 |
| D | 12 | 241 | 230715 | 1636.88 | 591 | 577 | 140.6 |
| D | 10 | 118 | 220987 | 1567.69 | 591 | 577 | 140.6 |
| D | 12 | 233 | 90638 | 640.57 | 591 | 577 | 140.6 |
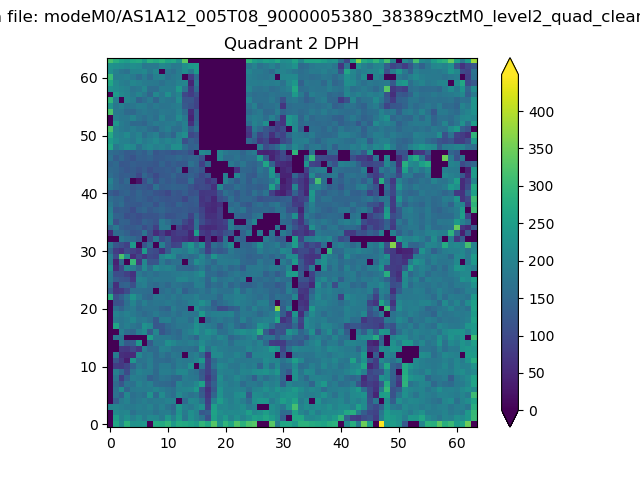
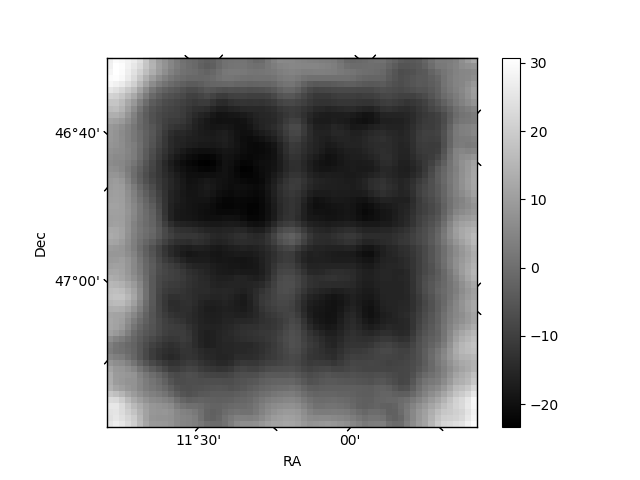
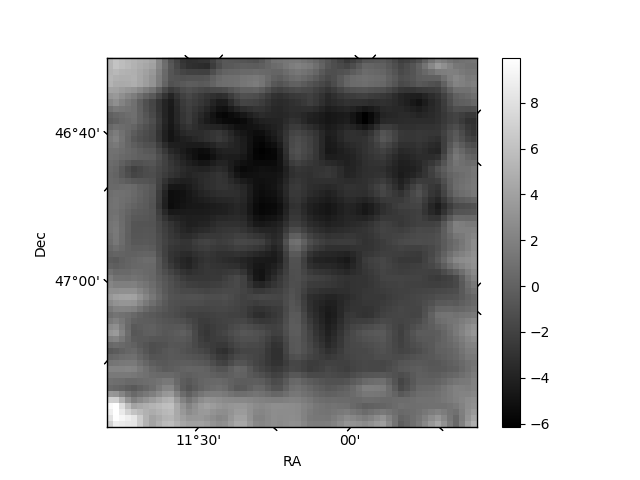
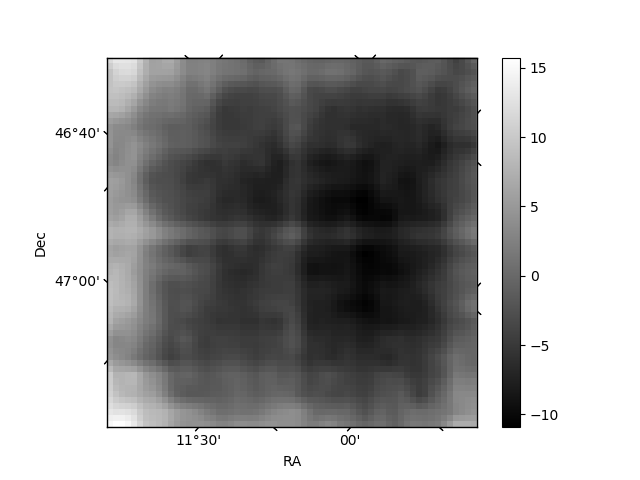
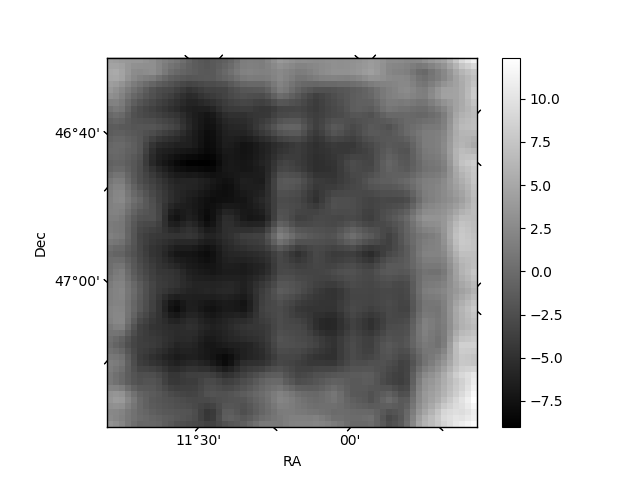
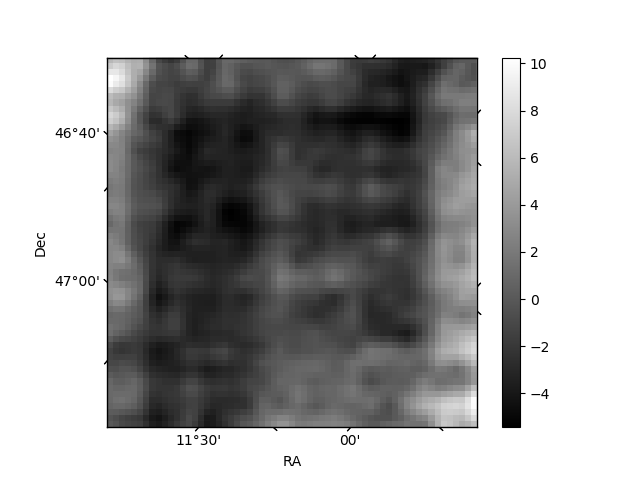
Histogram calculated using DETX and DETY for each event in the final _common_clean file
| Quadrant A | 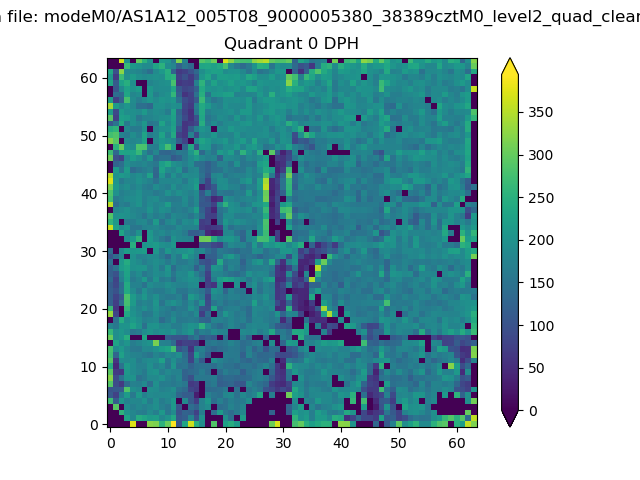 |
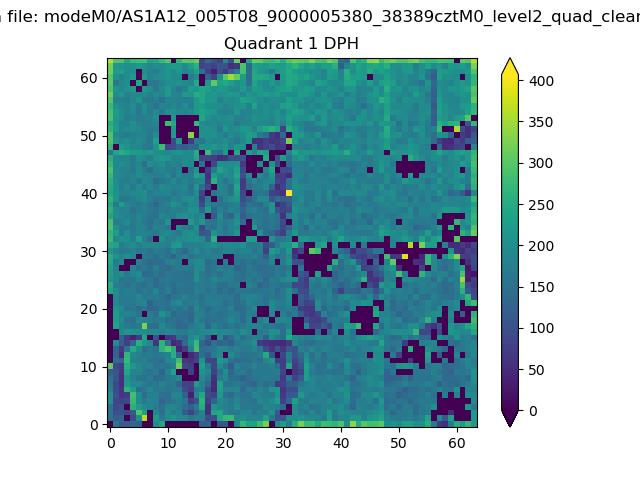 |
Quadrant B |
|---|---|---|---|
| Quadrant D | 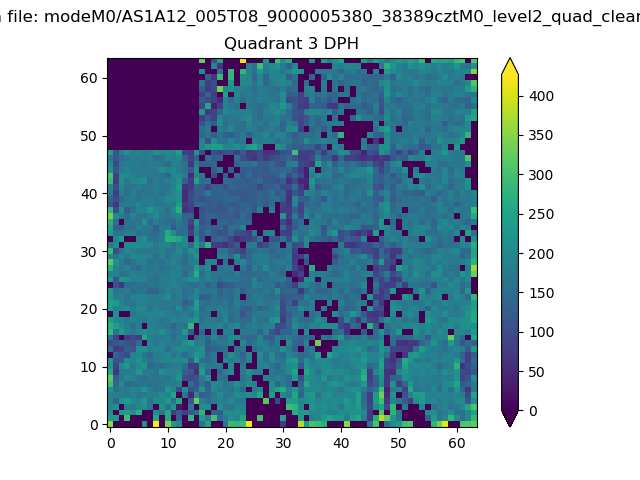 |
 |
Quadrant C |
| Plot type | Count rate plots | Images |
|---|---|---|
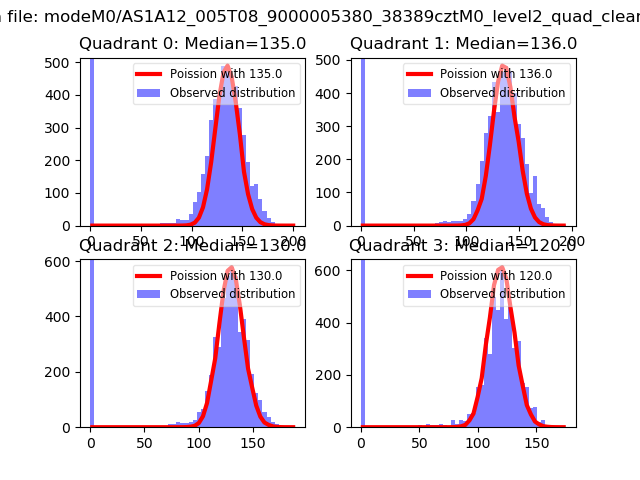
| Comparison with Poisson distribution Blue bars denote a histogram of data divided into 1 sec bins. Red curve is a Poisson curve with rate = median count rate of data. |
 |
 |
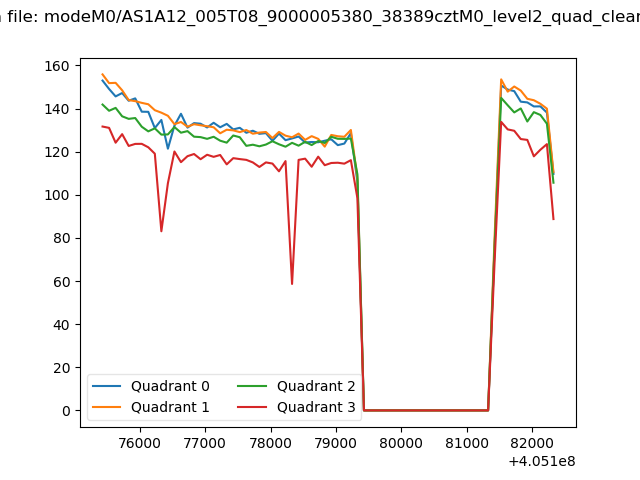
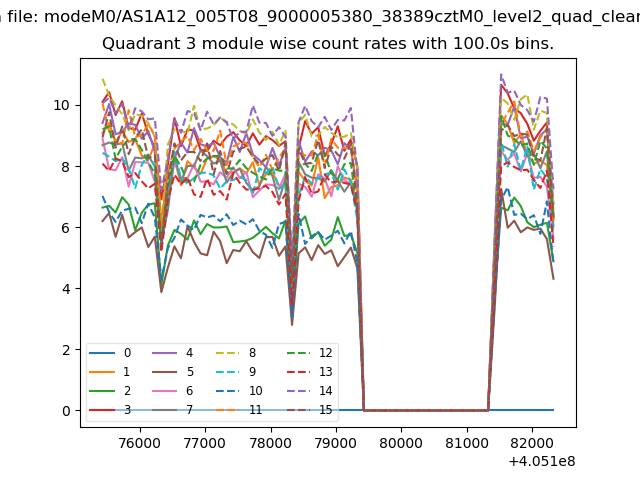
| Quadrant-wise count rates Data is divided into 100 sec bins |
 |
|
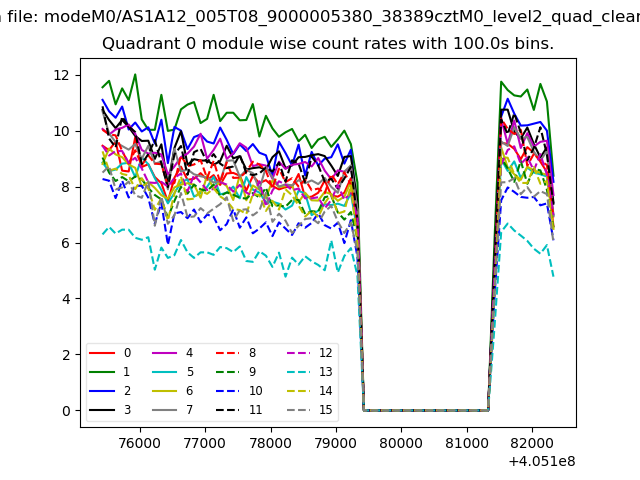
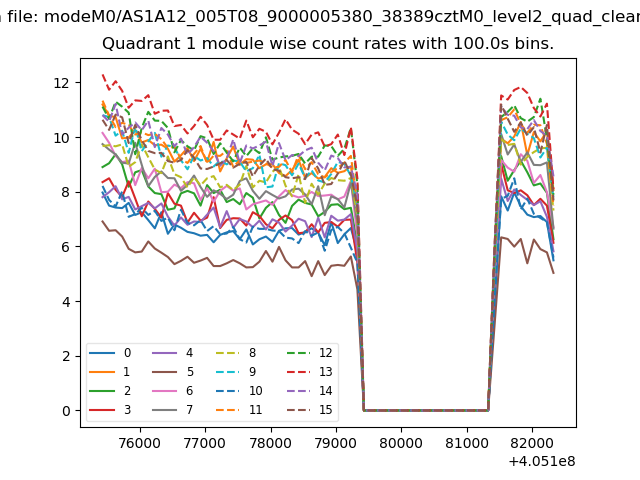
| Module-wise count rates for Quadrant A Data is divided into 100 sec bins |
 |
 |
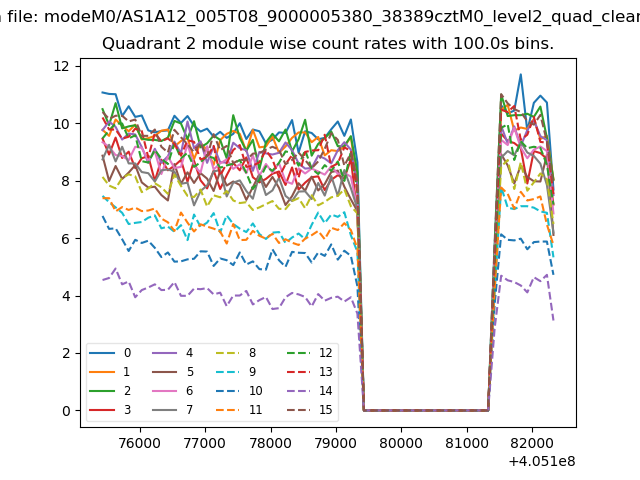
| Module-wise count rates for Quadrant B Data is divided into 100 sec bins |
 |
 |
| Module-wise count rates for Quadrant C Data is divided into 100 sec bins |
 |
 |
| Module-wise count rates for Quadrant D Data is divided into 100 sec bins |
 |
 |
| Parameter | Plot |
|---|---|
| CZT HV Monitor | 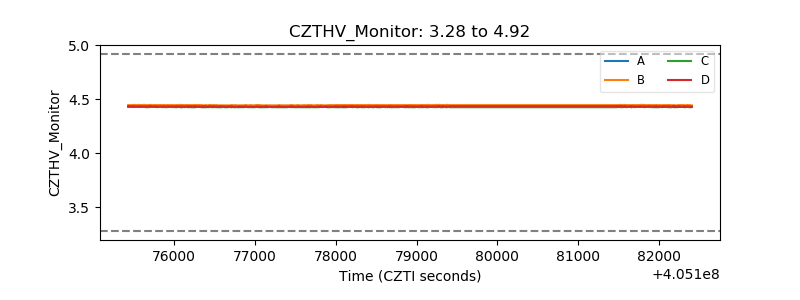 |
| D_VDD | 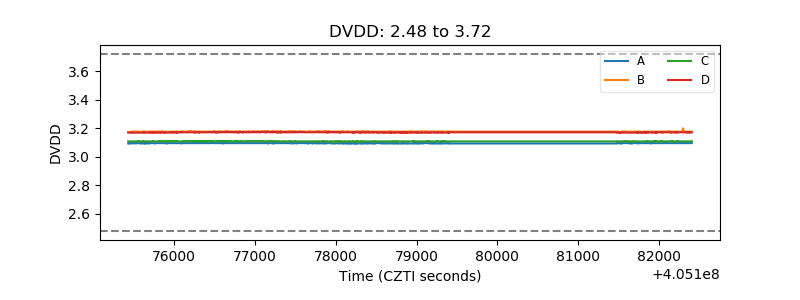 |
| Temperature 1 | 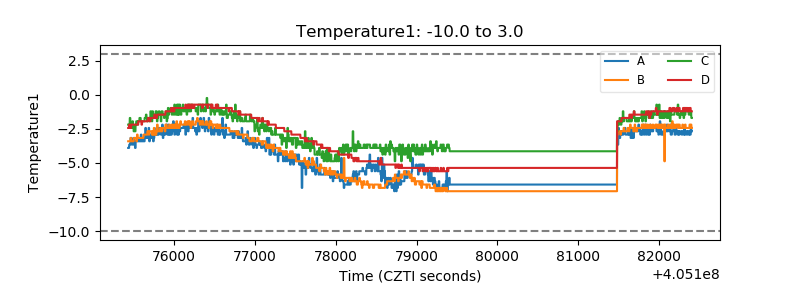 |
| Veto HV Monitor | 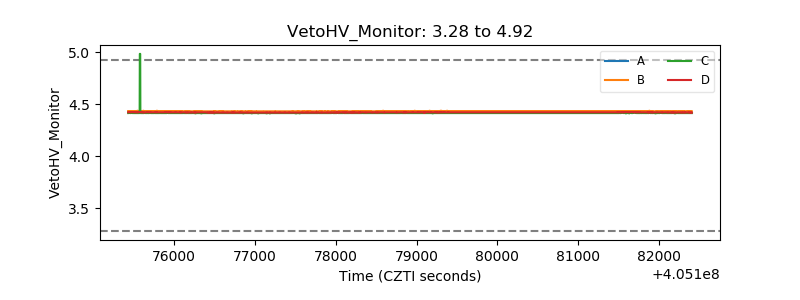 |
| Veto LLD | 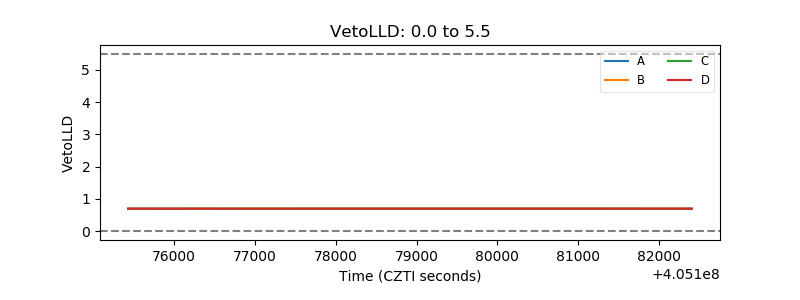 |
| Alpha Counter | 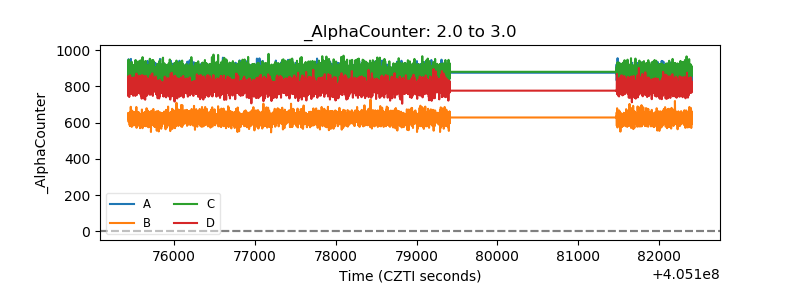 |
| _CPM_Rate | 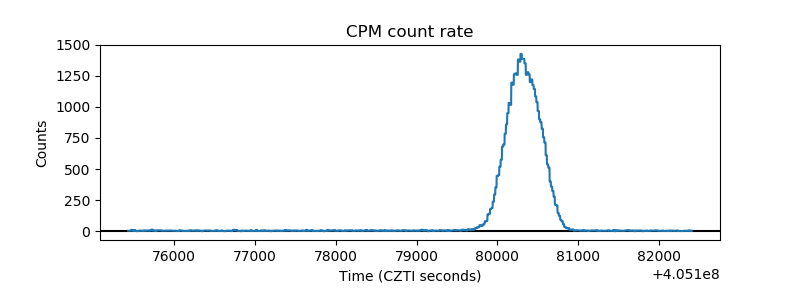 |
| CZT Counter | 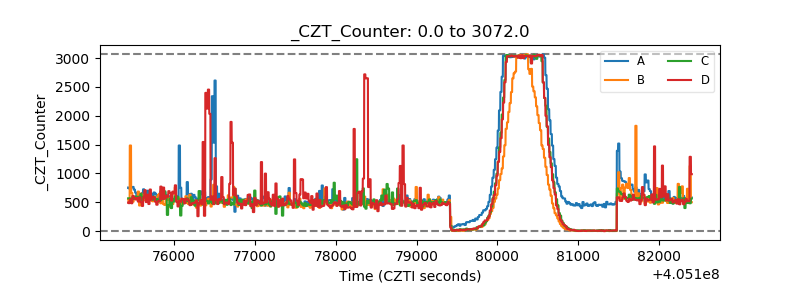 |
| +2.5 Volts monitor | 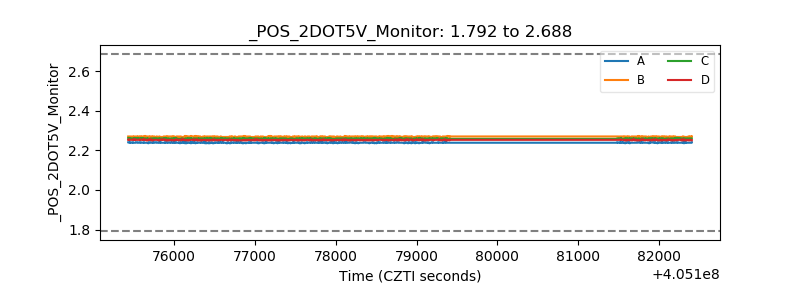 |
| +5 Volts monitor | 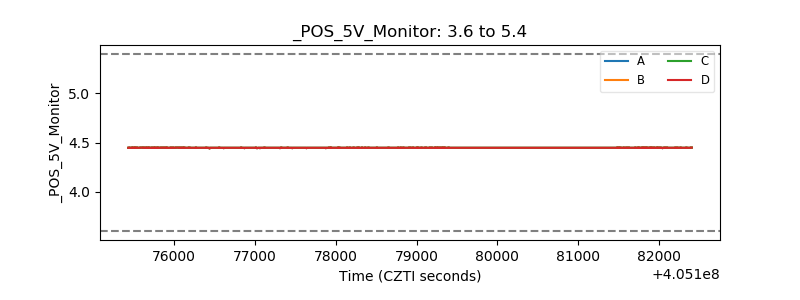 |
| _ROLL_ROT | 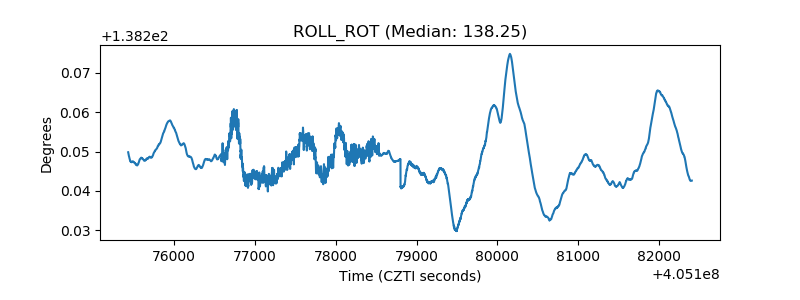 |
| _Roll_DEC | 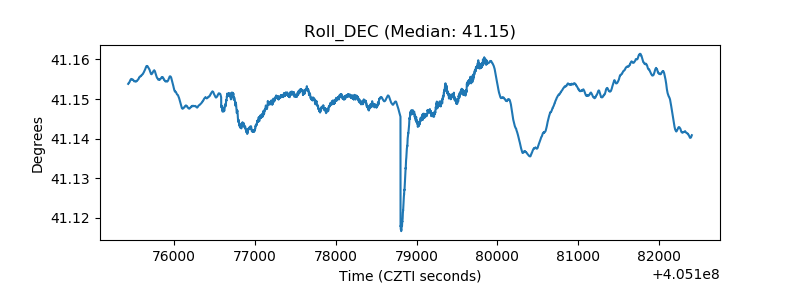 |
| _Roll_RA | 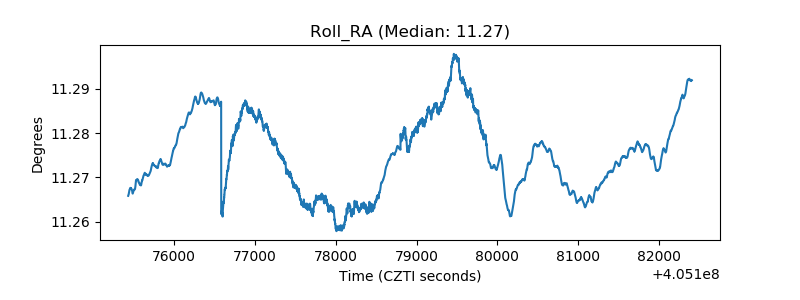 |
| Veto Counter | 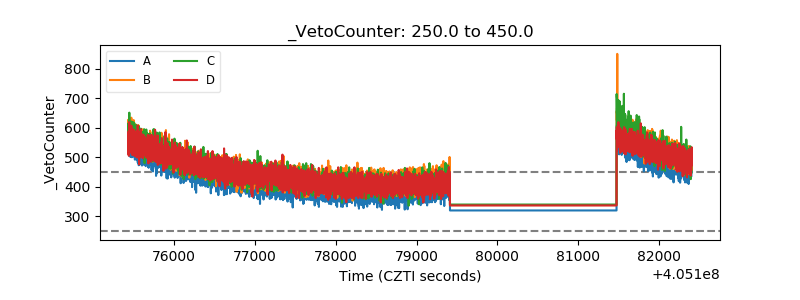 |