| Param | Original file | Final file |
|---|---|---|
| Filename | modeM0/AS1A12_005T08_9000005380_38390cztM0_level2.fits | modeM0/AS1A12_005T08_9000005380_38390cztM0_level2_quad_clean.evt |
| Size (bytes) | 348,995,520 | 99,141,120 |
| Size | 332.8 MB | 94.5 MB |
| Events in quadrant A | 3,099,350 | 683,177 |
| Events in quadrant B | 2,951,684 | 678,921 |
| Events in quadrant C | 2,676,664 | 666,656 |
| Events in quadrant D | 3,786,758 | 609,534 |
| Mode M0 | |||
|---|---|---|---|
| Quadrant | BADHDUFLAG | Total packets | Discarded packets |
| A | 0 | 12503 | 3 |
| B | 0 | 12062 | 2 |
| C | 0 | 10850 | 2 |
| D | 0 | 14551 | 2 |
| Mode M9 | |||
|---|---|---|---|
| Quadrant | BADHDUFLAG | Total packets | Discarded packets |
| A | 0 | 22 | 0 |
| B | 0 | 22 | 0 |
| C | 0 | 22 | 0 |
| D | 0 | 23 | 0 |
| Mode SS | |||
|---|---|---|---|
| Quadrant | BADHDUFLAG | Total packets | Discarded packets |
| A | 0 | 106 | 0 |
| B | 0 | 106 | 0 |
| C | 0 | 106 | 0 |
| D | 0 | 106 | 0 |
| Quadrant | Total seconds | Saturated seconds | Saturation percentage |
|---|---|---|---|
| A | 5196 | 16 | 0.307929% |
| B | 5196 | 100 | 1.924557% |
| C | 5196 | 10 | 0.192456% |
| D | 5196 | 100 | 1.924557% |
Noise dominated data is calculated using 1-second bins in cleaned event files. If a bin has >2000 counts, and if more than 50% of those come from <1% of pixels, then it is considered to be noise-dominated and hence unusable.
| Quadrant | # 1 sec bins | Bins with >0 counts | Bins with >2000 counts | High rate bins dominated by noise | Noise dominated (total time) | Noise dominated (detector-on time) | Marked lightcurve |
|---|---|---|---|---|---|---|---|
| A | 7318 | 5197 | 12 | 12 | 0.16% | 0.23% | 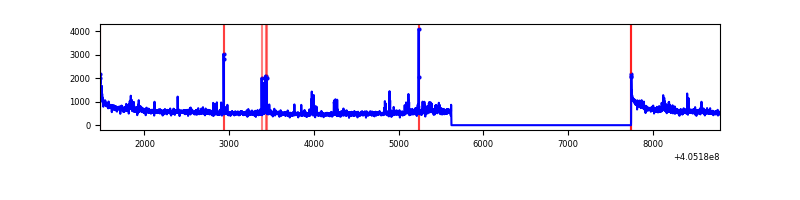 |
| B | 7318 | 5197 | 65 | 65 | 0.89% | 1.25% | 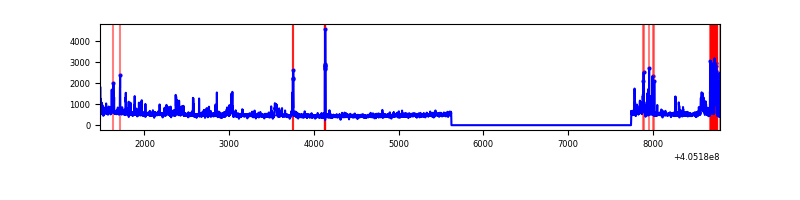 |
| C | 7318 | 5197 | 4 | 4 | 0.05% | 0.08% | 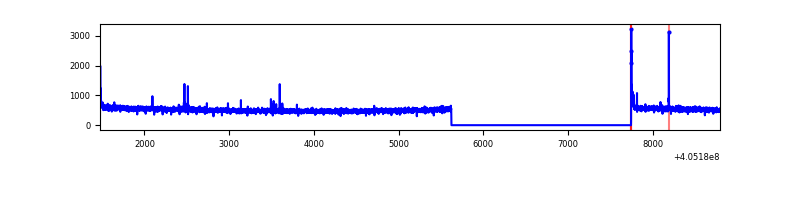 |
| D | 7318 | 5197 | 64 | 64 | 0.87% | 1.23% | 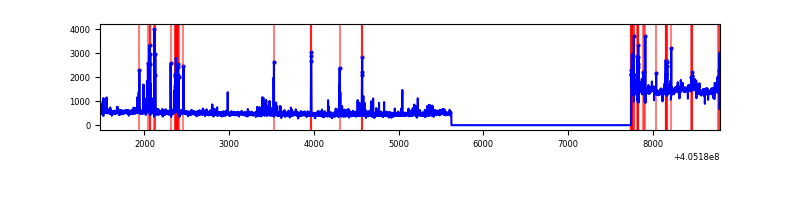 |
Top three noisy pixels from each quadrant. If the there are fewer than three noisy pixels in the level2.evt file, extra rows are filled as -1
| Pixel properties | Quadrant properties | ||||||
|---|---|---|---|---|---|---|---|
| Quadrant | DetID | PixID | Counts | Sigma | Mean | Median | Sigma |
| A | 10 | 83 | 400952 | 3146.07 | 632 | 621 | 127.2 |
| A | 12 | 16 | 140795 | 1101.58 | 632 | 621 | 127.2 |
| A | 13 | 248 | 37924 | 293.15 | 632 | 621 | 127.2 |
| B | 0 | 183 | 396380 | 3390.27 | 616 | 600 | 116.7 |
| B | 15 | 35 | 31327 | 263.21 | 616 | 600 | 116.7 |
| B | 5 | 172 | 21904 | 182.49 | 616 | 600 | 116.7 |
| C | 15 | 214 | 220145 | 1521.79 | 619 | 624 | 144.3 |
| C | 0 | 10 | 26600 | 180.07 | 619 | 624 | 144.3 |
| C | 14 | 254 | 14382 | 95.37 | 619 | 624 | 144.3 |
| D | 10 | 203 | 948058 | 6384.87 | 617 | 601 | 148.4 |
| D | 10 | 118 | 130321 | 874.18 | 617 | 601 | 148.4 |
| D | 1 | 20 | 99311 | 665.2 | 617 | 601 | 148.4 |
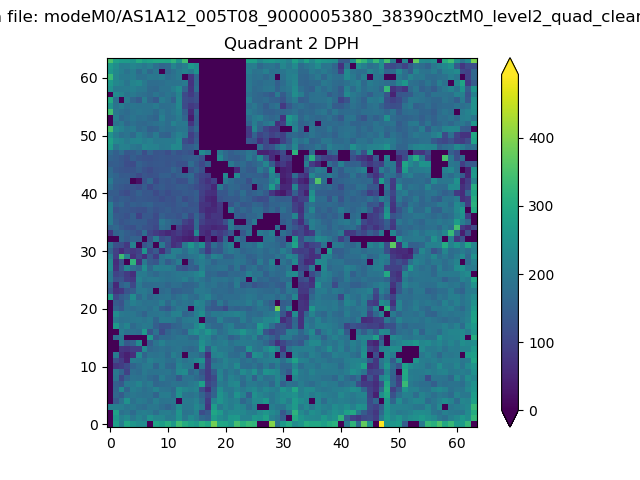
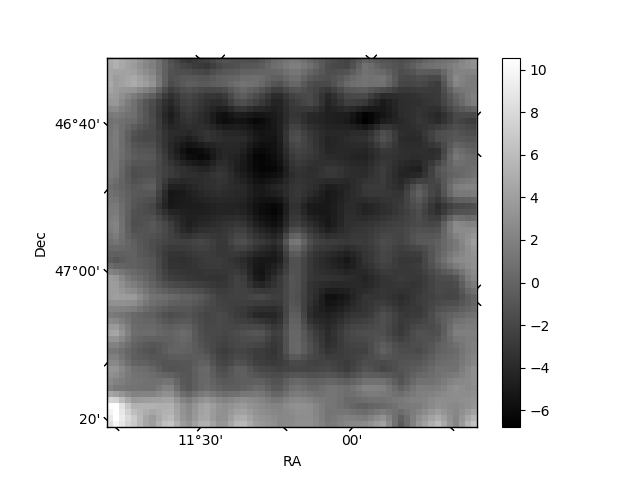
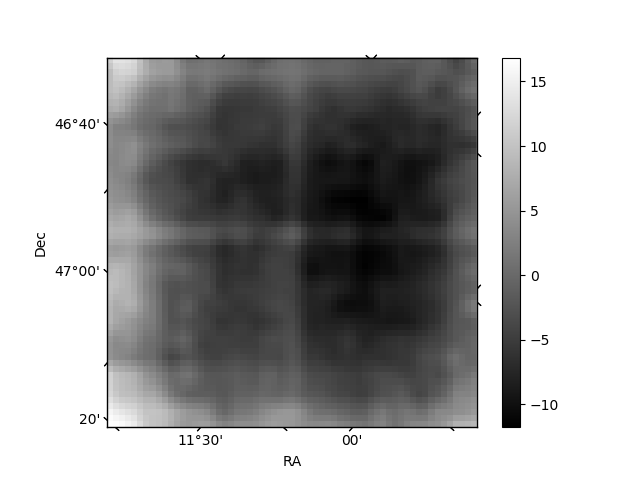
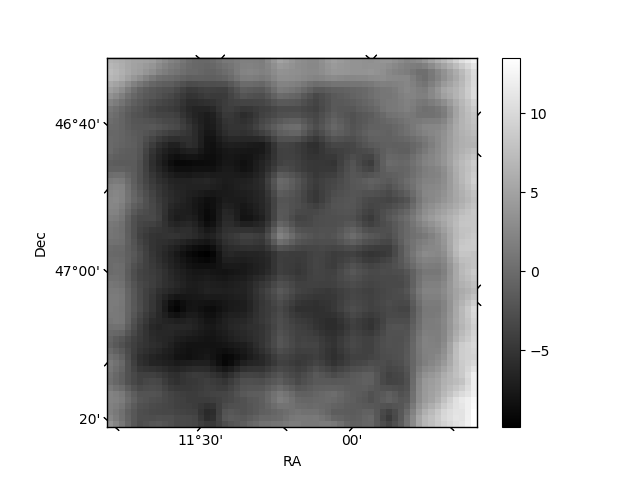
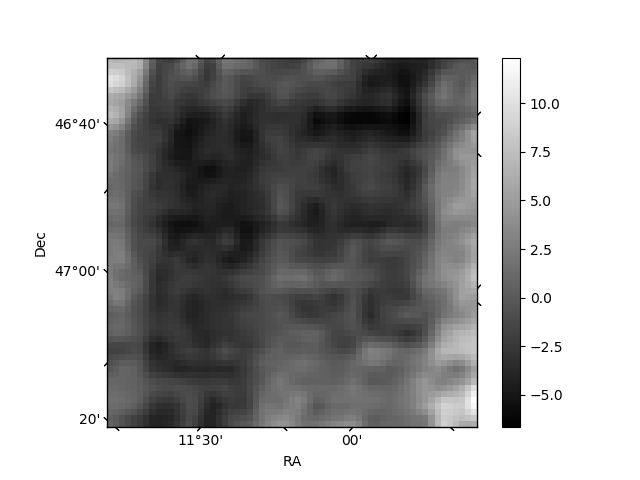
Histogram calculated using DETX and DETY for each event in the final _common_clean file
| Quadrant A |  |
 |
Quadrant B |
|---|---|---|---|
| Quadrant D | 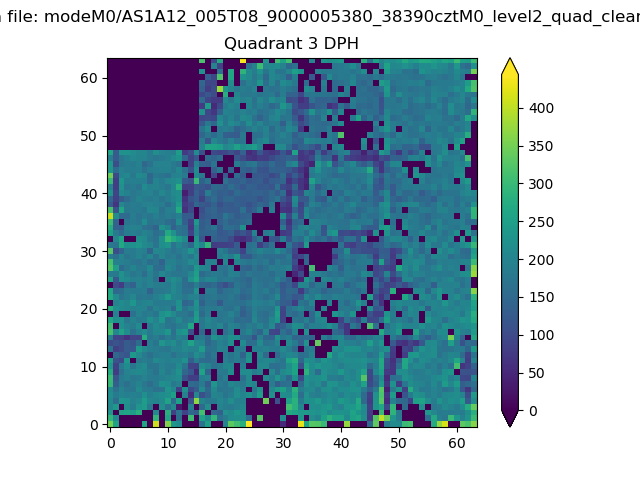 |
 |
Quadrant C |
| Plot type | Count rate plots | Images |
|---|---|---|
| Comparison with Poisson distribution Blue bars denote a histogram of data divided into 1 sec bins. Red curve is a Poisson curve with rate = median count rate of data. |
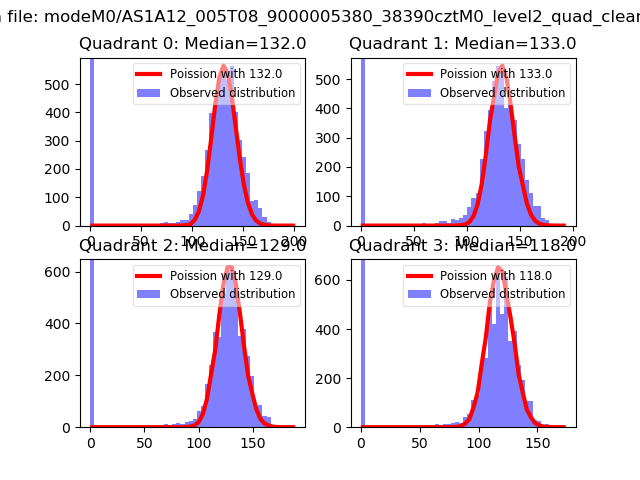 |
 |
| Quadrant-wise count rates Data is divided into 100 sec bins |
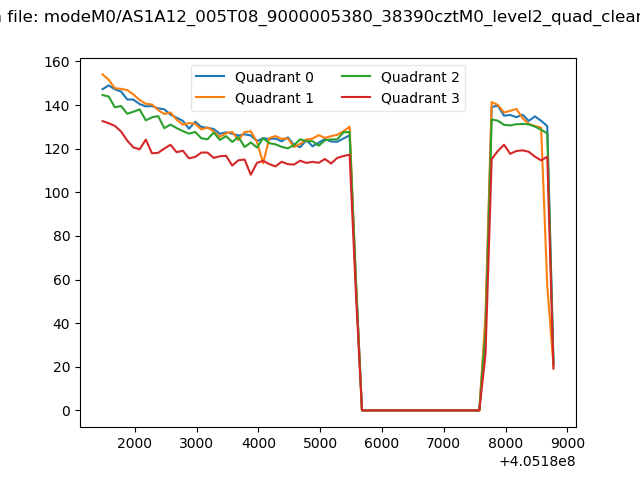 |
|
| Module-wise count rates for Quadrant A Data is divided into 100 sec bins |
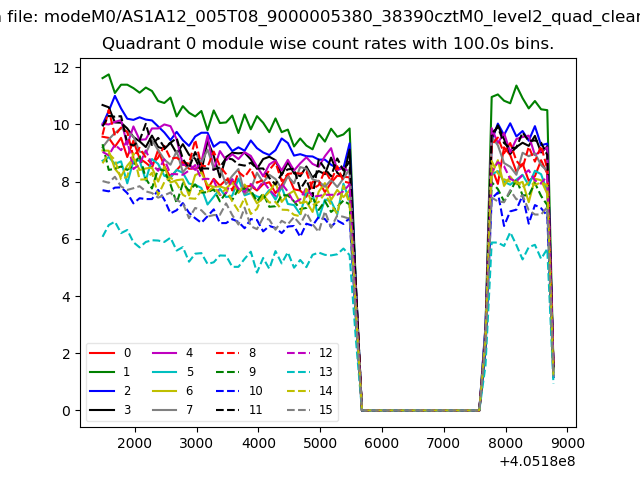 |
 |
| Module-wise count rates for Quadrant B Data is divided into 100 sec bins |
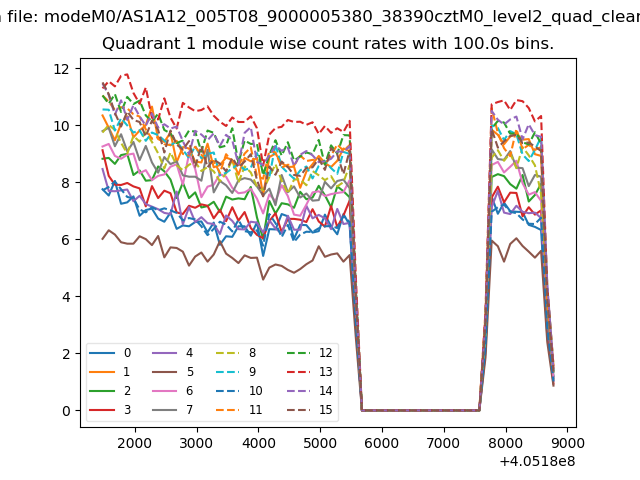 |
 |
| Module-wise count rates for Quadrant C Data is divided into 100 sec bins |
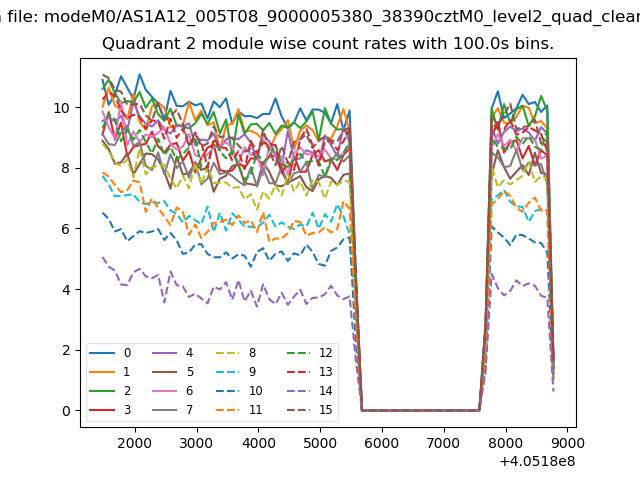 |
 |
| Module-wise count rates for Quadrant D Data is divided into 100 sec bins |
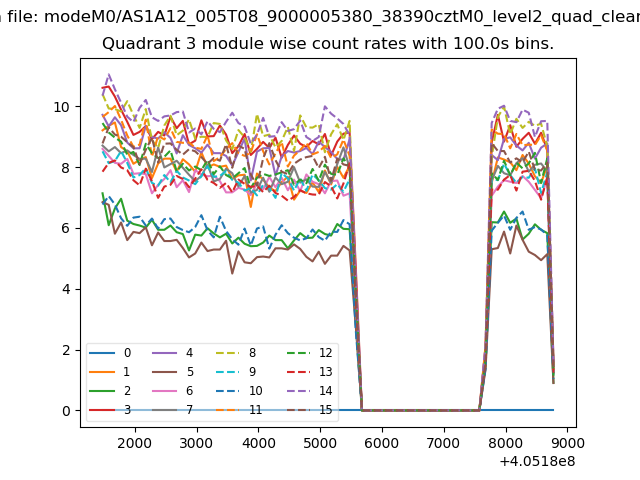 |
 |
| Parameter | Plot |
|---|---|
| CZT HV Monitor | 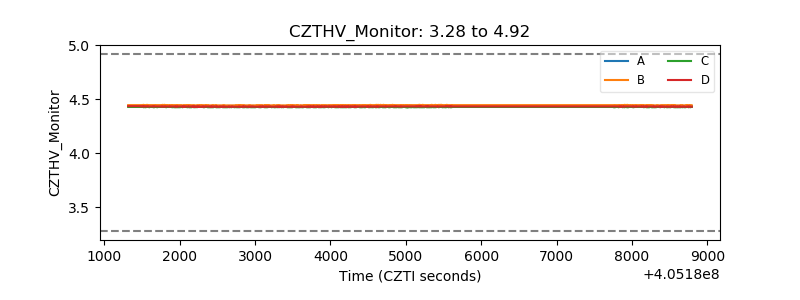 |
| D_VDD | 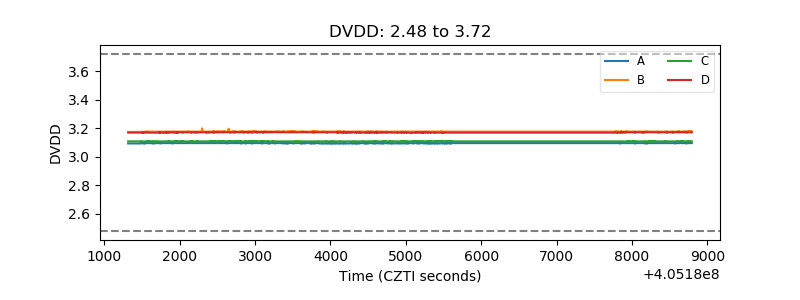 |
| Temperature 1 | 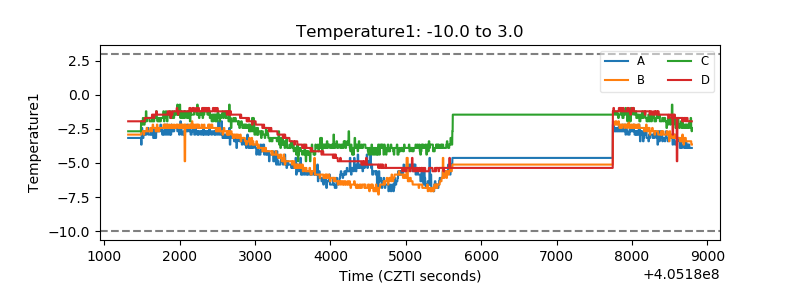 |
| Veto HV Monitor | 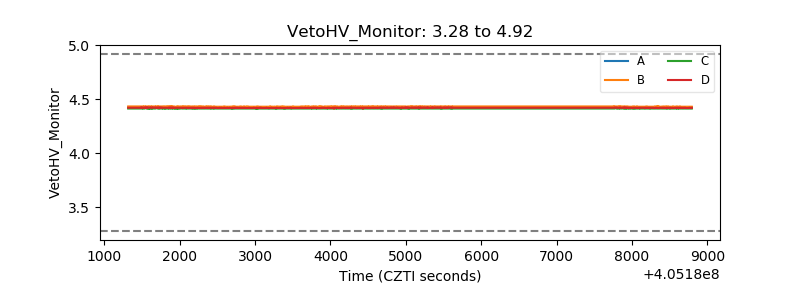 |
| Veto LLD | 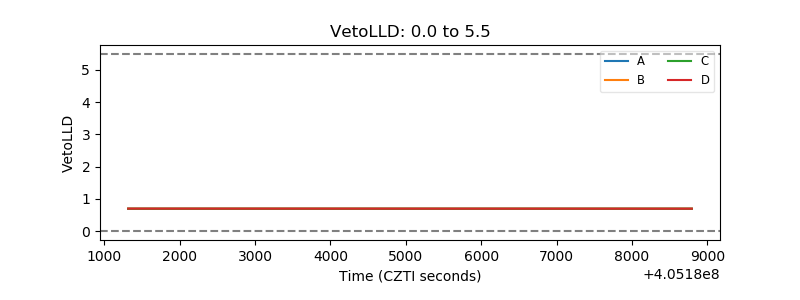 |
| Alpha Counter | 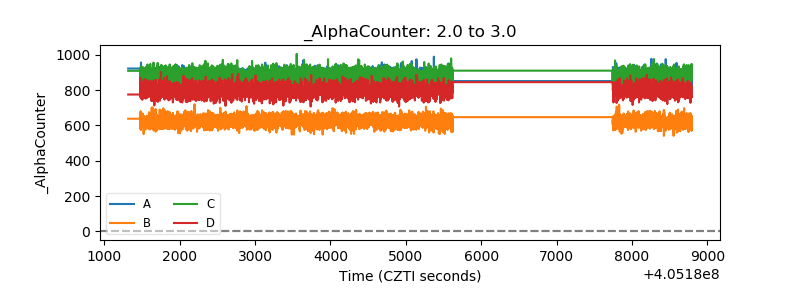 |
| _CPM_Rate | 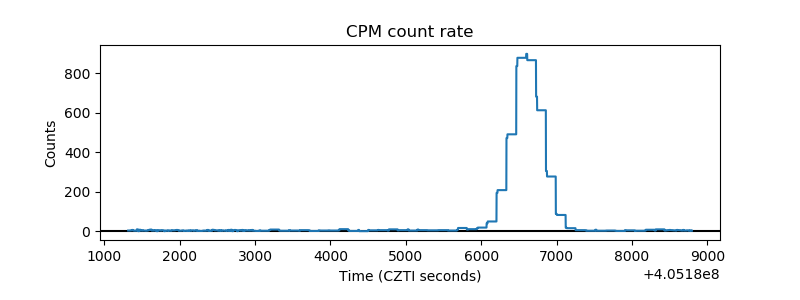 |
| CZT Counter | 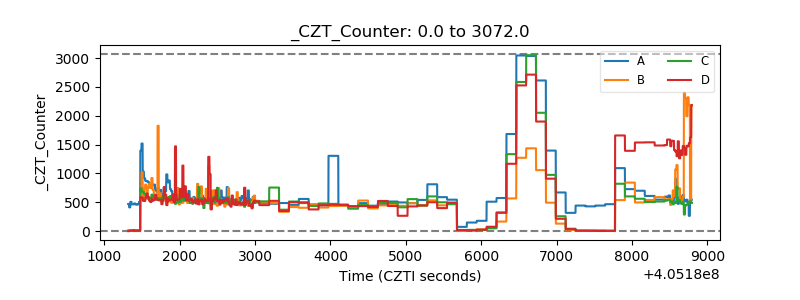 |
| +2.5 Volts monitor | 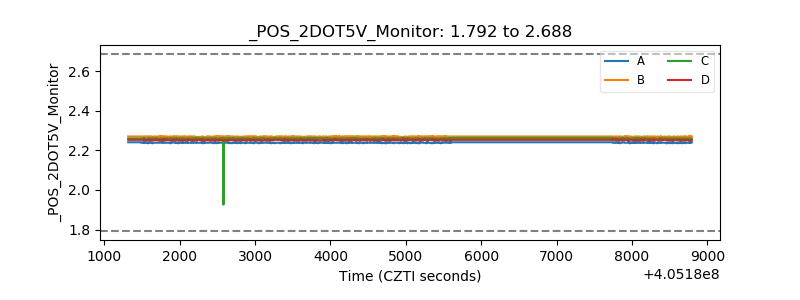 |
| +5 Volts monitor | 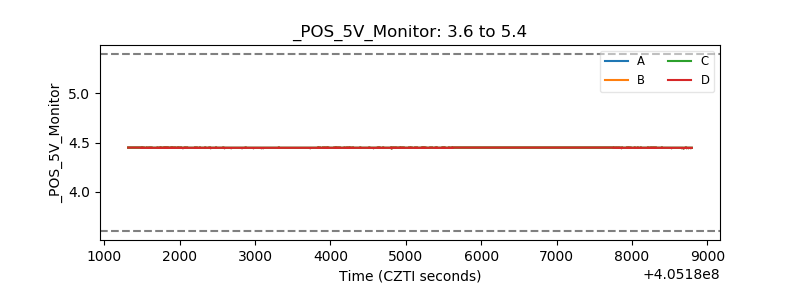 |
| _ROLL_ROT | 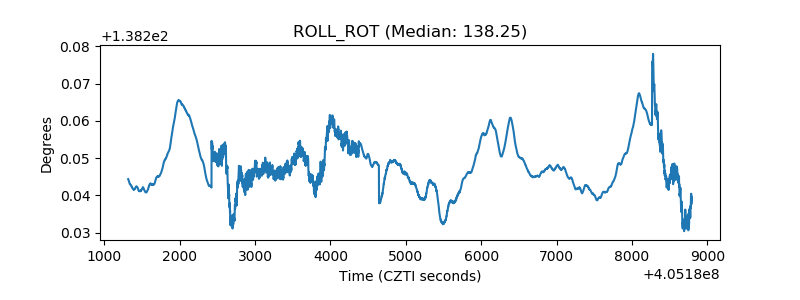 |
| _Roll_DEC | 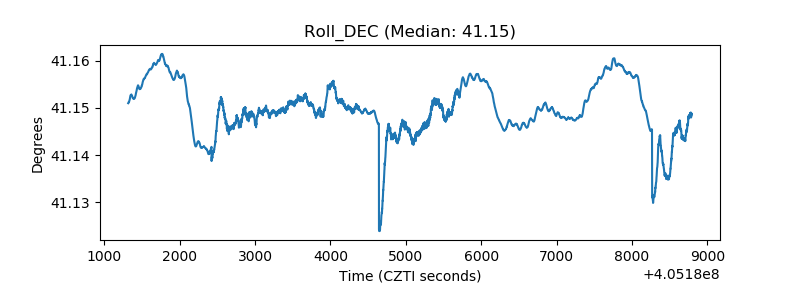 |
| _Roll_RA | 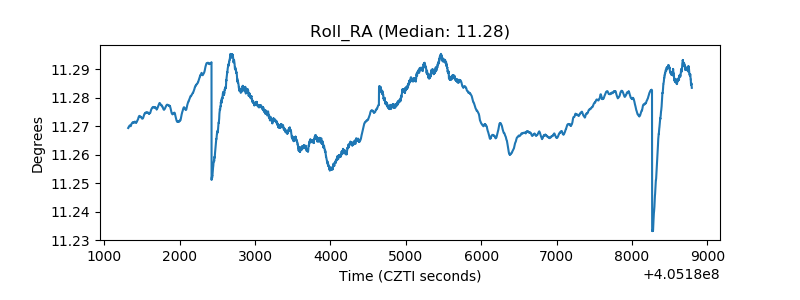 |
| Veto Counter | 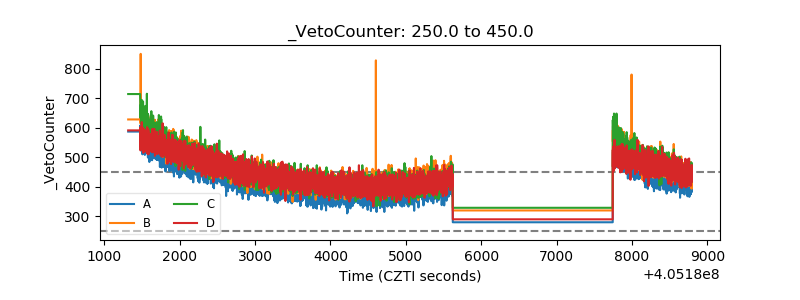 |