| Param | Original file | Final file |
|---|---|---|
| Filename | modeM0/AS1A12_005T08_9000005380_38391cztM0_level2.fits | modeM0/AS1A12_005T08_9000005380_38391cztM0_level2_quad_clean.evt |
| Size (bytes) | 121,786,560 | 24,160,320 |
| Size | 116.1 MB | 23.0 MB |
| Events in quadrant A | 848,292 | 168,297 |
| Events in quadrant B | 924,822 | 161,302 |
| Events in quadrant C | 687,837 | 162,838 |
| Events in quadrant D | 1,946,789 | 144,898 |
| Mode M0 | |||
|---|---|---|---|
| Quadrant | BADHDUFLAG | Total packets | Discarded packets |
| A | 0 | 3383 | 1 |
| B | 0 | 3530 | 1 |
| C | 0 | 2695 | 1 |
| D | 0 | 6645 | 1 |
| Mode M9 | |||
|---|---|---|---|
| Quadrant | BADHDUFLAG | Total packets | Discarded packets |
| A | 0 | 6 | 0 |
| B | 0 | 6 | 0 |
| C | 0 | 6 | 0 |
| D | 0 | 7 | 0 |
| Mode SS | |||
|---|---|---|---|
| Quadrant | BADHDUFLAG | Total packets | Discarded packets |
| A | 0 | 24 | 0 |
| B | 0 | 24 | 0 |
| C | 0 | 24 | 0 |
| D | 0 | 24 | 0 |
| Quadrant | Total seconds | Saturated seconds | Saturation percentage |
|---|---|---|---|
| A | 1259 | 9 | 0.714853% |
| B | 1259 | 83 | 6.592534% |
| C | 1259 | 7 | 0.555997% |
| D | 1259 | 100 | 7.942812% |
Noise dominated data is calculated using 1-second bins in cleaned event files. If a bin has >2000 counts, and if more than 50% of those come from <1% of pixels, then it is considered to be noise-dominated and hence unusable.
| Quadrant | # 1 sec bins | Bins with >0 counts | Bins with >2000 counts | High rate bins dominated by noise | Noise dominated (total time) | Noise dominated (detector-on time) | Marked lightcurve |
|---|---|---|---|---|---|---|---|
| A | 1259 | 1259 | 4 | 4 | 0.32% | 0.32% | 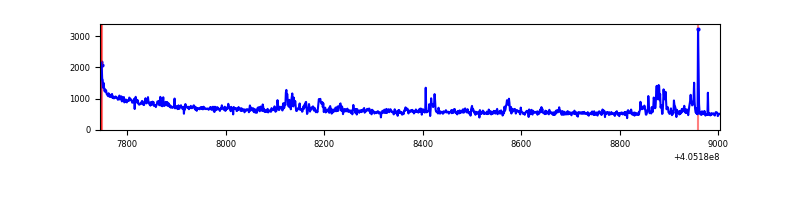 |
| B | 1259 | 1259 | 56 | 56 | 4.45% | 4.45% | 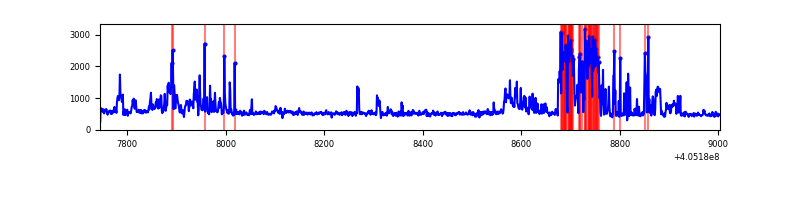 |
| C | 1259 | 1259 | 4 | 4 | 0.32% | 0.32% | 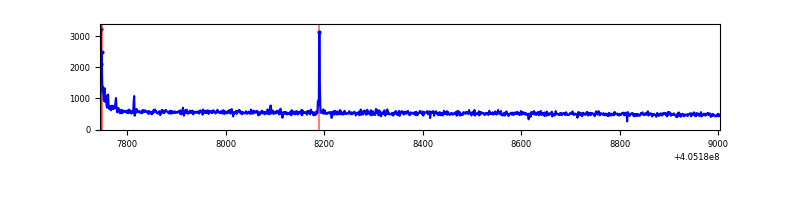 |
| D | 1259 | 1259 | 74 | 74 | 5.88% | 5.88% | 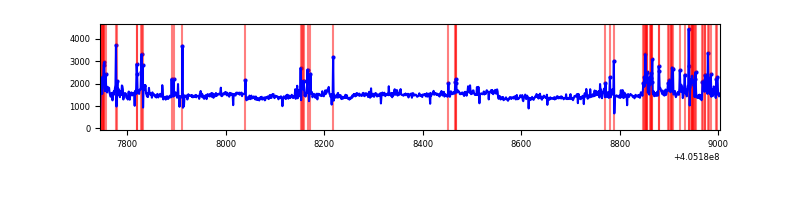 |
Top three noisy pixels from each quadrant. If the there are fewer than three noisy pixels in the level2.evt file, extra rows are filled as -1
| Pixel properties | Quadrant properties | ||||||
|---|---|---|---|---|---|---|---|
| Quadrant | DetID | PixID | Counts | Sigma | Mean | Median | Sigma |
| A | 10 | 83 | 141574 | 4193.02 | 159 | 156 | 33.7 |
| A | 12 | 16 | 63897 | 1889.91 | 159 | 156 | 33.7 |
| A | 12 | 194 | 9592 | 279.78 | 159 | 156 | 33.7 |
| B | 0 | 183 | 280518 | 9076.13 | 151 | 148 | 30.9 |
| B | 10 | 245 | 13852 | 443.63 | 151 | 148 | 30.9 |
| B | 0 | 155 | 9839 | 313.72 | 151 | 148 | 30.9 |
| C | 15 | 214 | 56436 | 1504.1 | 155 | 156 | 37.4 |
| C | 0 | 10 | 17815 | 471.94 | 155 | 156 | 37.4 |
| C | 14 | 254 | 7049 | 184.22 | 155 | 156 | 37.4 |
| D | 10 | 203 | 1114968 | 28813.61 | 153 | 148 | 38.7 |
| D | 2 | 250 | 81538 | 2103.6 | 153 | 148 | 38.7 |
| D | 1 | 20 | 49948 | 1287.13 | 153 | 148 | 38.7 |
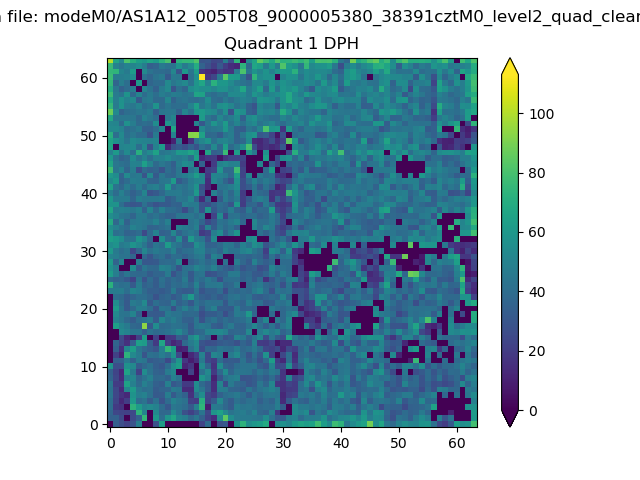
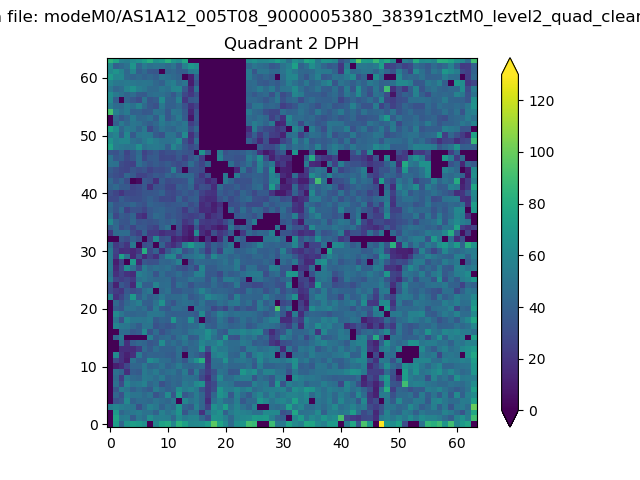
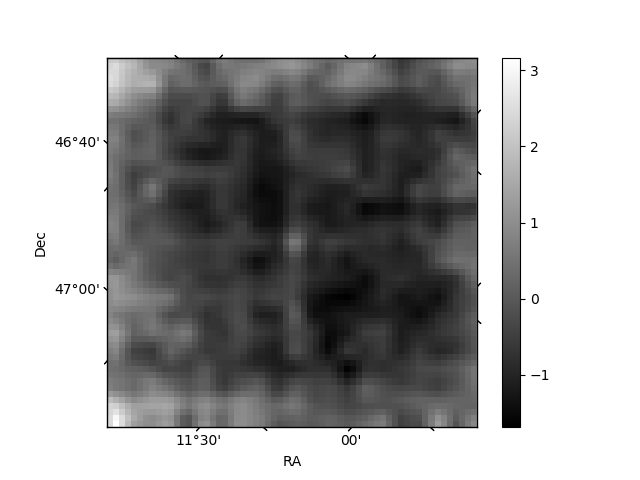
Histogram calculated using DETX and DETY for each event in the final _common_clean file
| Quadrant A |  |
 |
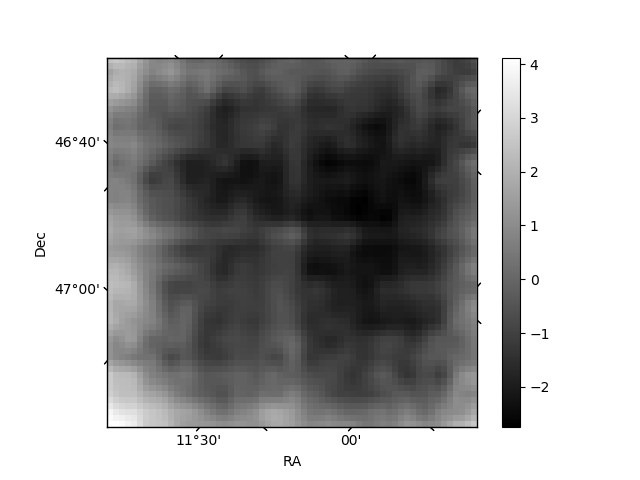
Quadrant B |
|---|---|---|---|
| Quadrant D |  |
 |
Quadrant C |
| Plot type | Count rate plots | Images |
|---|---|---|
| Comparison with Poisson distribution Blue bars denote a histogram of data divided into 1 sec bins. Red curve is a Poisson curve with rate = median count rate of data. |
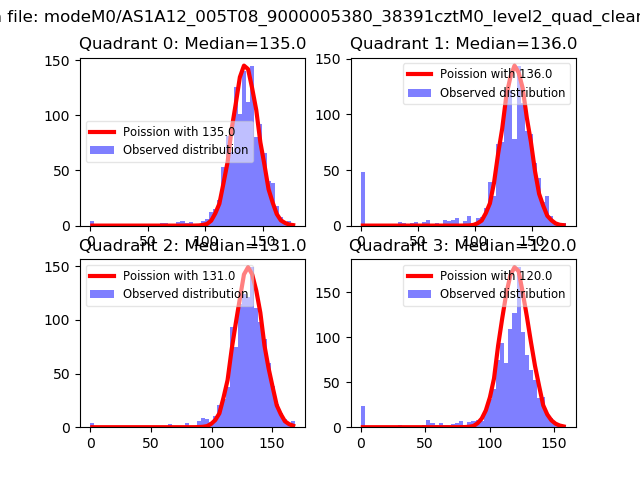 |
 |
| Quadrant-wise count rates Data is divided into 100 sec bins |
 |
|
| Module-wise count rates for Quadrant A Data is divided into 100 sec bins |
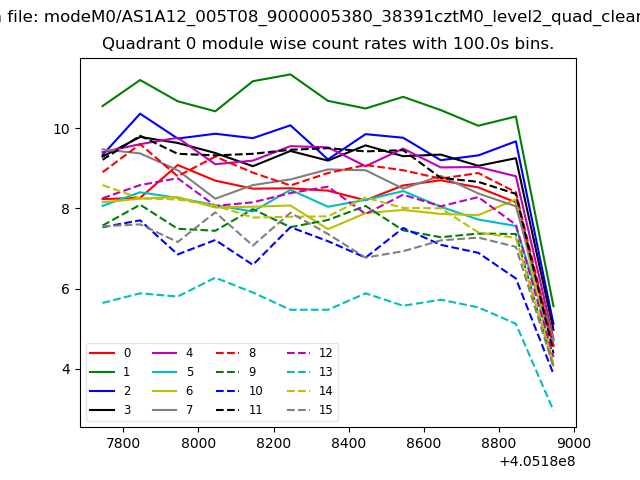 |
 |
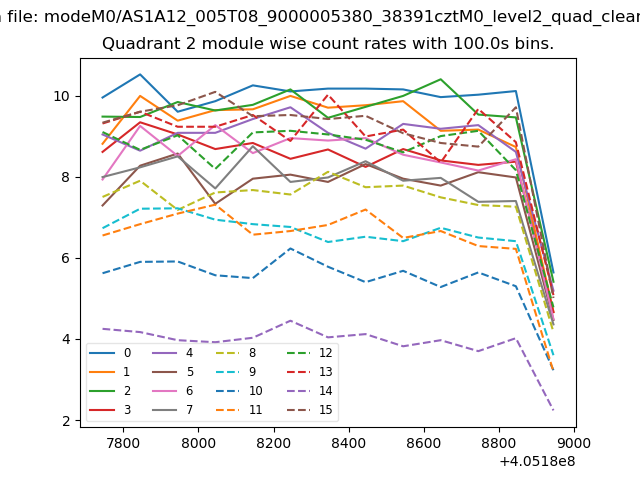
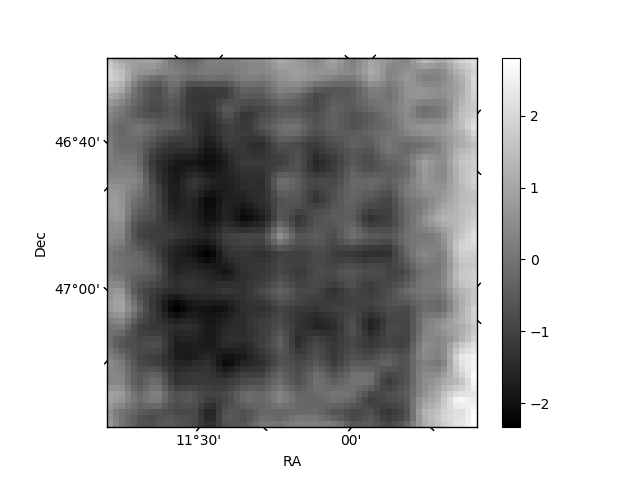
| Module-wise count rates for Quadrant B Data is divided into 100 sec bins |
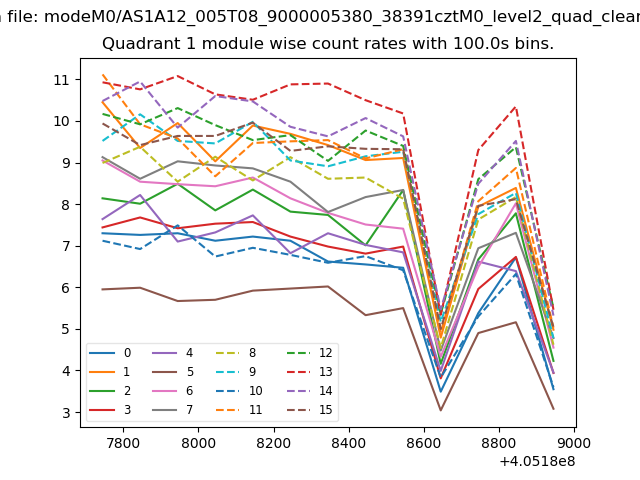 |
 |
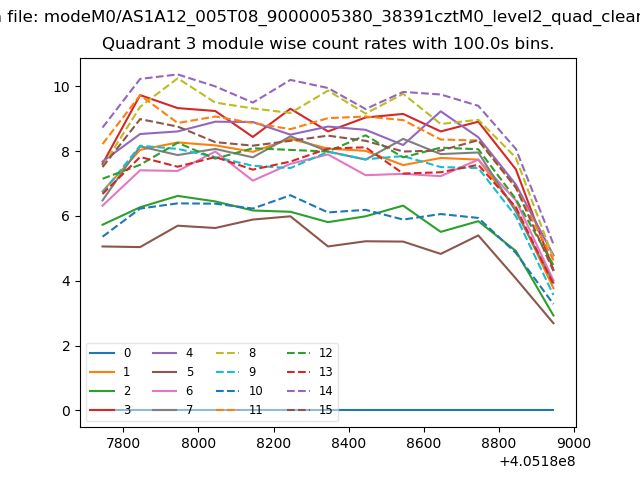
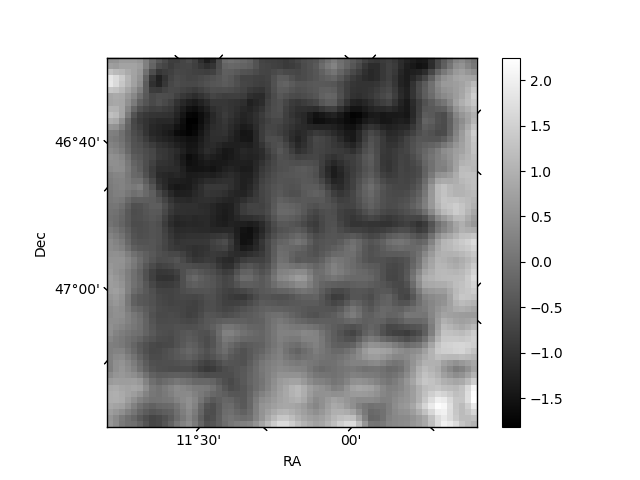
| Module-wise count rates for Quadrant C Data is divided into 100 sec bins |
 |
 |
| Module-wise count rates for Quadrant D Data is divided into 100 sec bins |
 |
 |
| Parameter | Plot |
|---|---|
| CZT HV Monitor | 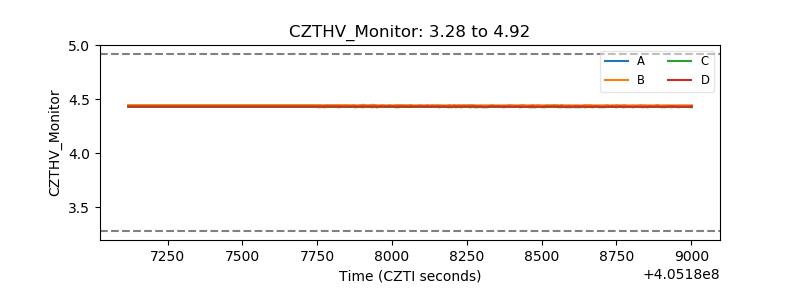 |
| D_VDD | 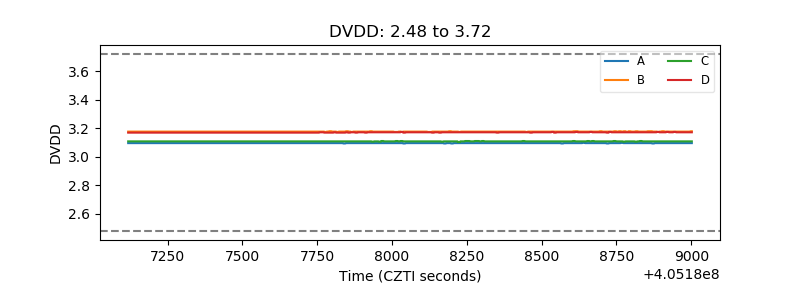 |
| Temperature 1 | 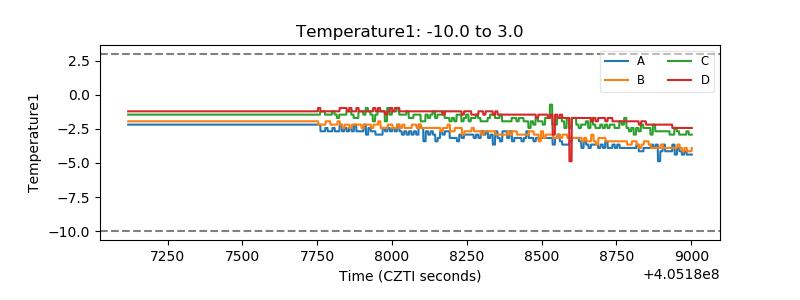 |
| Veto HV Monitor | 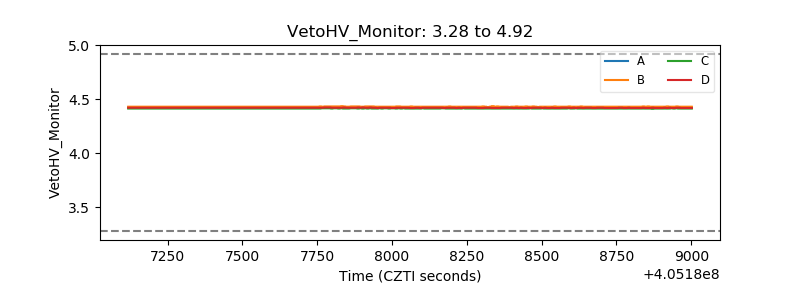 |
| Veto LLD | 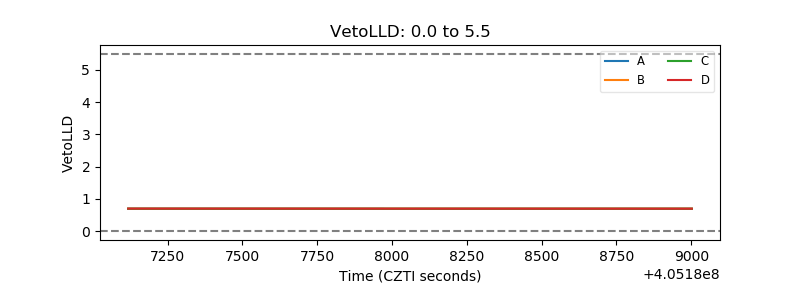 |
| Alpha Counter | 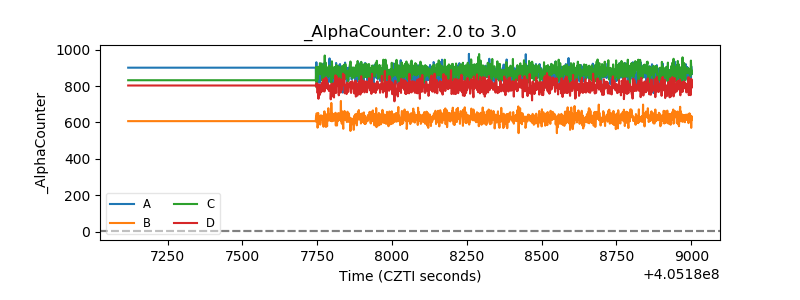 |
| _CPM_Rate | 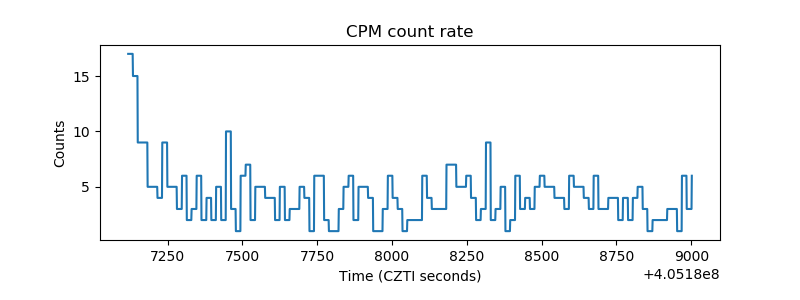 |
| CZT Counter |  |
| +2.5 Volts monitor | 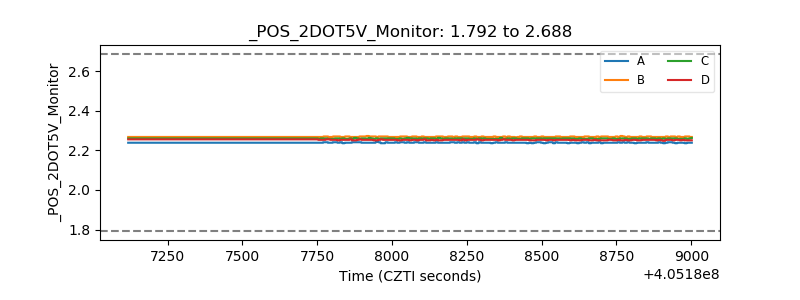 |
| +5 Volts monitor | 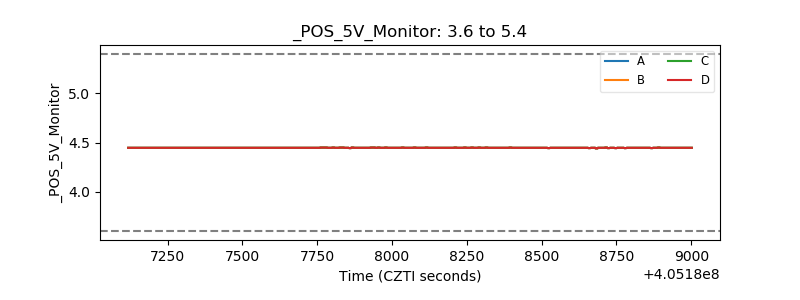 |
| _ROLL_ROT | 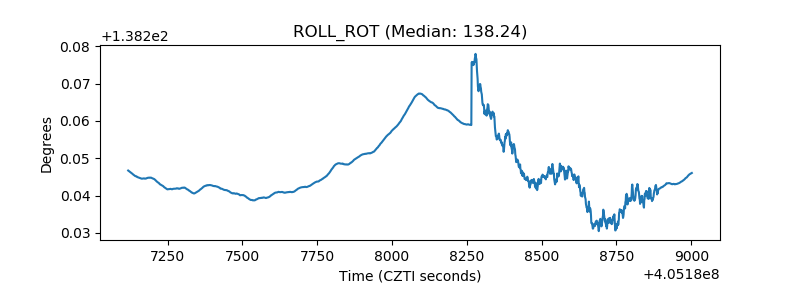 |
| _Roll_DEC | 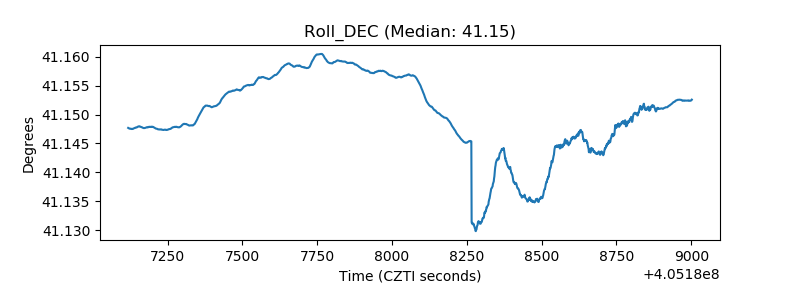 |
| _Roll_RA | 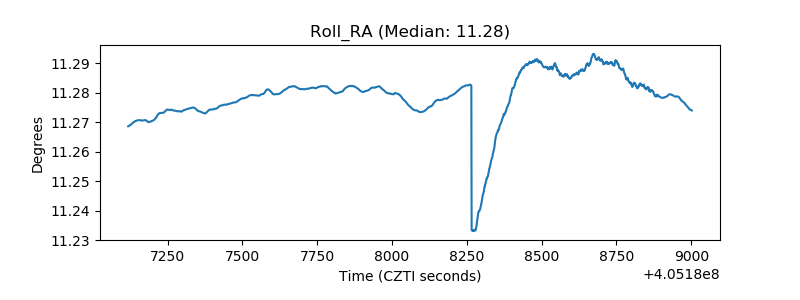 |
| Veto Counter | 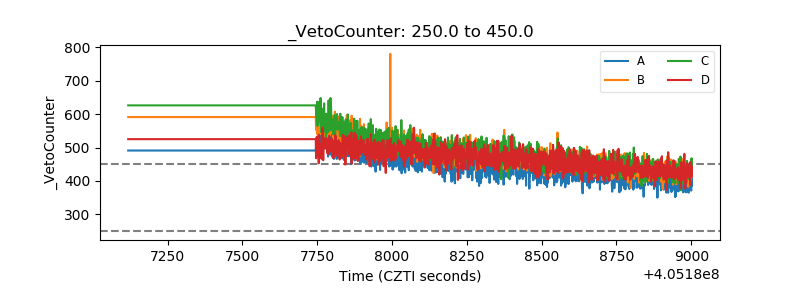 |