| Param | Original file | Final file |
|---|---|---|
| Filename | modeM0/AS1A12_006T07_9000005376_38366cztM0_level2.fits | modeM0/AS1A12_006T07_9000005376_38366cztM0_level2_quad_clean.evt |
| Size (bytes) | 27,578,880 | 5,641,920 |
| Size | 26.3 MB | 5.4 MB |
| Events in quadrant A | 167,250 | 37,309 |
| Events in quadrant B | 174,624 | 38,531 |
| Events in quadrant C | 157,209 | 35,132 |
| Events in quadrant D | 491,385 | 27,704 |
| Mode M0 | |||
|---|---|---|---|
| Quadrant | BADHDUFLAG | Total packets | Discarded packets |
| A | 0 | 704 | 1 |
| B | 0 | 746 | 0 |
| C | 0 | 693 | 0 |
| D | 0 | 1706 | 0 |
| Mode SS | |||
|---|---|---|---|
| Quadrant | BADHDUFLAG | Total packets | Discarded packets |
| A | 0 | 8 | 0 |
| B | 0 | 8 | 0 |
| C | 0 | 8 | 0 |
| D | 0 | 8 | 0 |
| Quadrant | Total seconds | Saturated seconds | Saturation percentage |
|---|---|---|---|
| A | 345 | 0 | 0.000000% |
| B | 345 | 0 | 0.000000% |
| C | 345 | 0 | 0.000000% |
| D | 345 | 59 | 17.101449% |
Noise dominated data is calculated using 1-second bins in cleaned event files. If a bin has >2000 counts, and if more than 50% of those come from <1% of pixels, then it is considered to be noise-dominated and hence unusable.
| Quadrant | # 1 sec bins | Bins with >0 counts | Bins with >2000 counts | High rate bins dominated by noise | Noise dominated (total time) | Noise dominated (detector-on time) | Marked lightcurve |
|---|---|---|---|---|---|---|---|
| A | 345 | 345 | 0 | 0 | 0.00% | 0.00% | 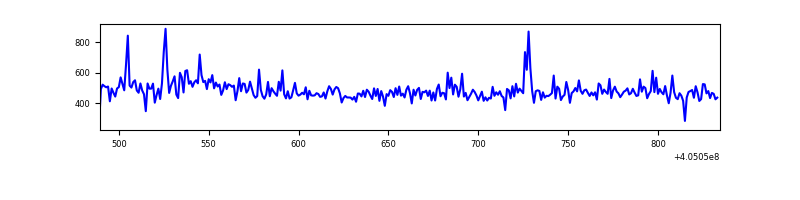 |
| B | 345 | 345 | 0 | 0 | 0.00% | 0.00% | 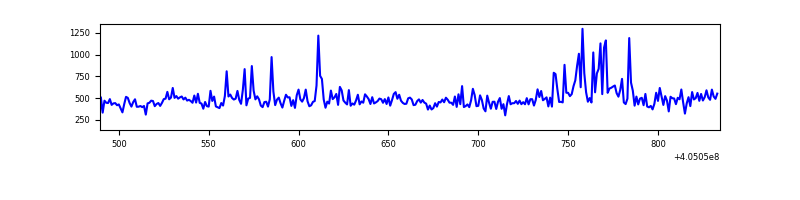 |
| C | 345 | 345 | 0 | 0 | 0.00% | 0.00% | 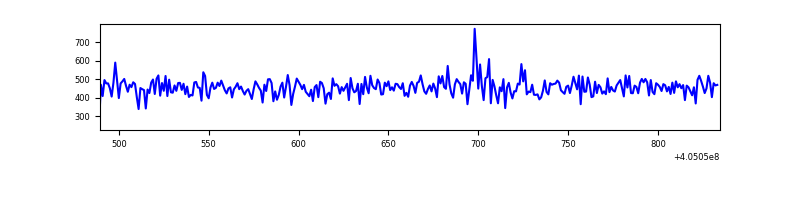 |
| D | 345 | 345 | 54 | 54 | 15.65% | 15.65% | 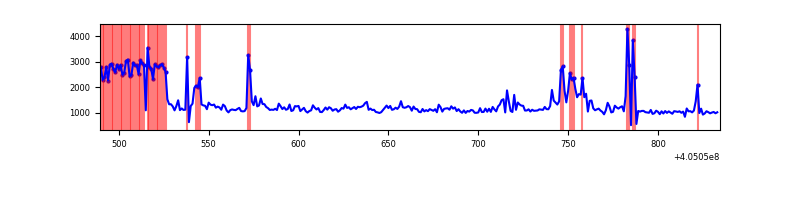 |
Top three noisy pixels from each quadrant. If the there are fewer than three noisy pixels in the level2.evt file, extra rows are filled as -1
| Pixel properties | Quadrant properties | ||||||
|---|---|---|---|---|---|---|---|
| Quadrant | DetID | PixID | Counts | Sigma | Mean | Median | Sigma |
| A | 10 | 83 | 17444 | 1806.41 | 36 | 36 | 9.6 |
| A | 9 | 143 | 4981 | 513.14 | 36 | 36 | 9.6 |
| A | 12 | 189 | 1731 | 175.89 | 36 | 36 | 9.6 |
| B | 0 | 183 | 20671 | 2208.4 | 36 | 35 | 9.3 |
| B | 0 | 189 | 2472 | 260.8 | 36 | 35 | 9.3 |
| B | 0 | 230 | 1619 | 169.51 | 36 | 35 | 9.3 |
| C | 15 | 214 | 13259 | 1238.69 | 36 | 36 | 10.7 |
| C | 14 | 254 | 746 | 66.51 | 36 | 36 | 10.7 |
| C | 13 | 61 | 272 | 22.11 | 36 | 36 | 10.7 |
| D | 10 | 203 | 174510 | 17370.49 | 32 | 31 | 10.0 |
| D | 12 | 227 | 128750 | 12814.79 | 32 | 31 | 10.0 |
| D | 11 | 176 | 46221 | 4598.51 | 32 | 31 | 10.0 |
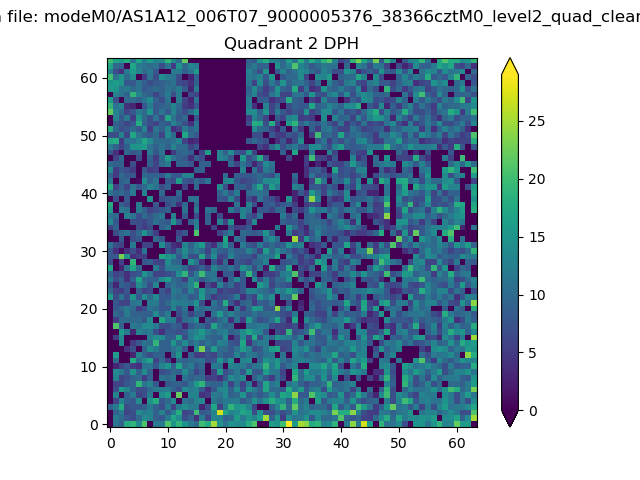
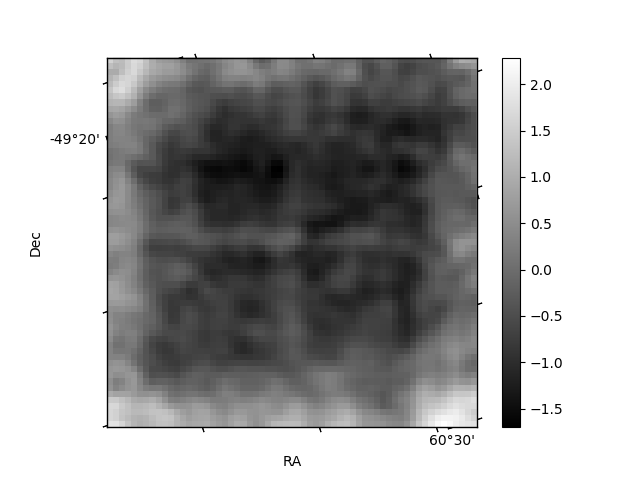
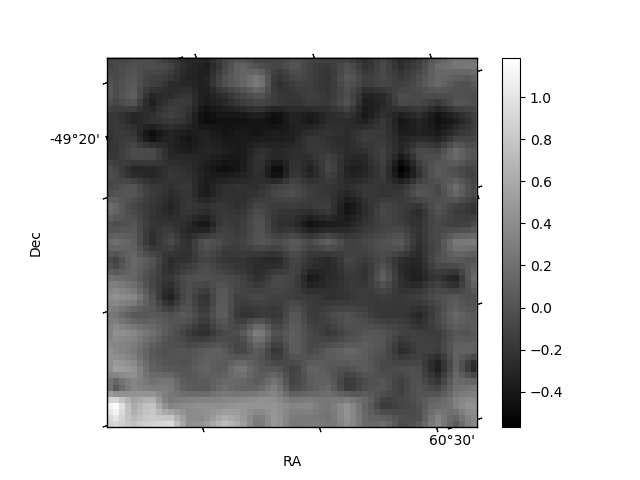
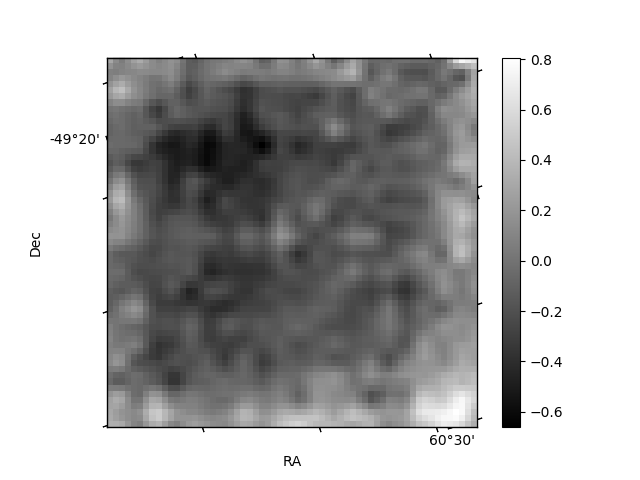
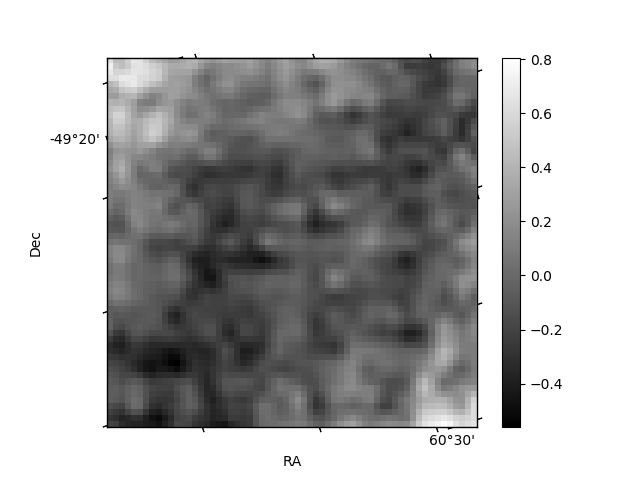
Histogram calculated using DETX and DETY for each event in the final _common_clean file
| Quadrant A | 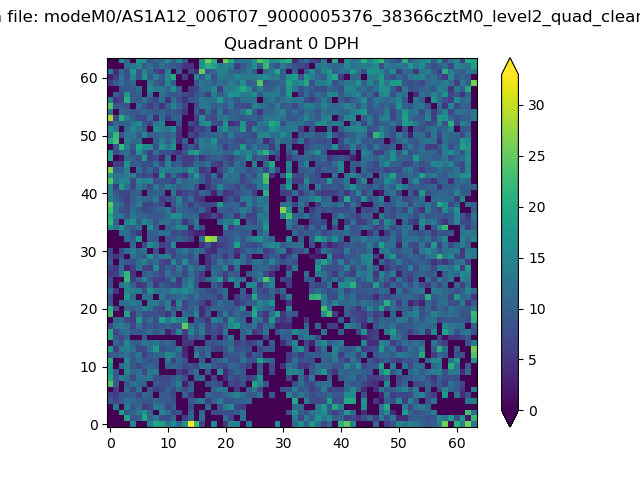 |
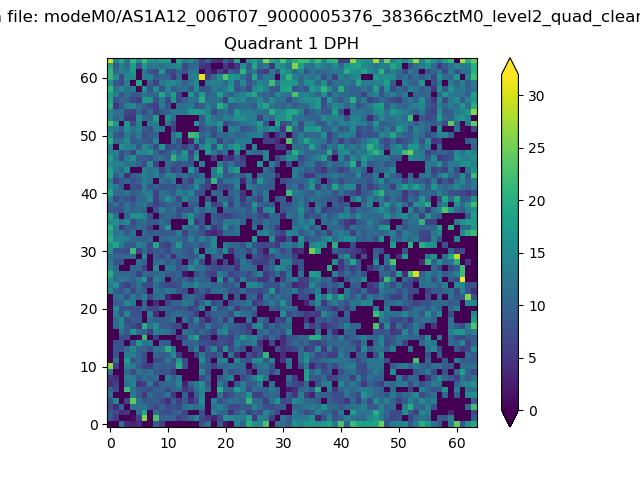 |
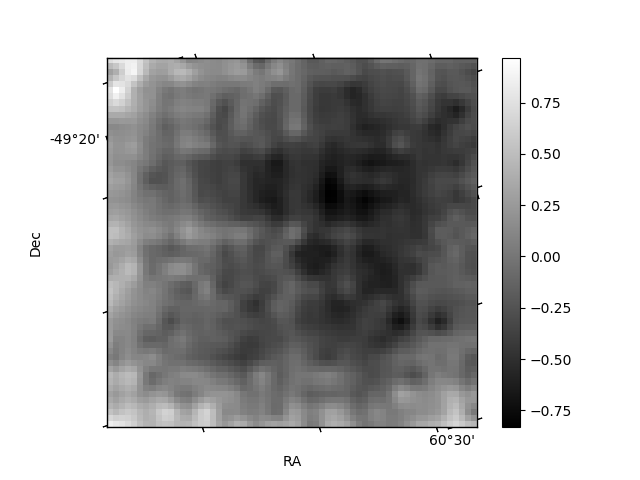
Quadrant B |
|---|---|---|---|
| Quadrant D | 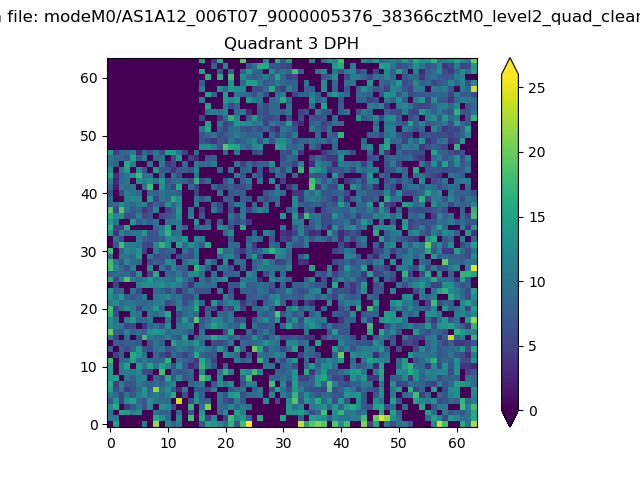 |
 |
Quadrant C |
| Plot type | Count rate plots | Images |
|---|---|---|
| Comparison with Poisson distribution Blue bars denote a histogram of data divided into 1 sec bins. Red curve is a Poisson curve with rate = median count rate of data. |
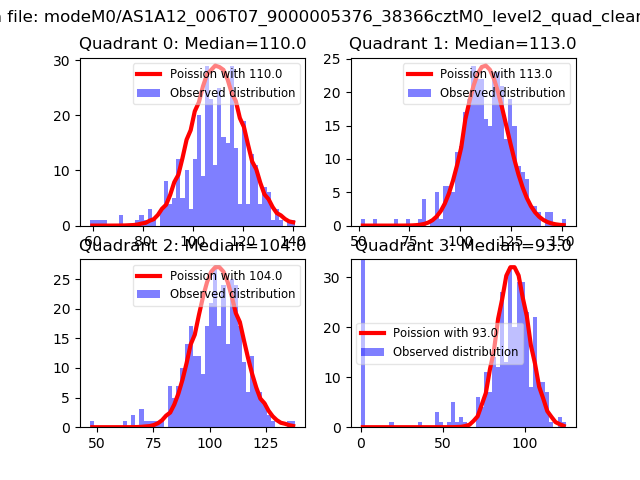 |
 |
| Quadrant-wise count rates Data is divided into 100 sec bins |
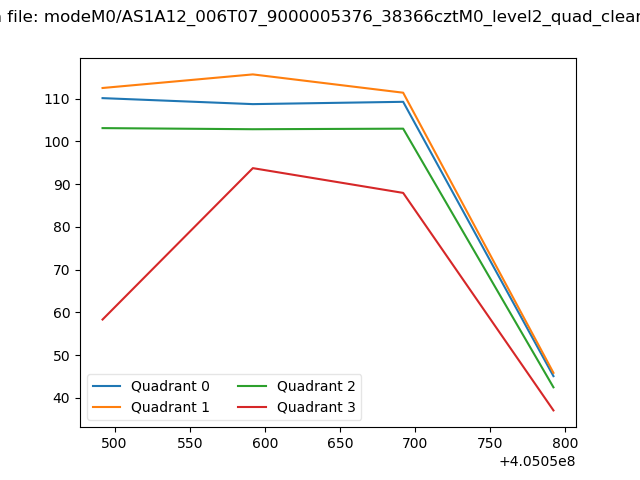 |
|
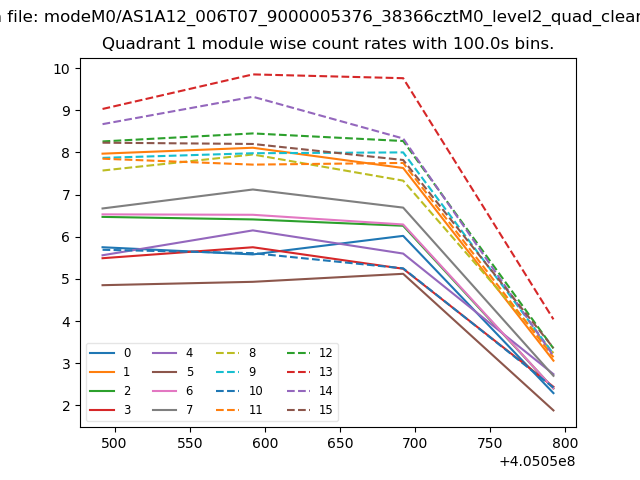
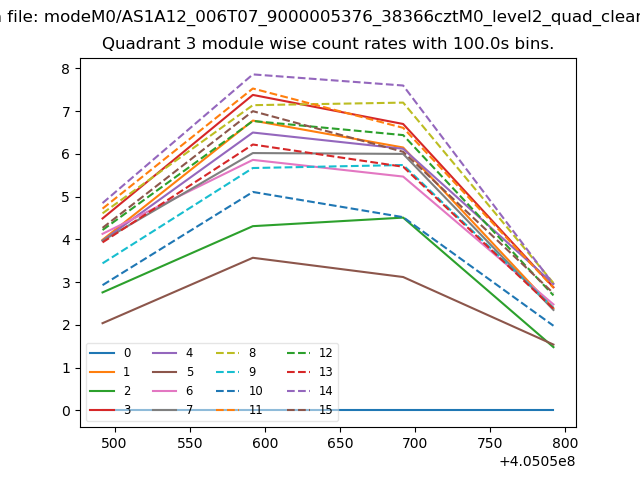
| Module-wise count rates for Quadrant A Data is divided into 100 sec bins |
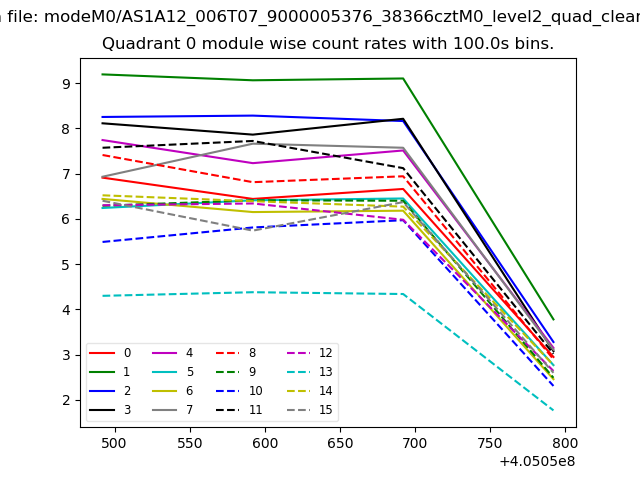 |
 |
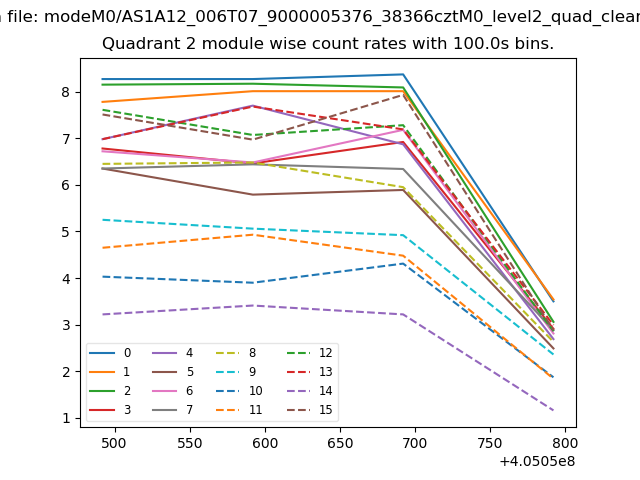
| Module-wise count rates for Quadrant B Data is divided into 100 sec bins |
 |
 |
| Module-wise count rates for Quadrant C Data is divided into 100 sec bins |
 |
 |
| Module-wise count rates for Quadrant D Data is divided into 100 sec bins |
 |
 |
| Parameter | Plot |
|---|---|
| CZT HV Monitor | 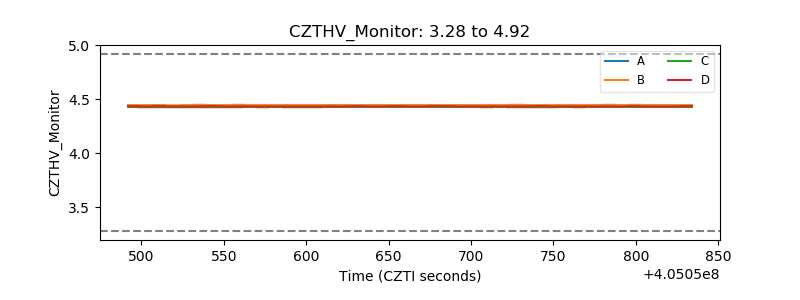 |
| D_VDD | 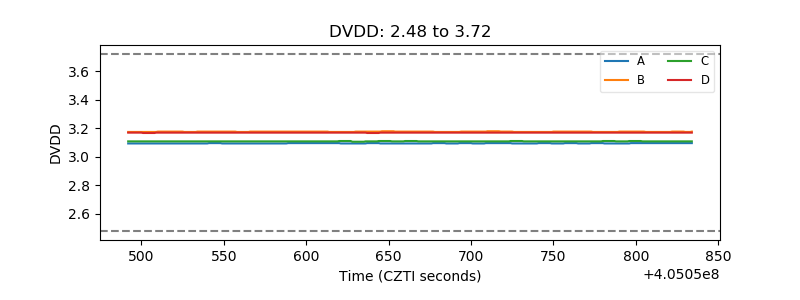 |
| Temperature 1 | 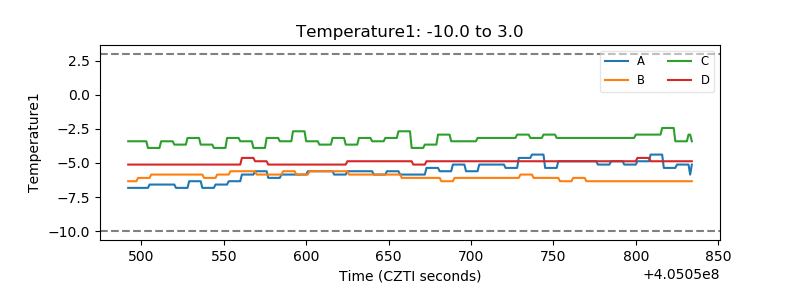 |
| Veto HV Monitor | 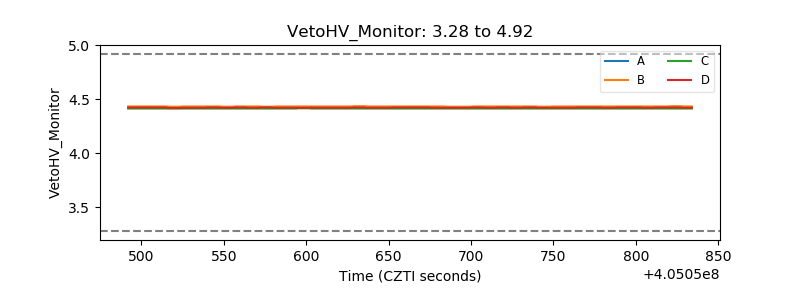 |
| Veto LLD | 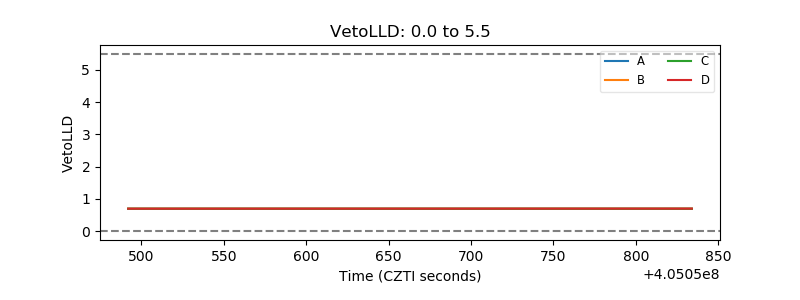 |
| Alpha Counter | 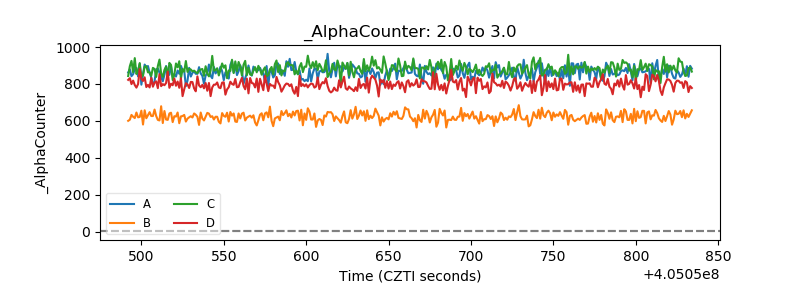 |
| _CPM_Rate | 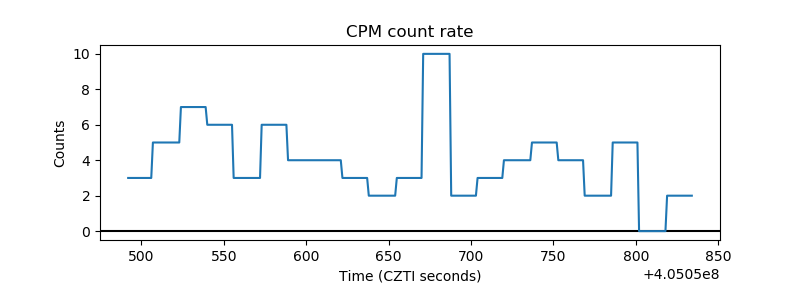 |
| CZT Counter | 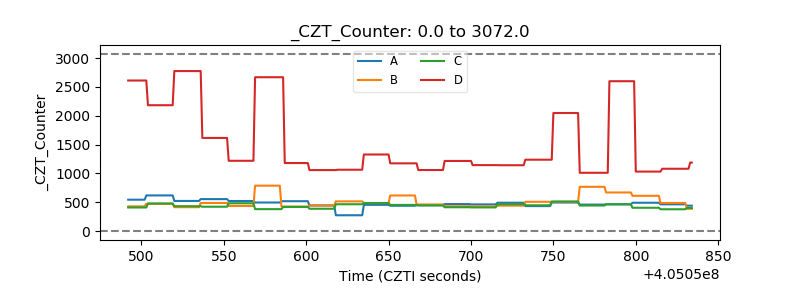 |
| +2.5 Volts monitor | 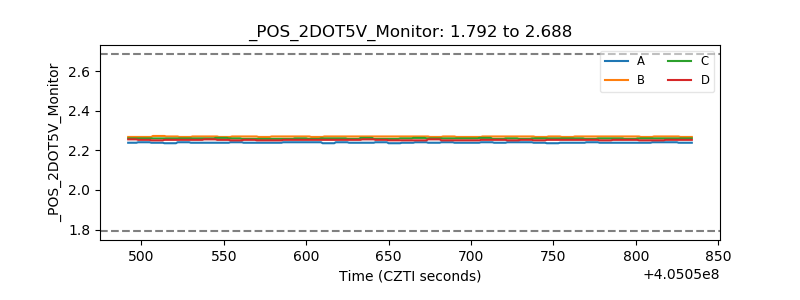 |
| +5 Volts monitor | 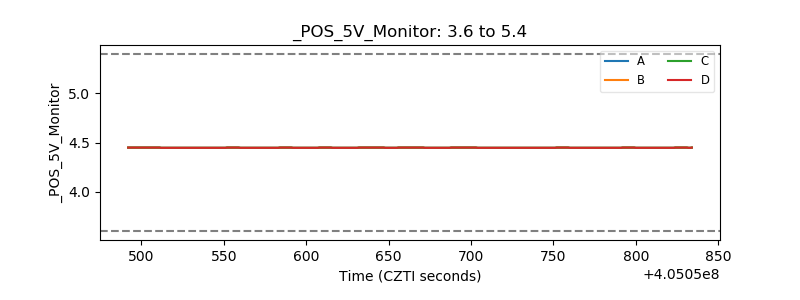 |
| _ROLL_ROT | 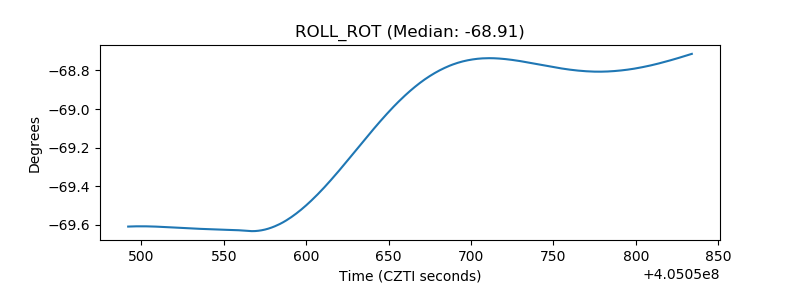 |
| _Roll_DEC | 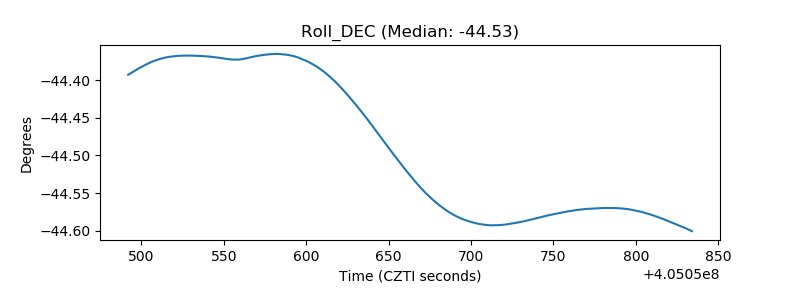 |
| _Roll_RA | 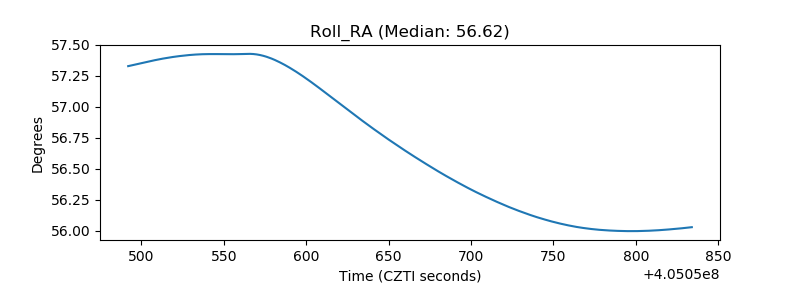 |
| Veto Counter | 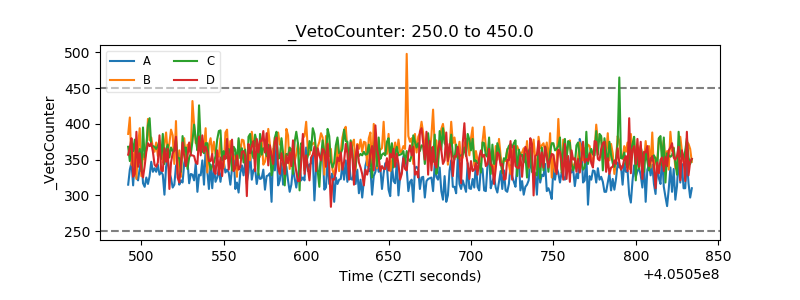 |