| Param | Original file | Final file |
|---|---|---|
| Filename | modeM0/AS1A12_006T07_9000005376_38369cztM0_level2.fits | modeM0/AS1A12_006T07_9000005376_38369cztM0_level2_quad_clean.evt |
| Size (bytes) | 1,320,356,160 | 232,315,200 |
| Size | 1.2 GB | 221.6 MB |
| Events in quadrant A | 7,915,765 | 1,628,454 |
| Events in quadrant B | 7,173,891 | 1,687,878 |
| Events in quadrant C | 7,415,584 | 1,614,993 |
| Events in quadrant D | 25,227,015 | 1,080,073 |
| Mode M0 | |||
|---|---|---|---|
| Quadrant | BADHDUFLAG | Total packets | Discarded packets |
| A | 0 | 32262 | 4 |
| B | 0 | 30899 | 3 |
| C | 0 | 30969 | 3 |
| D | 0 | 85368 | 3 |
| Mode M9 | |||
|---|---|---|---|
| Quadrant | BADHDUFLAG | Total packets | Discarded packets |
| A | 0 | 42 | 0 |
| B | 0 | 42 | 0 |
| C | 0 | 42 | 0 |
| D | 0 | 42 | 0 |
| Mode SS | |||
|---|---|---|---|
| Quadrant | BADHDUFLAG | Total packets | Discarded packets |
| A | 0 | 304 | 0 |
| B | 0 | 304 | 0 |
| C | 0 | 304 | 0 |
| D | 0 | 304 | 0 |
| Quadrant | Total seconds | Saturated seconds | Saturation percentage |
|---|---|---|---|
| A | 14801 | 95 | 0.641849% |
| B | 14801 | 39 | 0.263496% |
| C | 14801 | 75 | 0.506723% |
| D | 14801 | 4450 | 30.065536% |
Noise dominated data is calculated using 1-second bins in cleaned event files. If a bin has >2000 counts, and if more than 50% of those come from <1% of pixels, then it is considered to be noise-dominated and hence unusable.
| Quadrant | # 1 sec bins | Bins with >0 counts | Bins with >2000 counts | High rate bins dominated by noise | Noise dominated (total time) | Noise dominated (detector-on time) | Marked lightcurve |
|---|---|---|---|---|---|---|---|
| A | 19039 | 14804 | 57 | 57 | 0.30% | 0.39% | 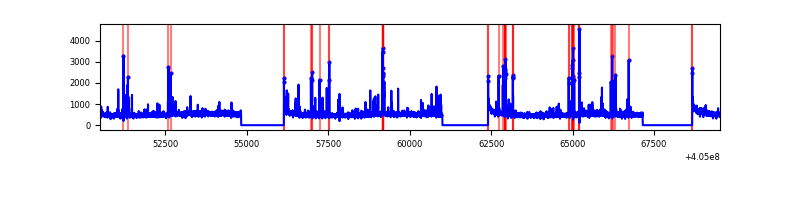 |
| B | 19039 | 14804 | 5 | 5 | 0.03% | 0.03% | 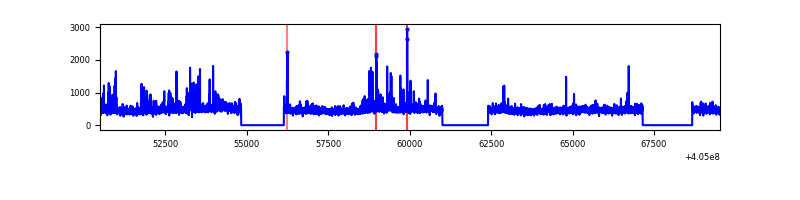 |
| C | 19039 | 14804 | 54 | 54 | 0.28% | 0.36% | 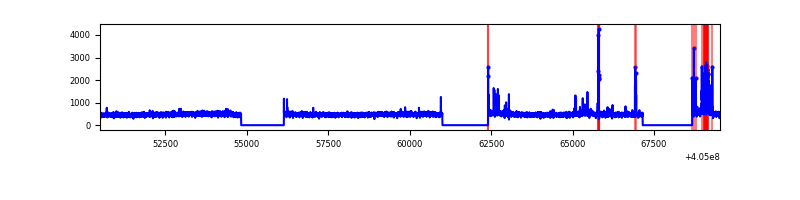 |
| D | 19039 | 14804 | 4764 | 4764 | 25.02% | 32.18% | 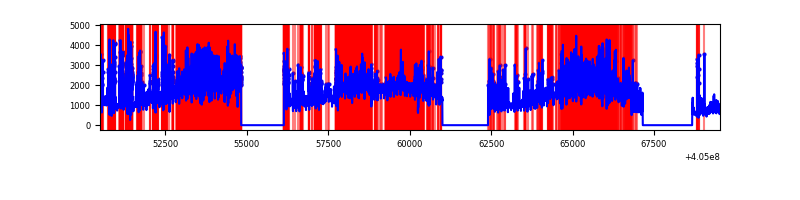 |
Top three noisy pixels from each quadrant. If the there are fewer than three noisy pixels in the level2.evt file, extra rows are filled as -1
| Pixel properties | Quadrant properties | ||||||
|---|---|---|---|---|---|---|---|
| Quadrant | DetID | PixID | Counts | Sigma | Mean | Median | Sigma |
| A | 10 | 83 | 886360 | 2624.92 | 1672 | 1636 | 337.0 |
| A | 9 | 143 | 363796 | 1074.51 | 1672 | 1636 | 337.0 |
| A | 12 | 189 | 86210 | 250.92 | 1672 | 1636 | 337.0 |
| B | 0 | 183 | 281018 | 874.49 | 1668 | 1623 | 319.5 |
| B | 4 | 21 | 102053 | 314.34 | 1668 | 1623 | 319.5 |
| B | 0 | 229 | 56757 | 172.57 | 1668 | 1623 | 319.5 |
| C | 15 | 214 | 606265 | 1588.23 | 1641 | 1650 | 380.7 |
| C | 5 | 250 | 322207 | 842.05 | 1641 | 1650 | 380.7 |
| C | 14 | 254 | 27887 | 68.92 | 1641 | 1650 | 380.7 |
| D | 10 | 203 | 11540606 | 32280.05 | 1470 | 1429 | 357.5 |
| D | 12 | 227 | 2034282 | 5686.76 | 1470 | 1429 | 357.5 |
| D | 1 | 20 | 1807958 | 5053.64 | 1470 | 1429 | 357.5 |
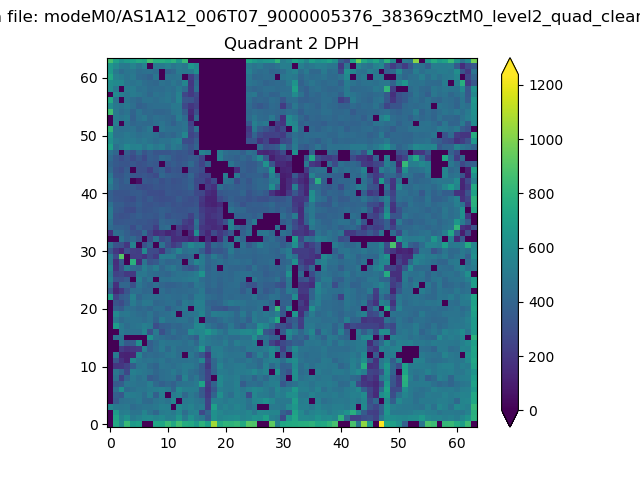
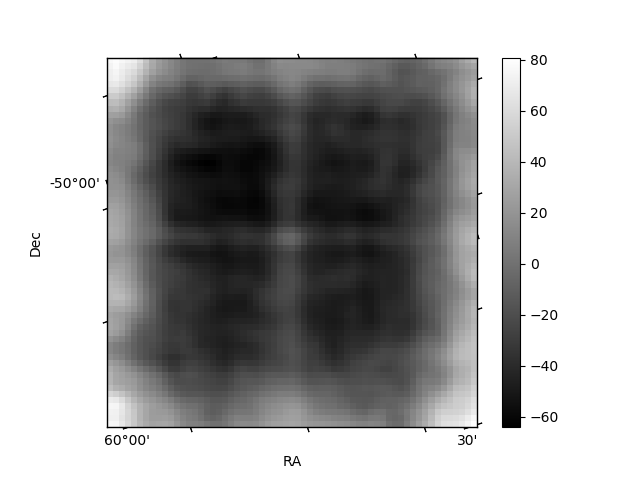
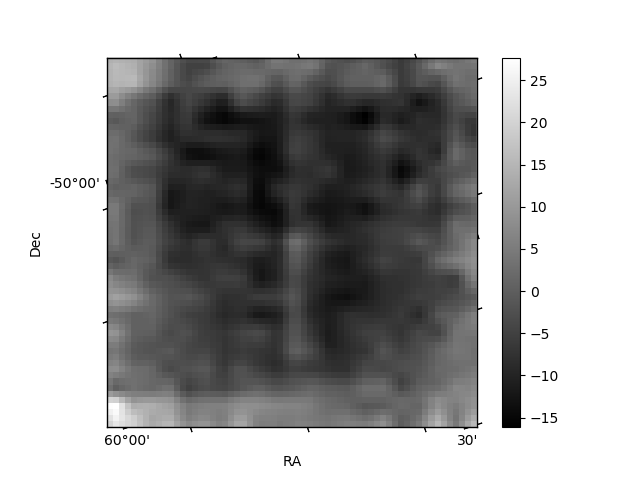
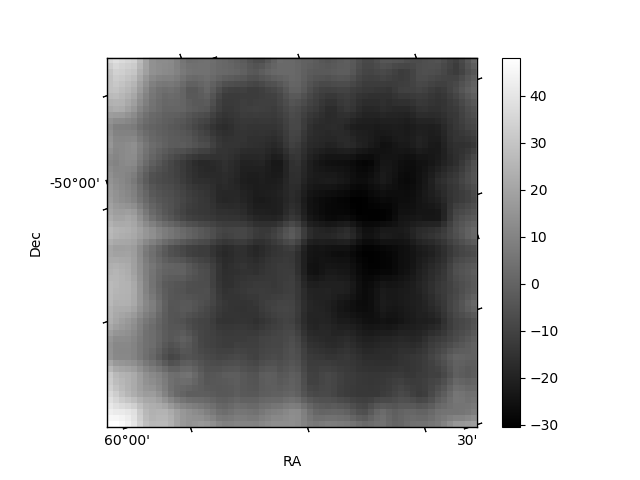
Histogram calculated using DETX and DETY for each event in the final _common_clean file
| Quadrant A | 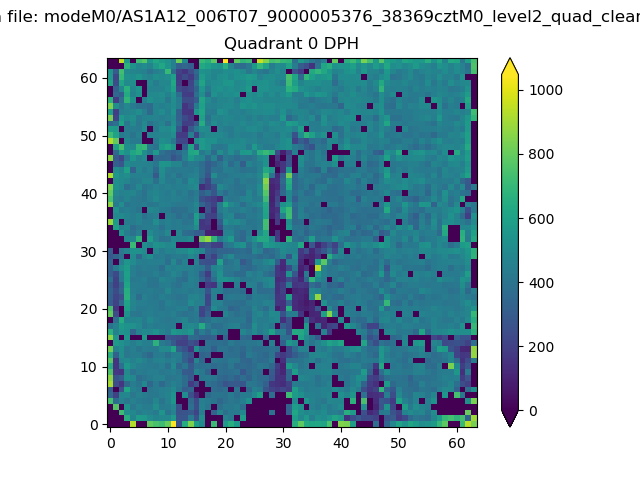 |
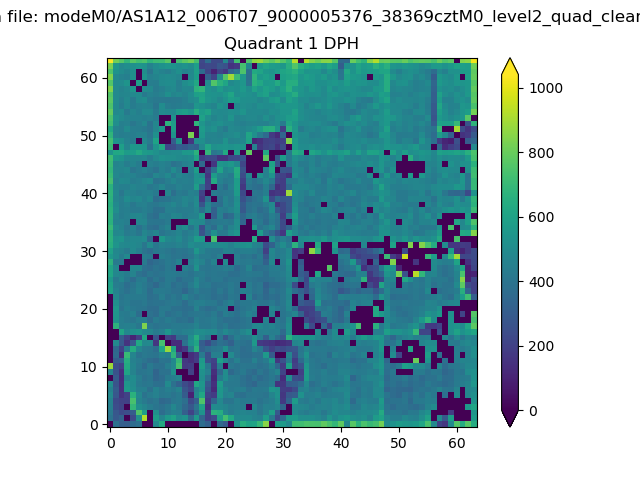 |
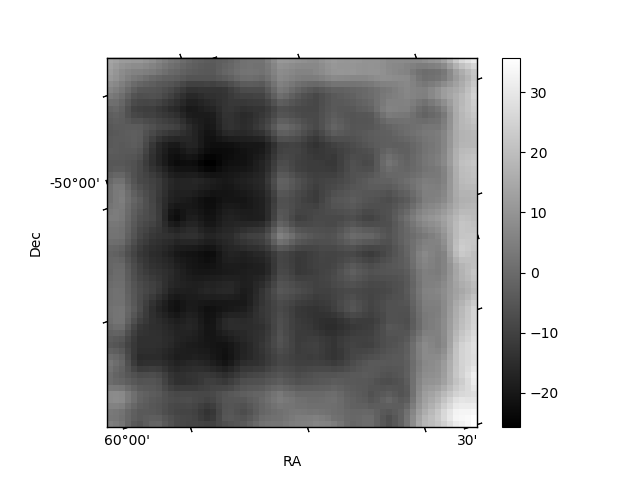
Quadrant B |
|---|---|---|---|
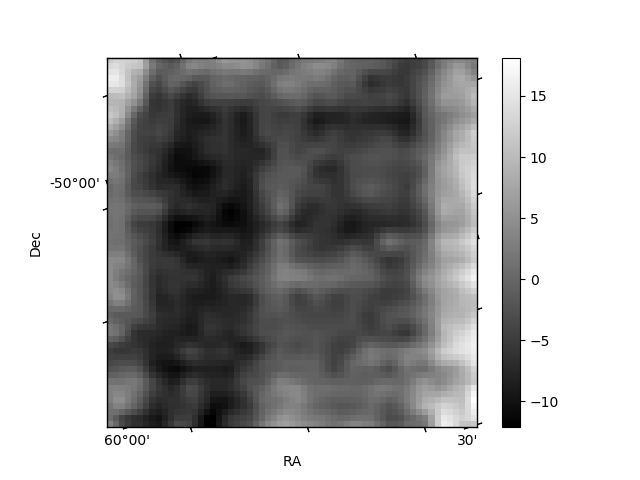
| Quadrant D | 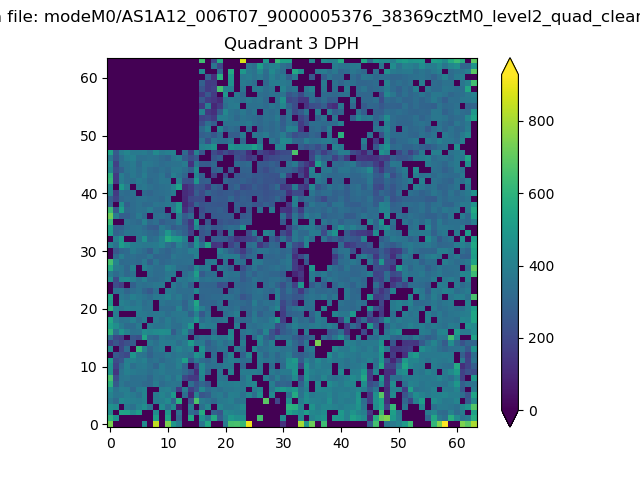 |
 |
Quadrant C |
| Plot type | Count rate plots | Images |
|---|---|---|
| Comparison with Poisson distribution Blue bars denote a histogram of data divided into 1 sec bins. Red curve is a Poisson curve with rate = median count rate of data. |
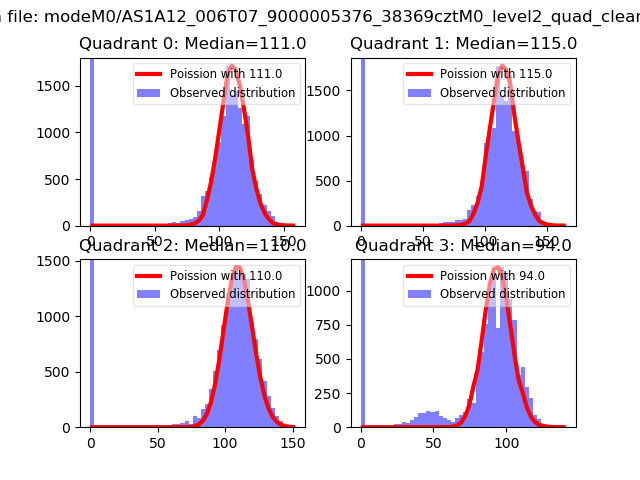 |
 |
| Quadrant-wise count rates Data is divided into 100 sec bins |
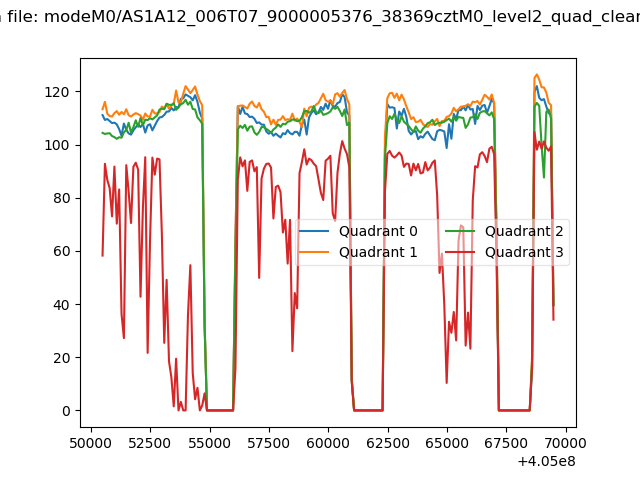 |
|
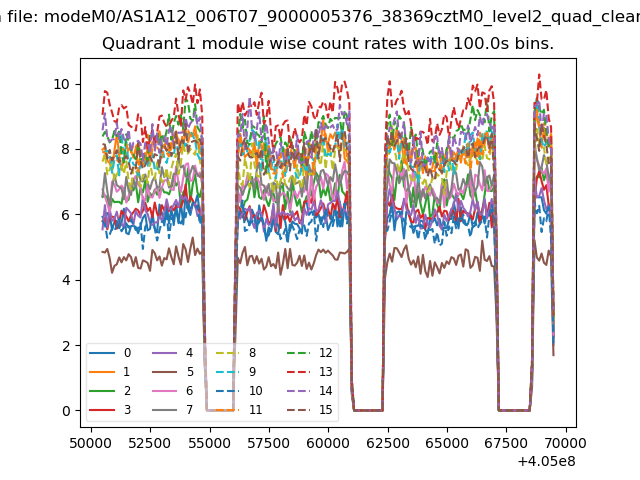
| Module-wise count rates for Quadrant A Data is divided into 100 sec bins |
 |
 |
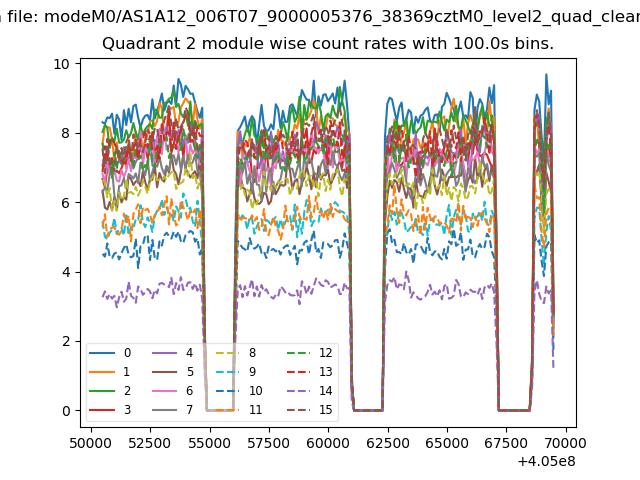
| Module-wise count rates for Quadrant B Data is divided into 100 sec bins |
 |
 |
| Module-wise count rates for Quadrant C Data is divided into 100 sec bins |
 |
 |
| Module-wise count rates for Quadrant D Data is divided into 100 sec bins |
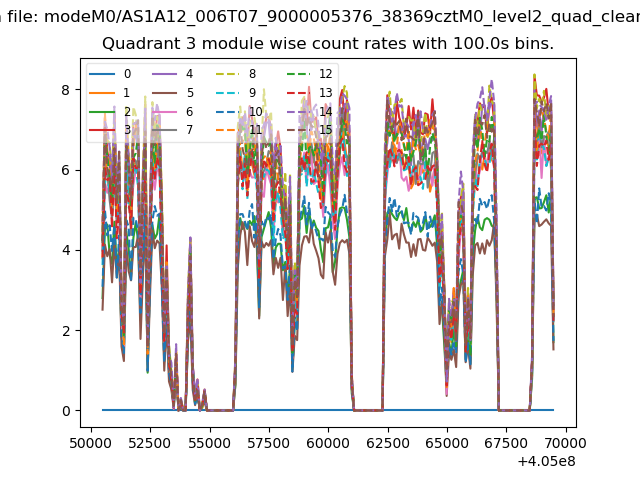 |
 |
| Parameter | Plot |
|---|---|
| CZT HV Monitor | 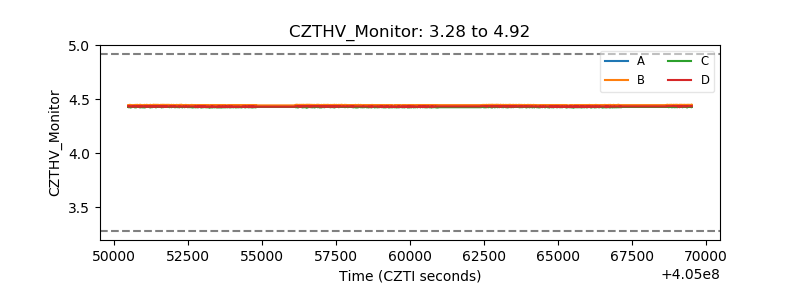 |
| D_VDD | 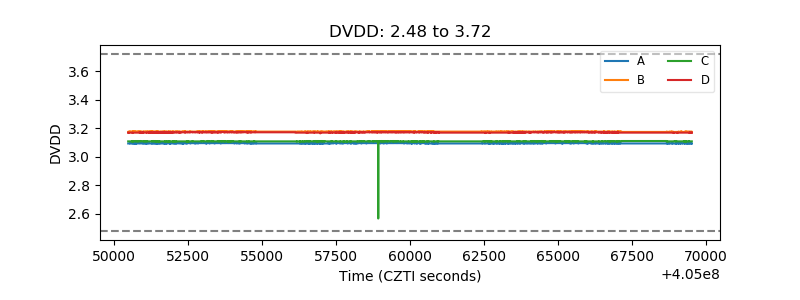 |
| Temperature 1 | 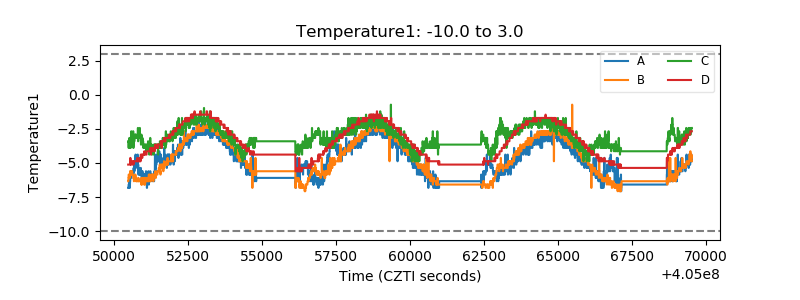 |
| Veto HV Monitor | 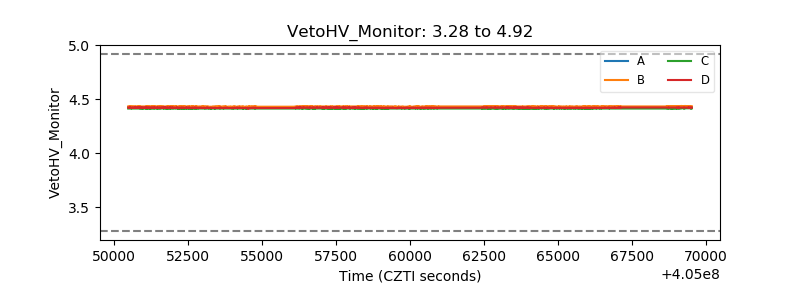 |
| Veto LLD | 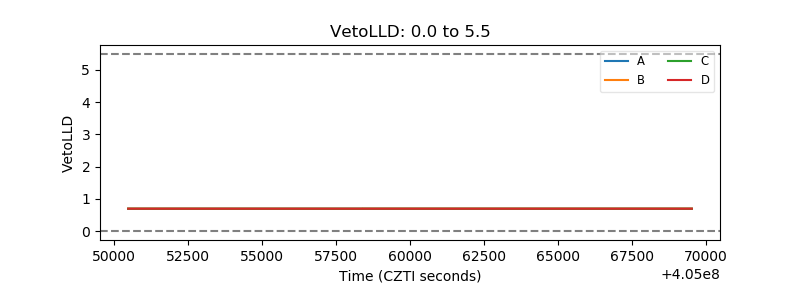 |
| Alpha Counter | 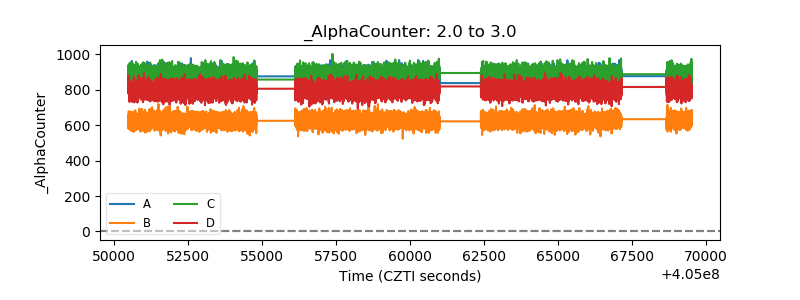 |
| _CPM_Rate | 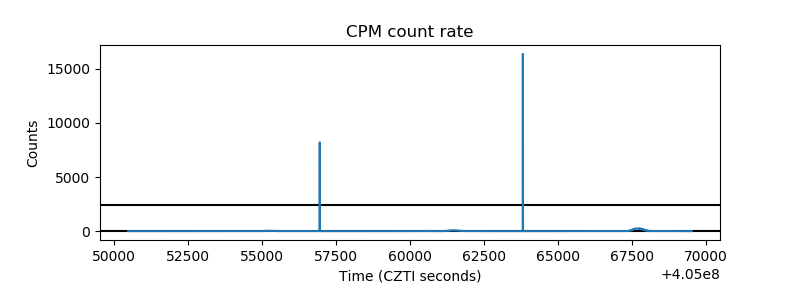 |
| CZT Counter | 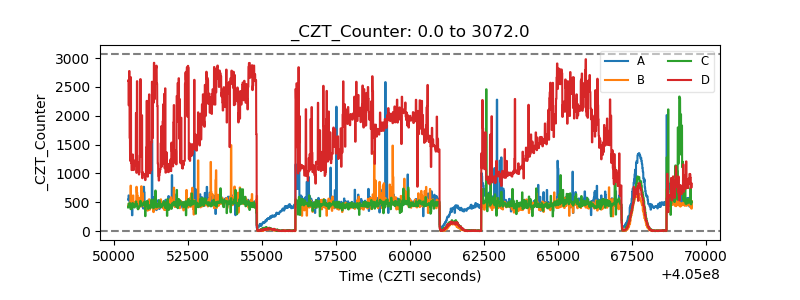 |
| +2.5 Volts monitor | 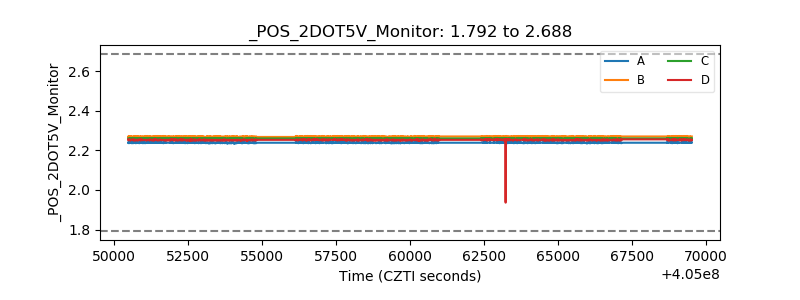 |
| +5 Volts monitor | 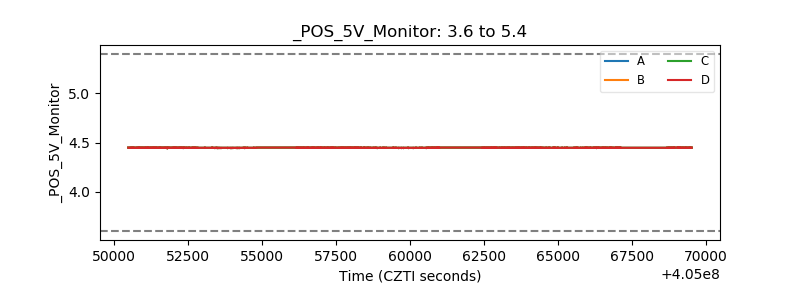 |
| _ROLL_ROT | 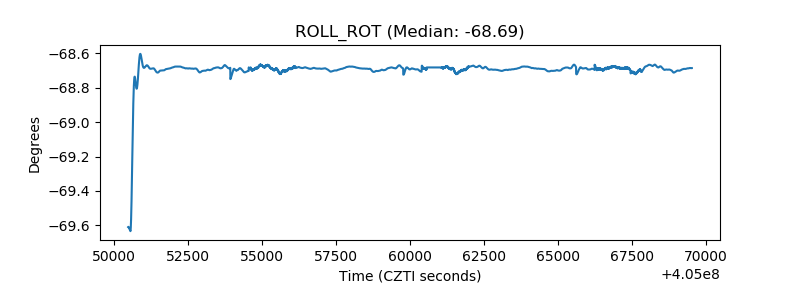 |
| _Roll_DEC | 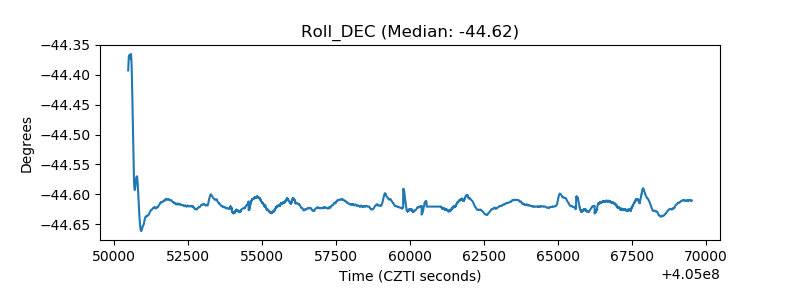 |
| _Roll_RA | 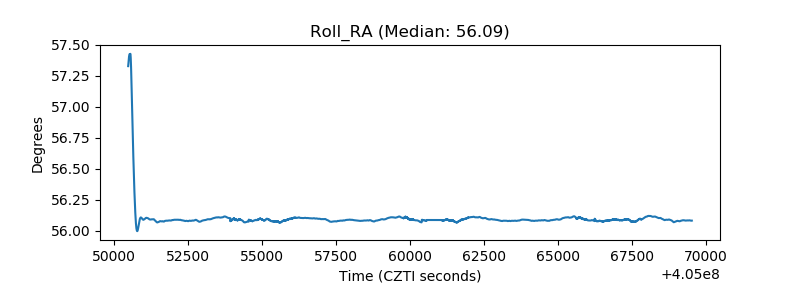 |
| Veto Counter | 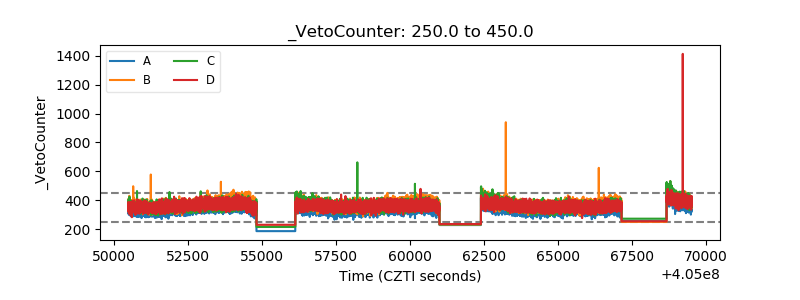 |