| Param | Original file | Final file |
|---|---|---|
| Filename | modeM0/AS1A12_006T07_9000005376_38370cztM0_level2.fits | modeM0/AS1A12_006T07_9000005376_38370cztM0_level2_quad_clean.evt |
| Size (bytes) | 420,621,120 | 89,893,440 |
| Size | 401.1 MB | 85.7 MB |
| Events in quadrant A | 3,040,484 | 619,643 |
| Events in quadrant B | 3,805,806 | 581,057 |
| Events in quadrant C | 3,300,035 | 604,997 |
| Events in quadrant D | 4,998,795 | 533,859 |
| Mode M0 | |||
|---|---|---|---|
| Quadrant | BADHDUFLAG | Total packets | Discarded packets |
| A | 0 | 12413 | 3 |
| B | 0 | 14884 | 2 |
| C | 0 | 13344 | 2 |
| D | 0 | 18741 | 2 |
| Mode M9 | |||
|---|---|---|---|
| Quadrant | BADHDUFLAG | Total packets | Discarded packets |
| A | 0 | 20 | 0 |
| B | 0 | 20 | 0 |
| C | 0 | 20 | 0 |
| D | 0 | 21 | 0 |
| Mode SS | |||
|---|---|---|---|
| Quadrant | BADHDUFLAG | Total packets | Discarded packets |
| A | 0 | 110 | 0 |
| B | 0 | 110 | 0 |
| C | 0 | 110 | 0 |
| D | 0 | 110 | 0 |
| Quadrant | Total seconds | Saturated seconds | Saturation percentage |
|---|---|---|---|
| A | 5465 | 34 | 0.622141% |
| B | 5465 | 509 | 9.313815% |
| C | 5465 | 166 | 3.037511% |
| D | 5465 | 367 | 6.715462% |
Noise dominated data is calculated using 1-second bins in cleaned event files. If a bin has >2000 counts, and if more than 50% of those come from <1% of pixels, then it is considered to be noise-dominated and hence unusable.
| Quadrant | # 1 sec bins | Bins with >0 counts | Bins with >2000 counts | High rate bins dominated by noise | Noise dominated (total time) | Noise dominated (detector-on time) | Marked lightcurve |
|---|---|---|---|---|---|---|---|
| A | 7108 | 5466 | 10 | 10 | 0.14% | 0.18% | 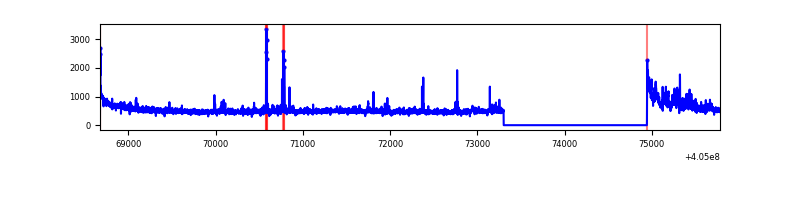 |
| B | 7108 | 5466 | 368 | 368 | 5.18% | 6.73% | 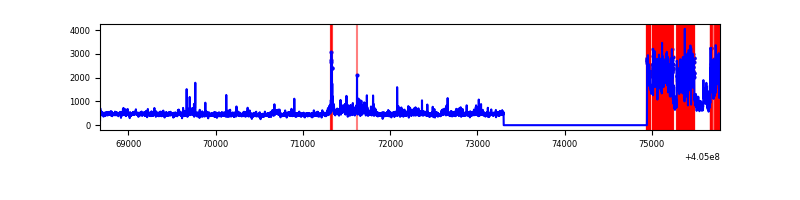 |
| C | 7108 | 5466 | 110 | 110 | 1.55% | 2.01% | 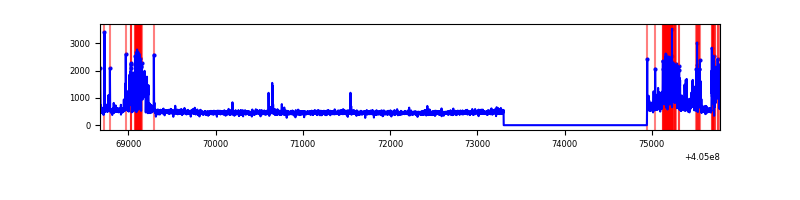 |
| D | 7108 | 5466 | 279 | 279 | 3.93% | 5.10% | 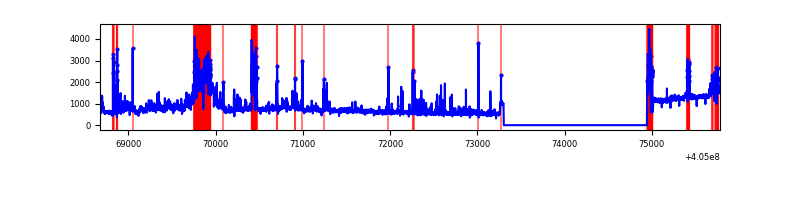 |
Top three noisy pixels from each quadrant. If the there are fewer than three noisy pixels in the level2.evt file, extra rows are filled as -1
| Pixel properties | Quadrant properties | ||||||
|---|---|---|---|---|---|---|---|
| Quadrant | DetID | PixID | Counts | Sigma | Mean | Median | Sigma |
| A | 10 | 83 | 382614 | 3050.54 | 619 | 606 | 125.2 |
| A | 12 | 16 | 138134 | 1098.24 | 619 | 606 | 125.2 |
| A | 9 | 143 | 63463 | 501.95 | 619 | 606 | 125.2 |
| B | 5 | 184 | 1164904 | 10101.44 | 597 | 581 | 115.3 |
| B | 0 | 183 | 130514 | 1127.27 | 597 | 581 | 115.3 |
| B | 4 | 21 | 77356 | 666.09 | 597 | 581 | 115.3 |
| C | 14 | 254 | 436646 | 3091.51 | 605 | 609 | 141.0 |
| C | 5 | 250 | 236067 | 1669.4 | 605 | 609 | 141.0 |
| C | 15 | 214 | 231804 | 1639.18 | 605 | 609 | 141.0 |
| D | 10 | 203 | 1481427 | 10164.07 | 594 | 576 | 145.7 |
| D | 7 | 38 | 429189 | 2941.86 | 594 | 576 | 145.7 |
| D | 2 | 16 | 353609 | 2423.1 | 594 | 576 | 145.7 |
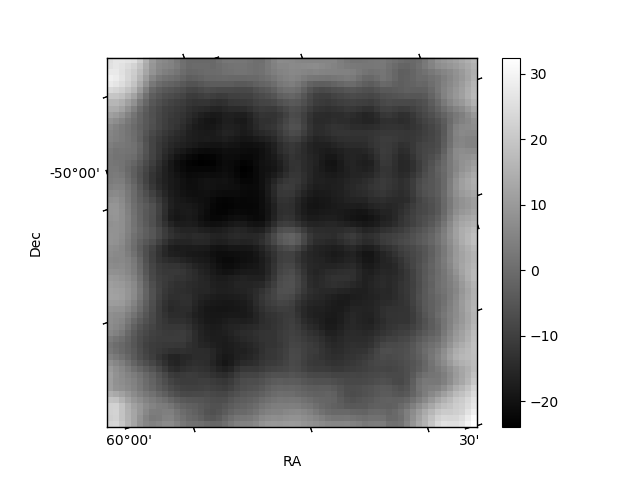
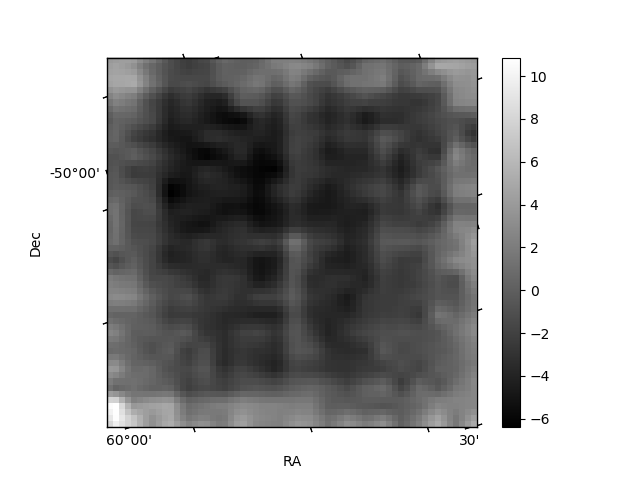
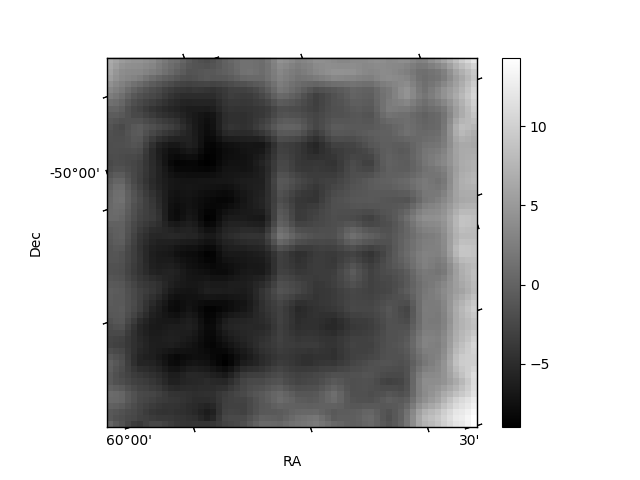
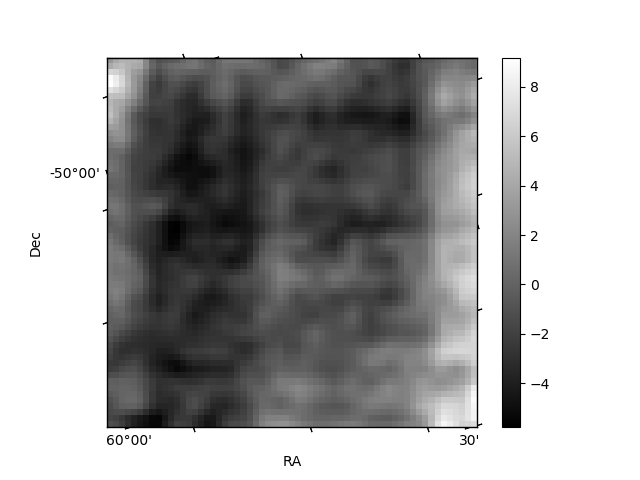
Histogram calculated using DETX and DETY for each event in the final _common_clean file
| Quadrant A | 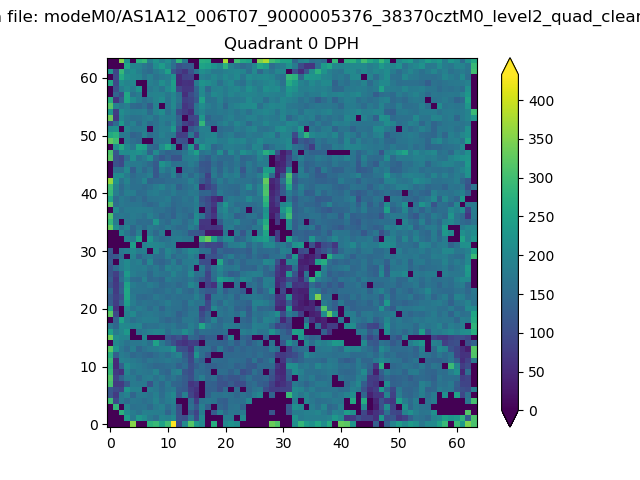 |
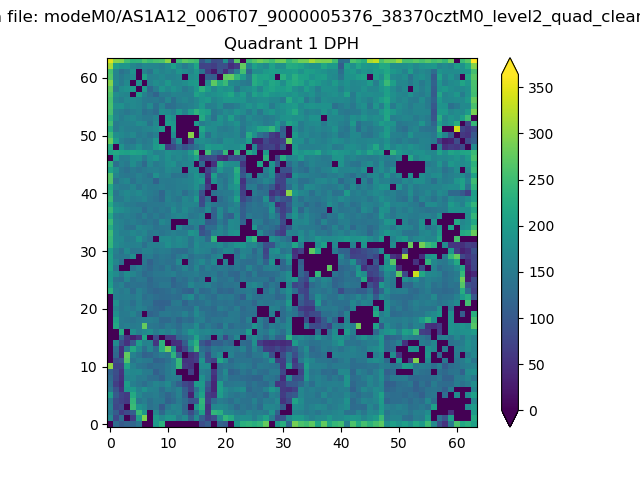 |
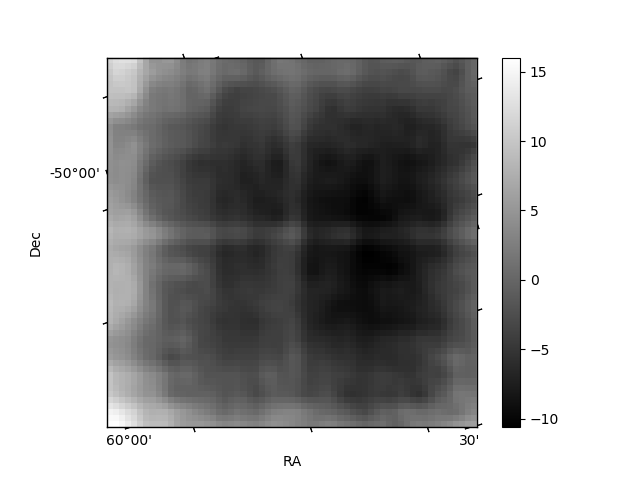
Quadrant B |
|---|---|---|---|
| Quadrant D | 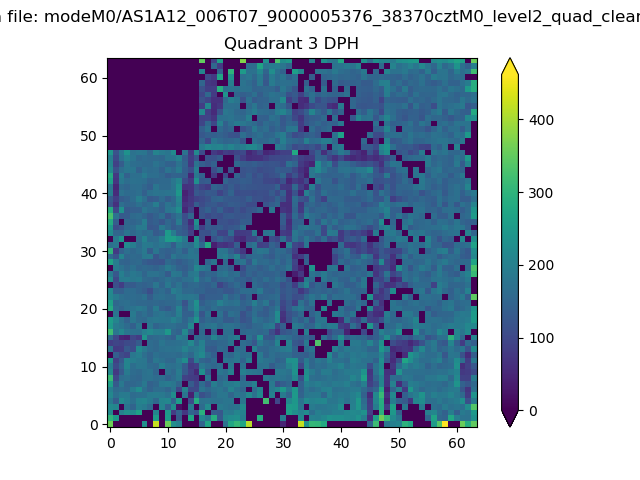 |
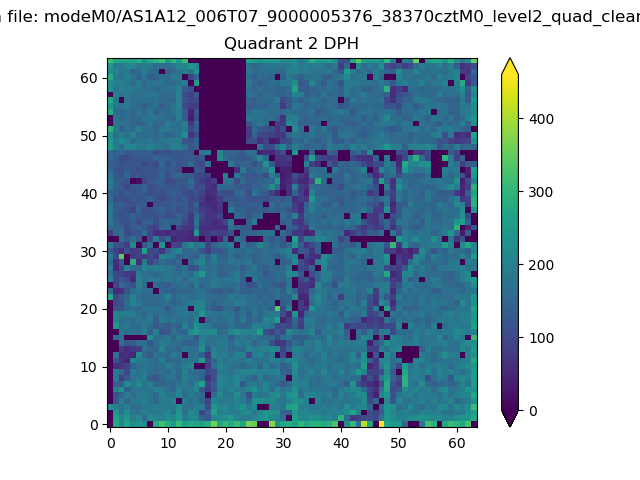 |
Quadrant C |
| Plot type | Count rate plots | Images |
|---|---|---|
| Comparison with Poisson distribution Blue bars denote a histogram of data divided into 1 sec bins. Red curve is a Poisson curve with rate = median count rate of data. |
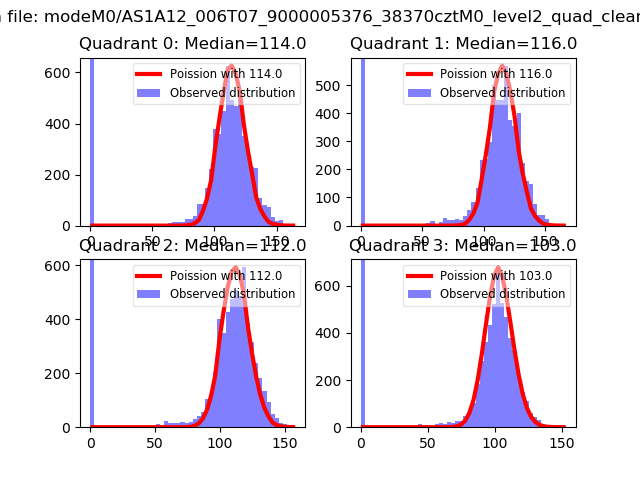 |
 |
| Quadrant-wise count rates Data is divided into 100 sec bins |
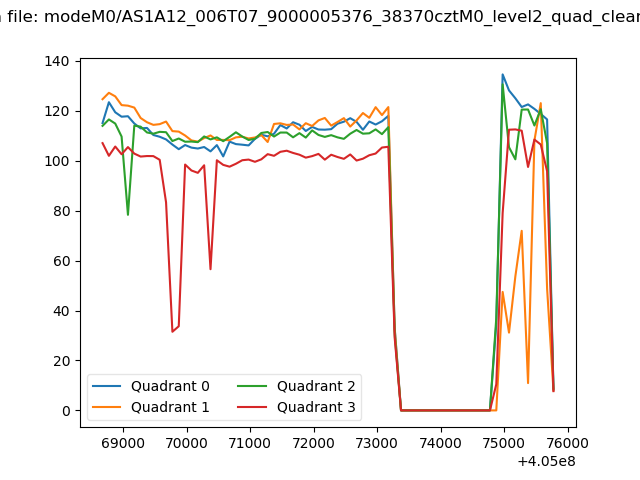 |
|
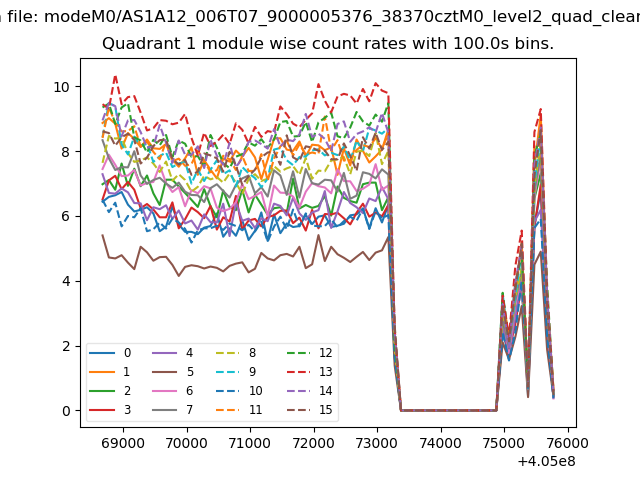
| Module-wise count rates for Quadrant A Data is divided into 100 sec bins |
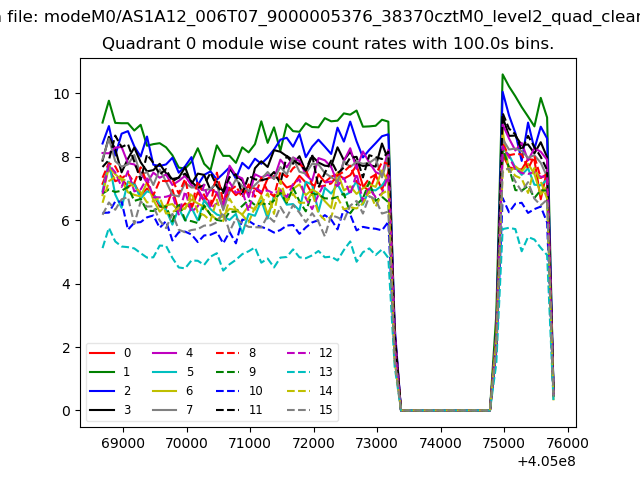 |
 |
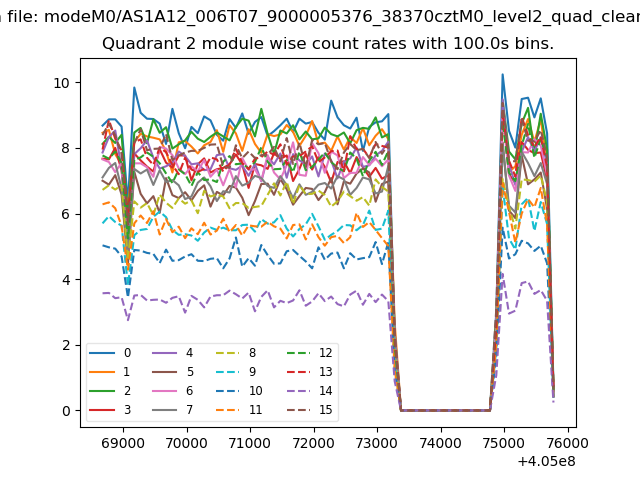
| Module-wise count rates for Quadrant B Data is divided into 100 sec bins |
 |
 |
| Module-wise count rates for Quadrant C Data is divided into 100 sec bins |
 |
 |
| Module-wise count rates for Quadrant D Data is divided into 100 sec bins |
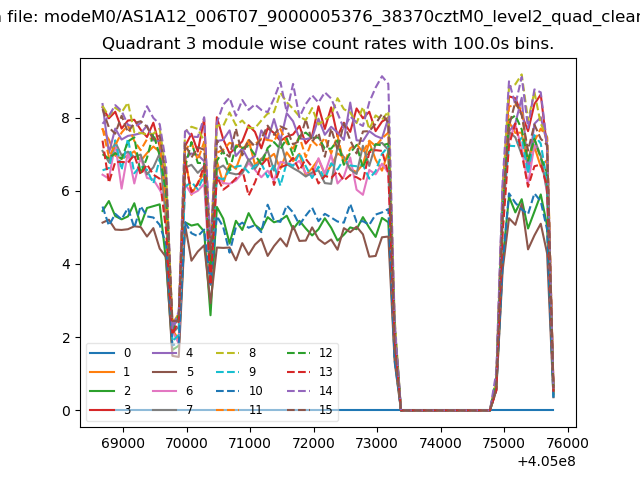 |
 |
| Parameter | Plot |
|---|---|
| CZT HV Monitor | 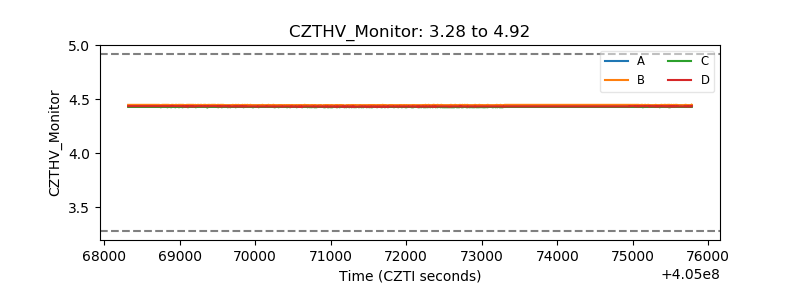 |
| D_VDD | 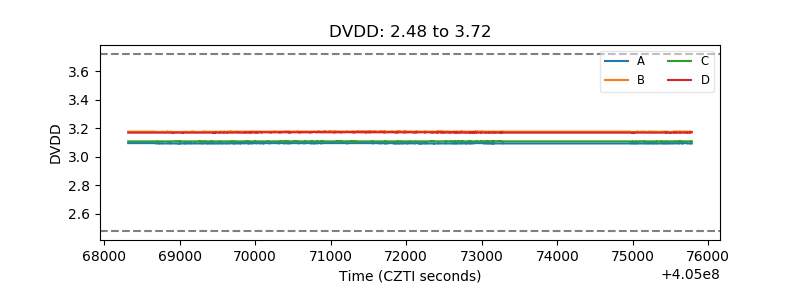 |
| Temperature 1 | 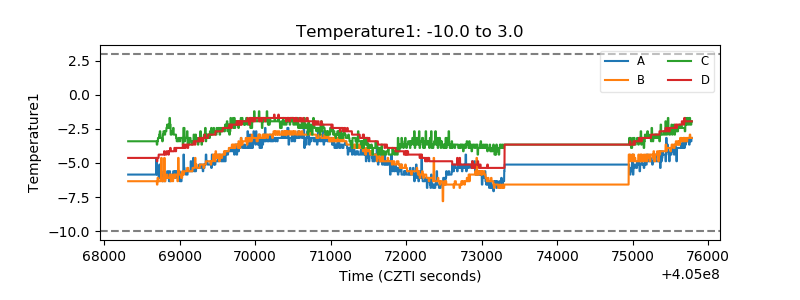 |
| Veto HV Monitor | 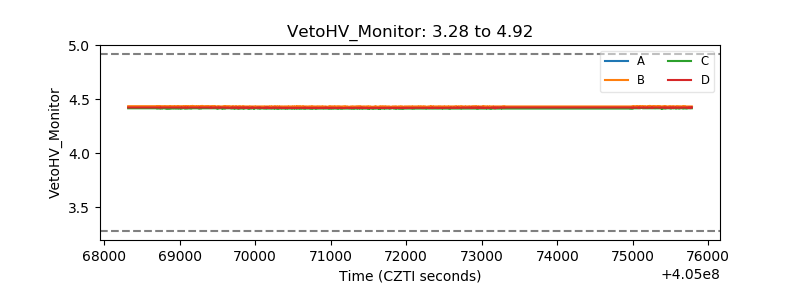 |
| Veto LLD | 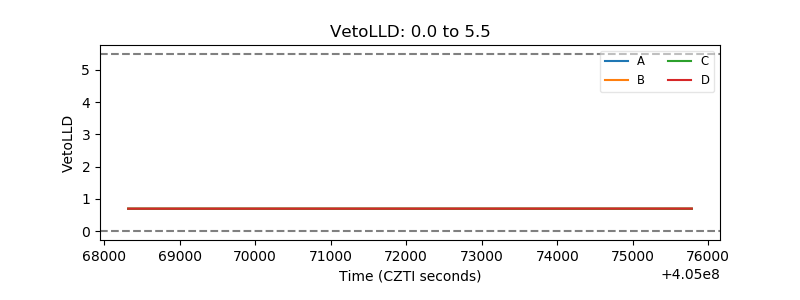 |
| Alpha Counter | 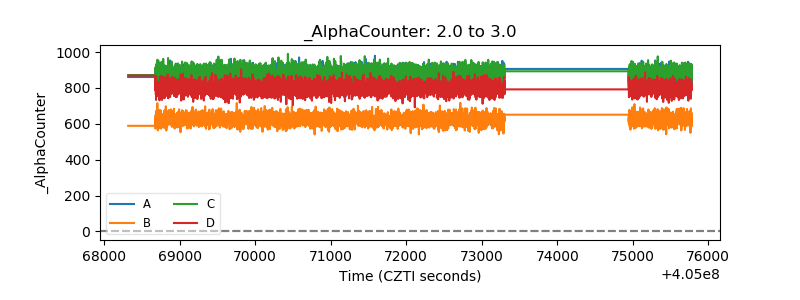 |
| _CPM_Rate | 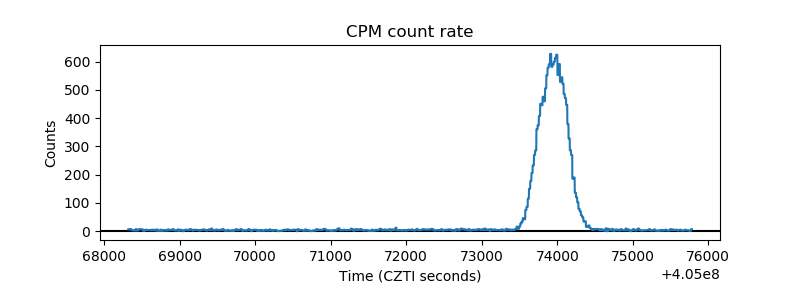 |
| CZT Counter | 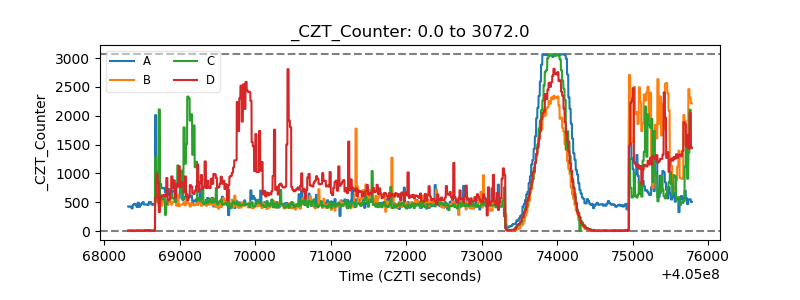 |
| +2.5 Volts monitor | 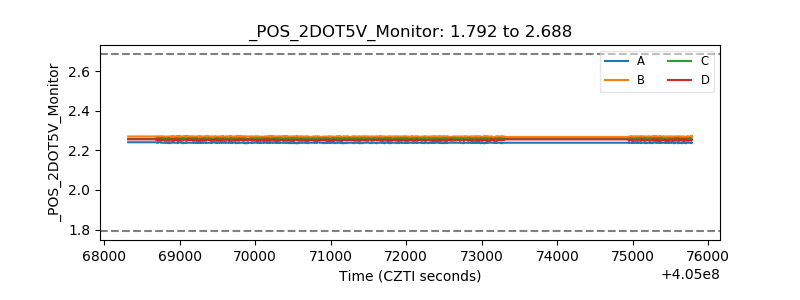 |
| +5 Volts monitor | 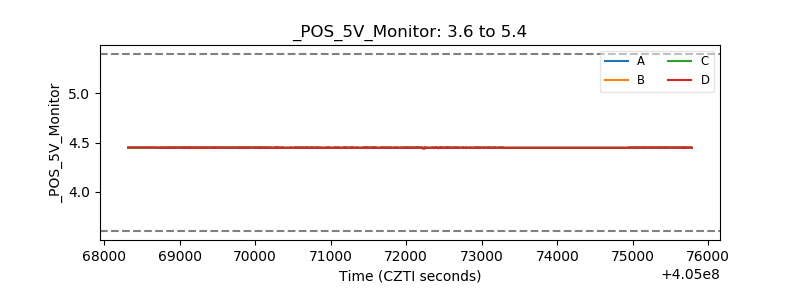 |
| _ROLL_ROT | 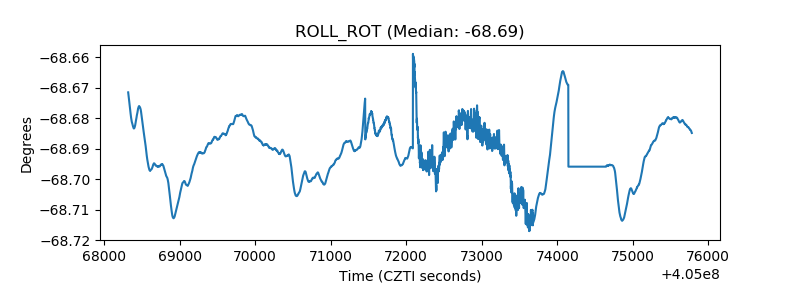 |
| _Roll_DEC | 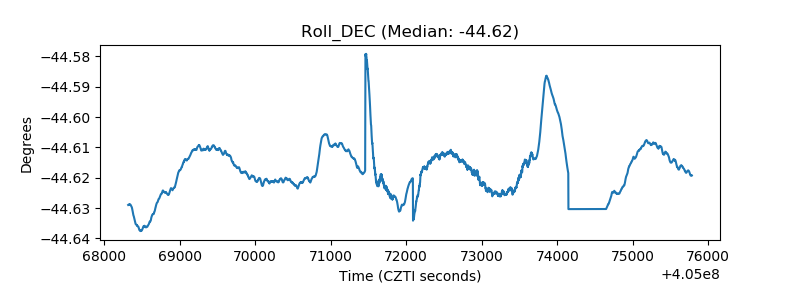 |
| _Roll_RA | 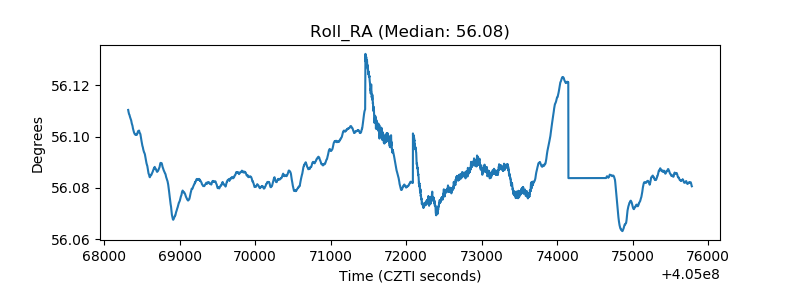 |
| Veto Counter | 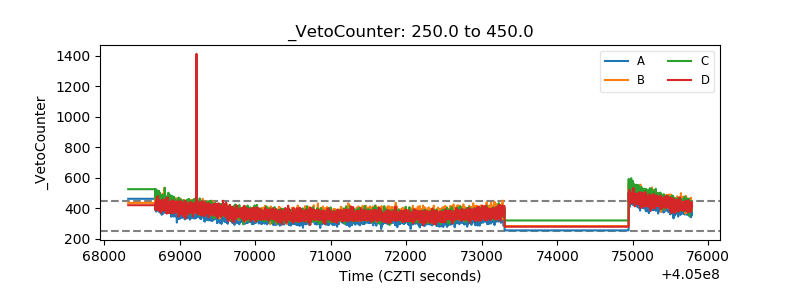 |