| Param | Original file | Final file |
|---|---|---|
| Filename | modeM0/AS1A12_006T07_9000005376_38372cztM0_level2.fits | modeM0/AS1A12_006T07_9000005376_38372cztM0_level2_quad_clean.evt |
| Size (bytes) | 483,526,080 | 67,340,160 |
| Size | 461.1 MB | 64.2 MB |
| Events in quadrant A | 3,096,887 | 482,686 |
| Events in quadrant B | 4,046,848 | 400,932 |
| Events in quadrant C | 3,074,385 | 466,521 |
| Events in quadrant D | 7,359,127 | 396,522 |
| Mode M0 | |||
|---|---|---|---|
| Quadrant | BADHDUFLAG | Total packets | Discarded packets |
| A | 0 | 11861 | 1 |
| B | 0 | 14646 | 1 |
| C | 0 | 11922 | 1 |
| D | 0 | 24622 | 1 |
| Mode M9 | |||
|---|---|---|---|
| Quadrant | BADHDUFLAG | Total packets | Discarded packets |
| A | 0 | 2 | 0 |
| B | 0 | 2 | 0 |
| C | 0 | 2 | 0 |
| D | 0 | 3 | 0 |
| Mode SS | |||
|---|---|---|---|
| Quadrant | BADHDUFLAG | Total packets | Discarded packets |
| A | 0 | 82 | 0 |
| B | 0 | 82 | 0 |
| C | 0 | 82 | 0 |
| D | 0 | 82 | 0 |
| Quadrant | Total seconds | Saturated seconds | Saturation percentage |
|---|---|---|---|
| A | 4151 | 36 | 0.867261% |
| B | 4151 | 837 | 20.163816% |
| C | 4151 | 165 | 3.974946% |
| D | 4151 | 714 | 17.200675% |
Noise dominated data is calculated using 1-second bins in cleaned event files. If a bin has >2000 counts, and if more than 50% of those come from <1% of pixels, then it is considered to be noise-dominated and hence unusable.
| Quadrant | # 1 sec bins | Bins with >0 counts | Bins with >2000 counts | High rate bins dominated by noise | Noise dominated (total time) | Noise dominated (detector-on time) | Marked lightcurve |
|---|---|---|---|---|---|---|---|
| A | 4151 | 4151 | 18 | 18 | 0.43% | 0.43% | 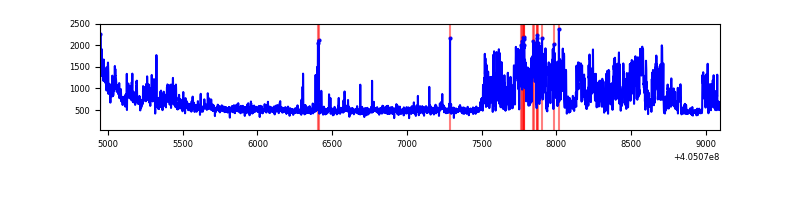 |
| B | 4151 | 4151 | 626 | 626 | 15.08% | 15.08% | 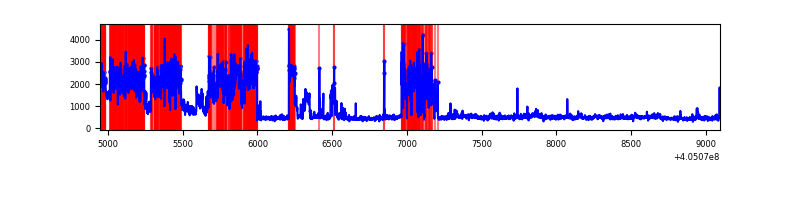 |
| C | 4151 | 4151 | 116 | 116 | 2.79% | 2.79% | 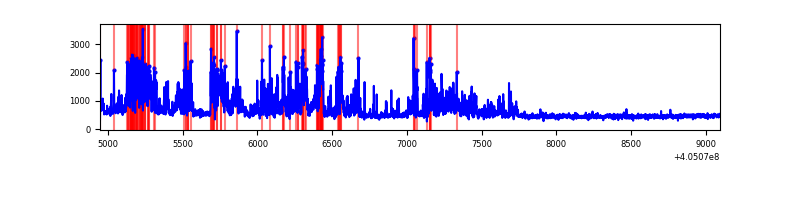 |
| D | 4151 | 4151 | 1356 | 1356 | 32.67% | 32.67% | 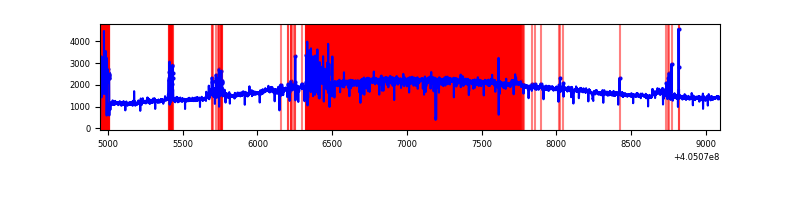 |
Top three noisy pixels from each quadrant. If the there are fewer than three noisy pixels in the level2.evt file, extra rows are filled as -1
| Pixel properties | Quadrant properties | ||||||
|---|---|---|---|---|---|---|---|
| Quadrant | DetID | PixID | Counts | Sigma | Mean | Median | Sigma |
| A | 12 | 16 | 816713 | 8573.81 | 467 | 455 | 95.2 |
| A | 10 | 83 | 257323 | 2698.09 | 467 | 455 | 95.2 |
| A | 12 | 194 | 113263 | 1184.91 | 467 | 455 | 95.2 |
| B | 5 | 184 | 2034596 | 24437.96 | 430 | 418 | 83.2 |
| B | 0 | 183 | 212706 | 2550.36 | 430 | 418 | 83.2 |
| B | 4 | 21 | 51292 | 611.18 | 430 | 418 | 83.2 |
| C | 14 | 254 | 1118953 | 10575.3 | 453 | 456 | 105.8 |
| C | 15 | 214 | 172214 | 1623.96 | 453 | 456 | 105.8 |
| C | 0 | 10 | 6834 | 60.3 | 453 | 456 | 105.8 |
| D | 10 | 203 | 5229232 | 48061.68 | 437 | 425 | 108.8 |
| D | 12 | 227 | 160101 | 1467.7 | 437 | 425 | 108.8 |
| D | 10 | 253 | 93191 | 852.68 | 437 | 425 | 108.8 |
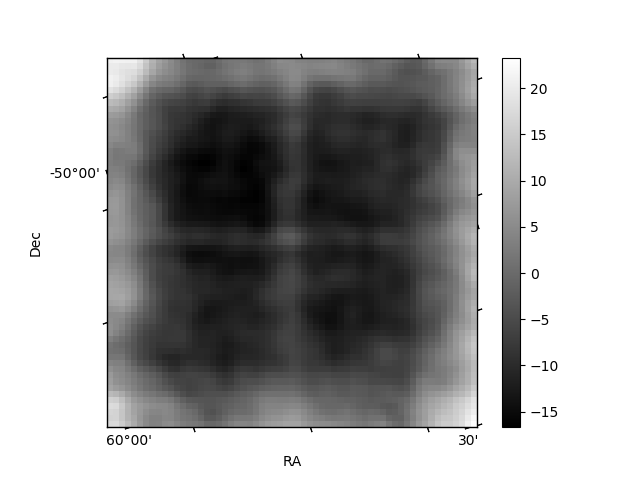
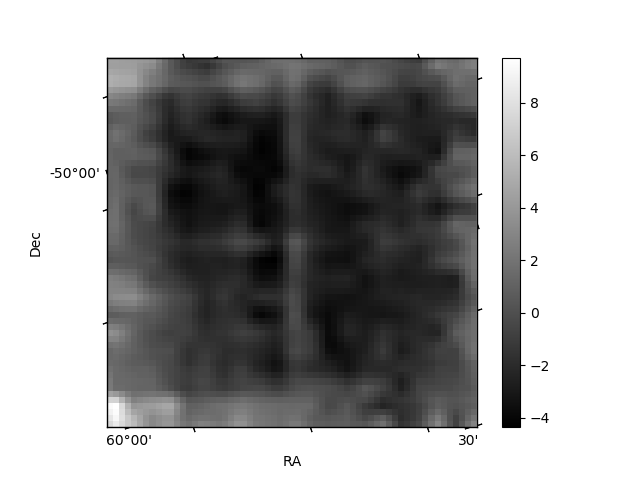
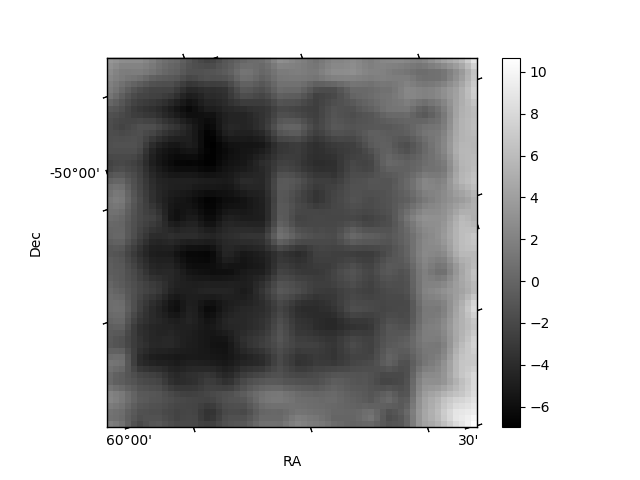
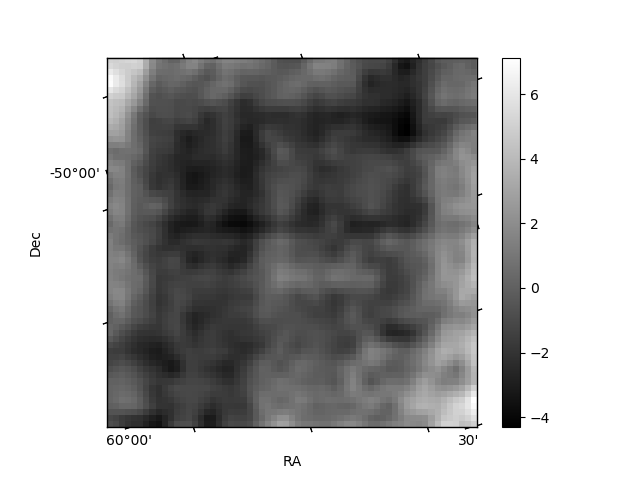
Histogram calculated using DETX and DETY for each event in the final _common_clean file
| Quadrant A | 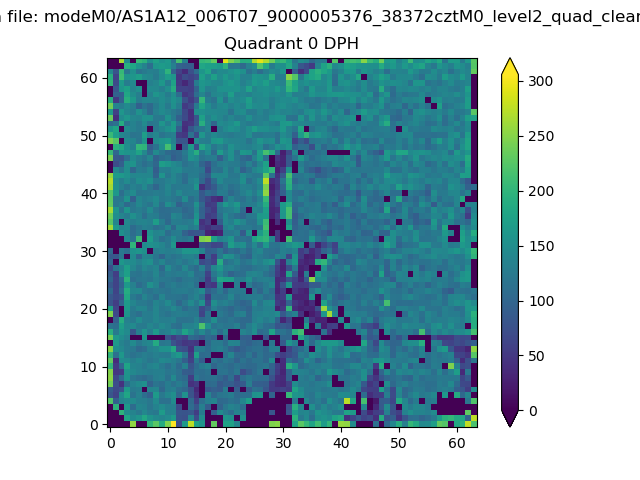 |
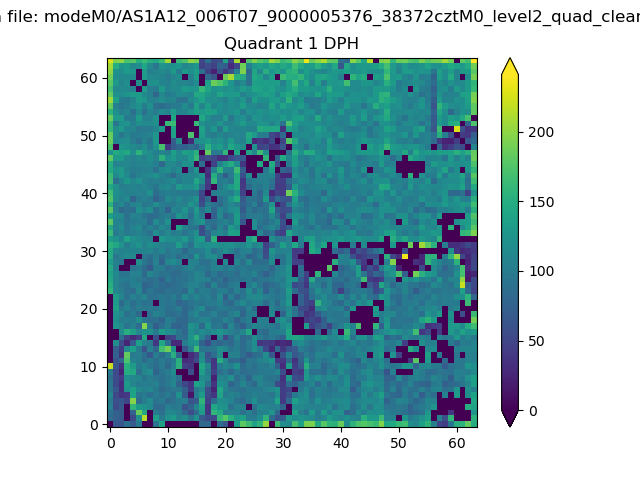 |
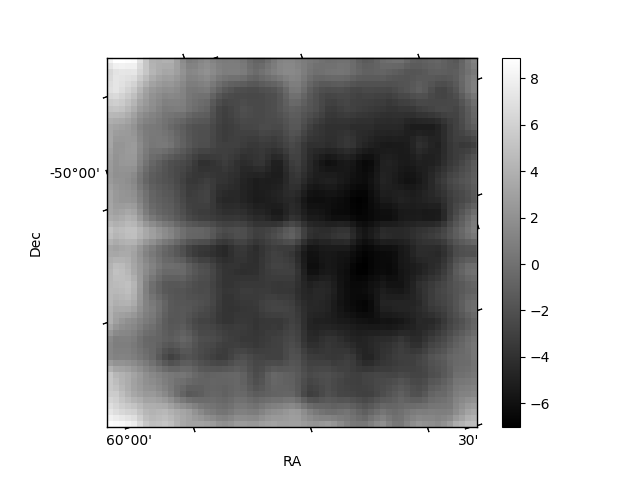
Quadrant B |
|---|---|---|---|
| Quadrant D | 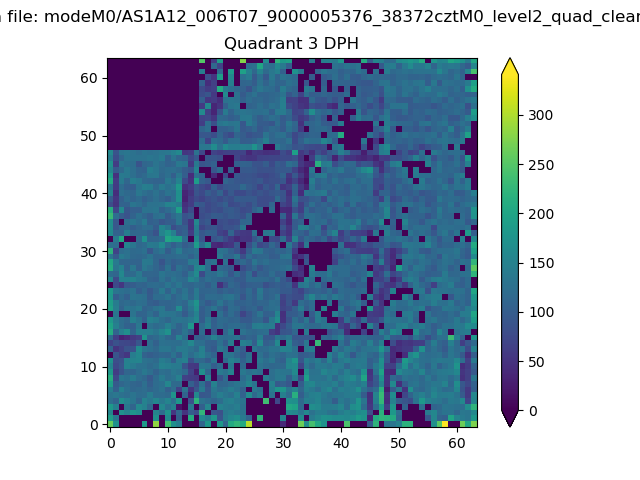 |
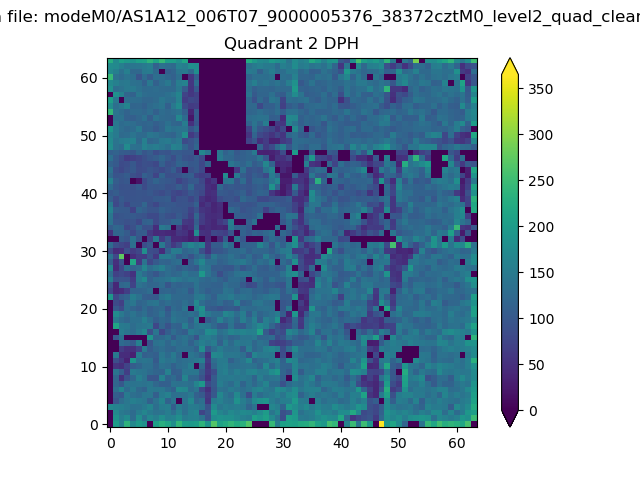 |
Quadrant C |
| Plot type | Count rate plots | Images |
|---|---|---|
| Comparison with Poisson distribution Blue bars denote a histogram of data divided into 1 sec bins. Red curve is a Poisson curve with rate = median count rate of data. |
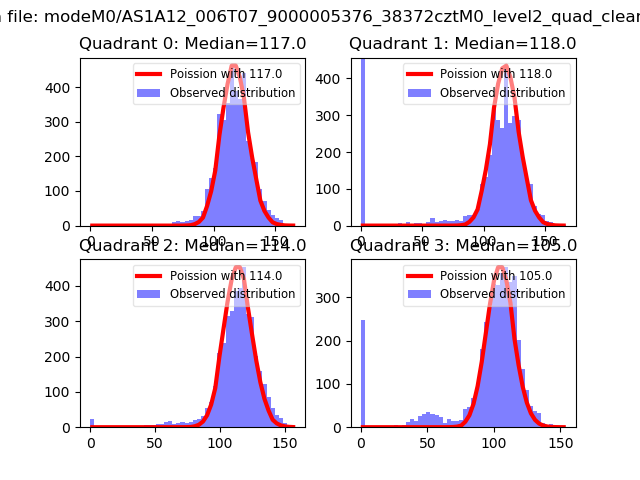 |
 |
| Quadrant-wise count rates Data is divided into 100 sec bins |
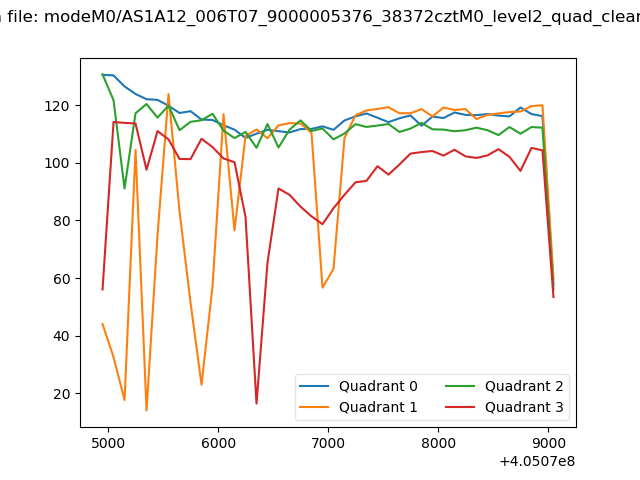 |
|
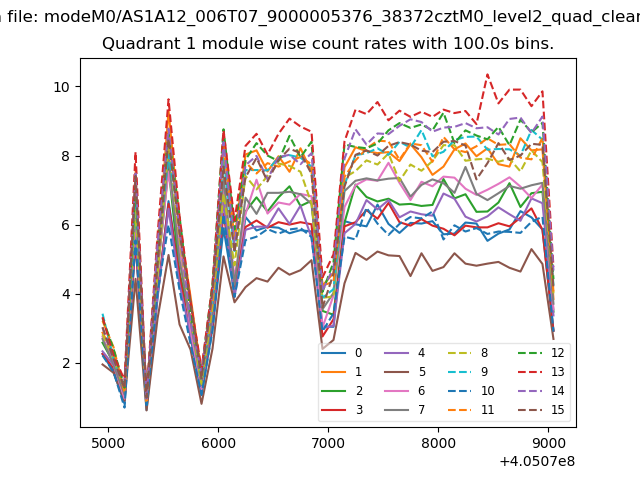
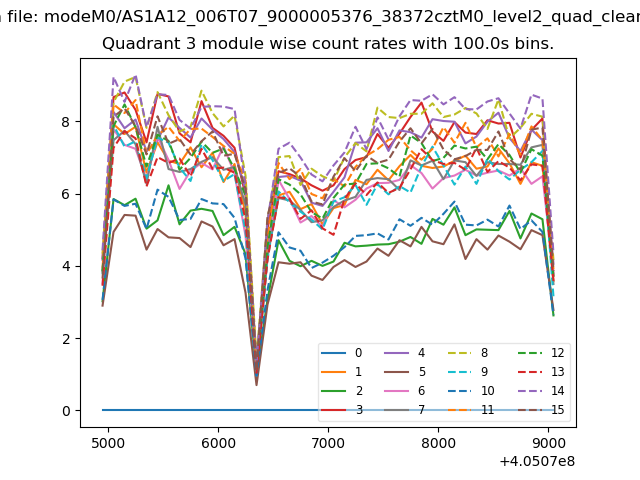
| Module-wise count rates for Quadrant A Data is divided into 100 sec bins |
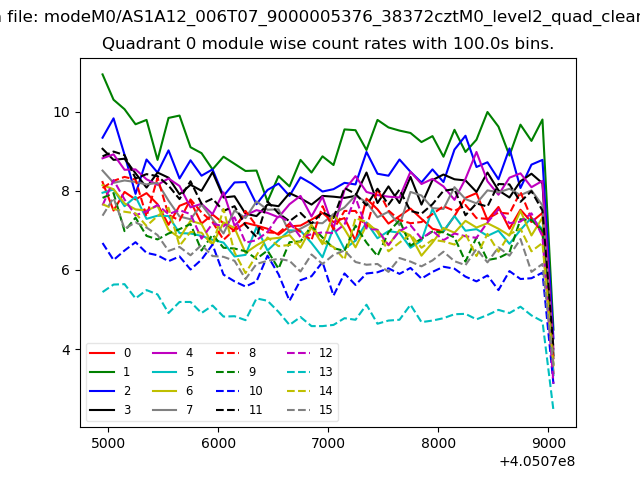 |
 |
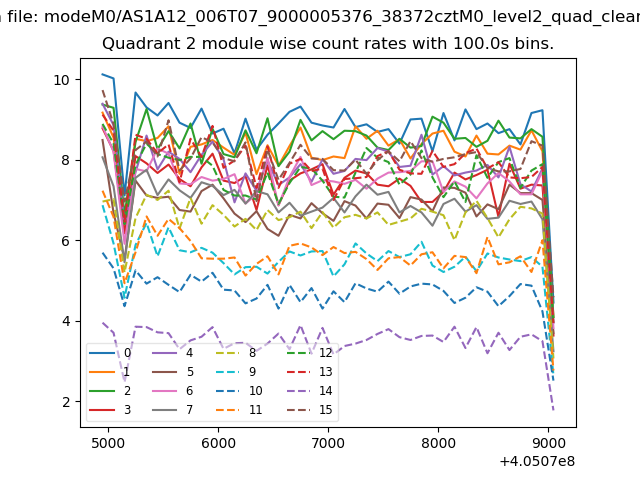
| Module-wise count rates for Quadrant B Data is divided into 100 sec bins |
 |
 |
| Module-wise count rates for Quadrant C Data is divided into 100 sec bins |
 |
 |
| Module-wise count rates for Quadrant D Data is divided into 100 sec bins |
 |
 |
| Parameter | Plot |
|---|---|
| CZT HV Monitor | 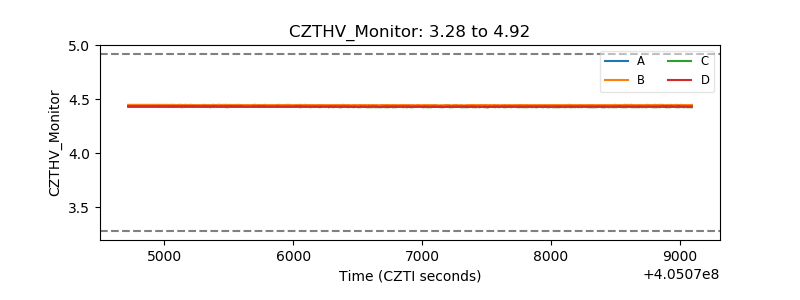 |
| D_VDD | 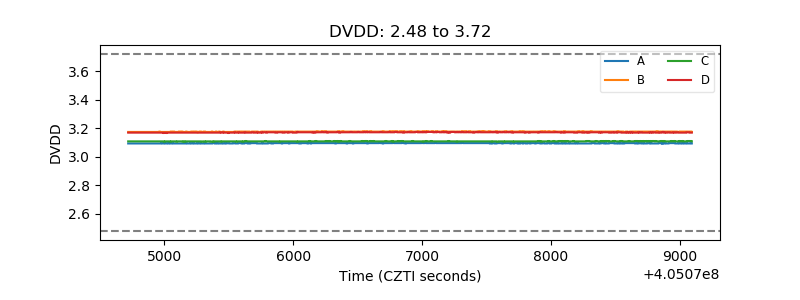 |
| Temperature 1 | 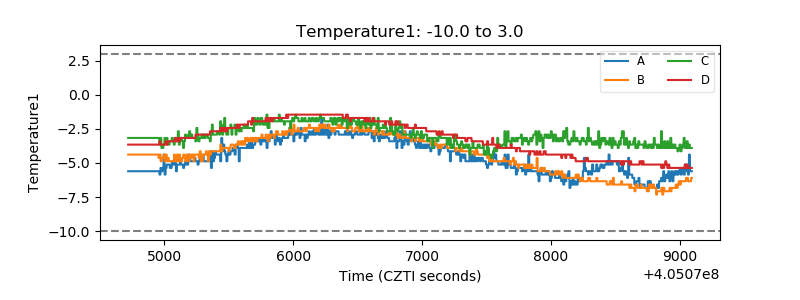 |
| Veto HV Monitor | 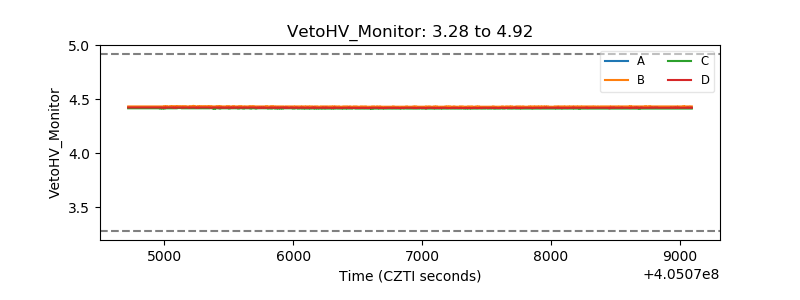 |
| Veto LLD | 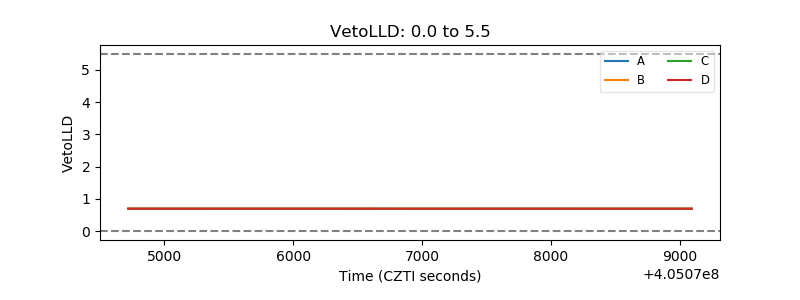 |
| Alpha Counter | 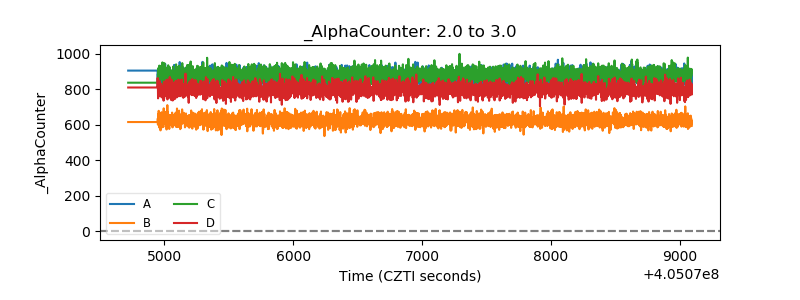 |
| _CPM_Rate | 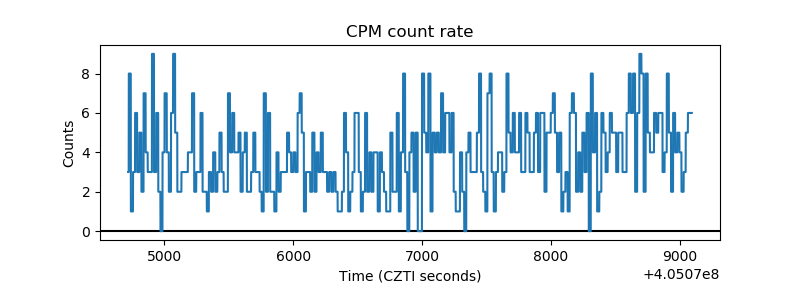 |
| CZT Counter | 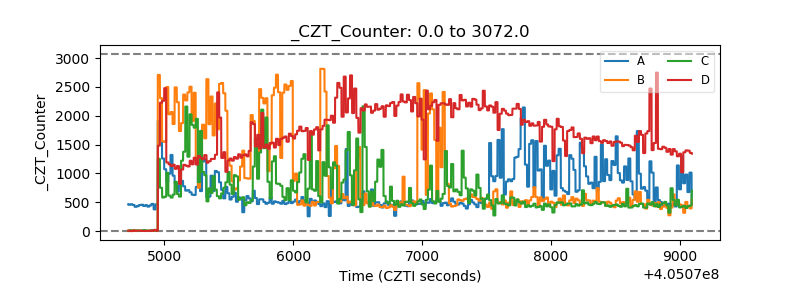 |
| +2.5 Volts monitor | 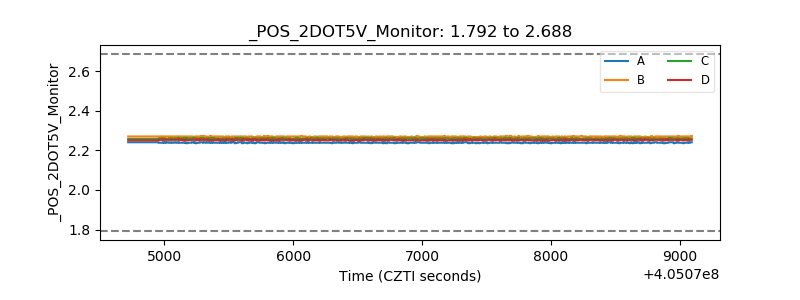 |
| +5 Volts monitor |  |
| _ROLL_ROT | 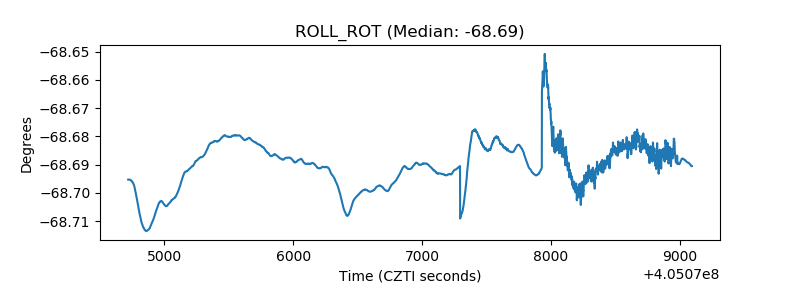 |
| _Roll_DEC | 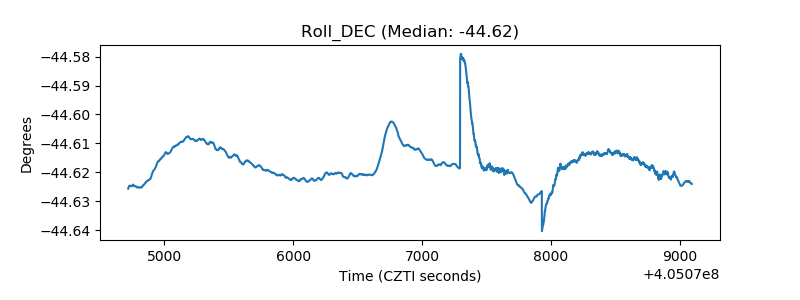 |
| _Roll_RA | 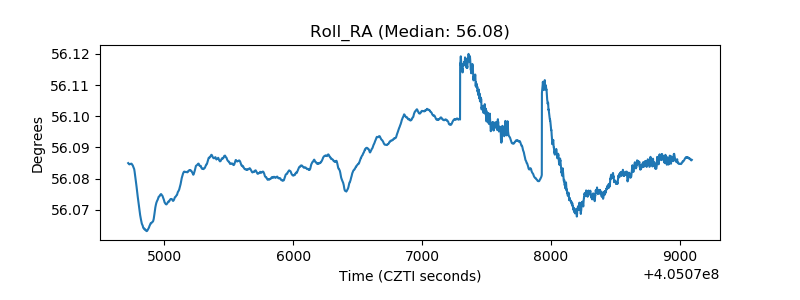 |
| Veto Counter | 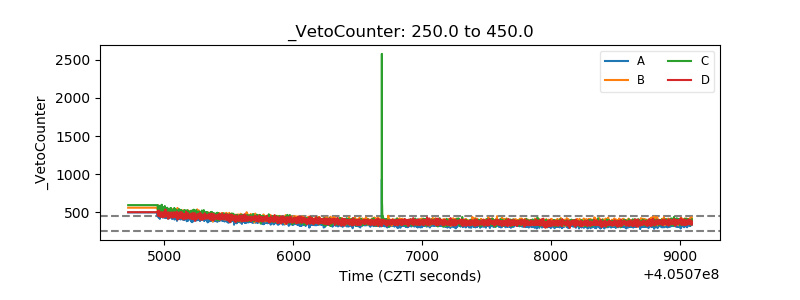 |