| Param | Original file | Final file |
|---|---|---|
| Filename | modeM0/AS1A12_006T08_9000005378_38372cztM0_level2.fits | modeM0/AS1A12_006T08_9000005378_38372cztM0_level2_quad_clean.evt |
| Size (bytes) | 98,199,360 | 17,291,520 |
| Size | 93.7 MB | 16.5 MB |
| Events in quadrant A | 611,041 | 122,892 |
| Events in quadrant B | 681,161 | 119,701 |
| Events in quadrant C | 519,097 | 122,116 |
| Events in quadrant D | 1,750,037 | 87,799 |
| Mode M0 | |||
|---|---|---|---|
| Quadrant | BADHDUFLAG | Total packets | Discarded packets |
| A | 0 | 2510 | 2 |
| B | 0 | 2550 | 1 |
| C | 0 | 2092 | 1 |
| D | 0 | 5838 | 1 |
| Mode M9 | |||
|---|---|---|---|
| Quadrant | BADHDUFLAG | Total packets | Discarded packets |
| A | 0 | 16 | 0 |
| B | 0 | 16 | 0 |
| C | 0 | 16 | 0 |
| D | 0 | 16 | 0 |
| Mode SS | |||
|---|---|---|---|
| Quadrant | BADHDUFLAG | Total packets | Discarded packets |
| A | 0 | 20 | 0 |
| B | 0 | 20 | 0 |
| C | 0 | 20 | 0 |
| D | 0 | 20 | 0 |
| Quadrant | Total seconds | Saturated seconds | Saturation percentage |
|---|---|---|---|
| A | 911 | 6 | 0.658617% |
| B | 911 | 83 | 9.110867% |
| C | 911 | 5 | 0.548847% |
| D | 911 | 350 | 38.419319% |
Noise dominated data is calculated using 1-second bins in cleaned event files. If a bin has >2000 counts, and if more than 50% of those come from <1% of pixels, then it is considered to be noise-dominated and hence unusable.
| Quadrant | # 1 sec bins | Bins with >0 counts | Bins with >2000 counts | High rate bins dominated by noise | Noise dominated (total time) | Noise dominated (detector-on time) | Marked lightcurve |
|---|---|---|---|---|---|---|---|
| A | 911 | 911 | 3 | 3 | 0.33% | 0.33% | 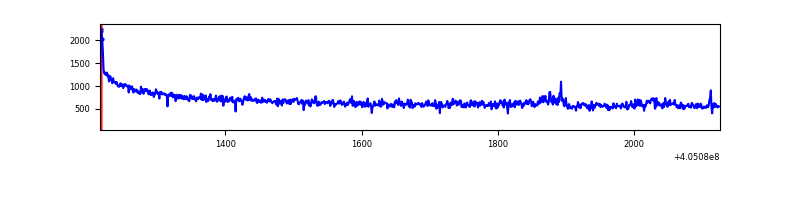 |
| B | 911 | 911 | 45 | 45 | 4.94% | 4.94% |  |
| C | 911 | 911 | 1 | 1 | 0.11% | 0.11% | 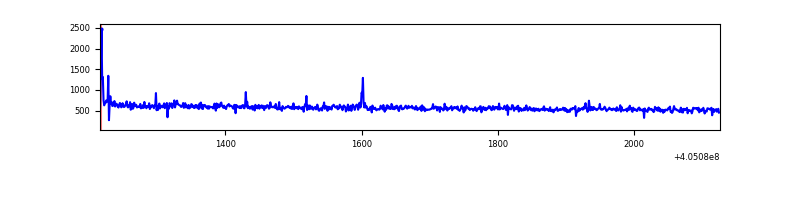 |
| D | 911 | 911 | 312 | 312 | 34.25% | 34.25% | 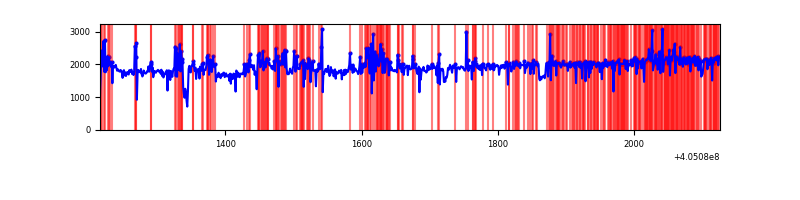 |
Top three noisy pixels from each quadrant. If the there are fewer than three noisy pixels in the level2.evt file, extra rows are filled as -1
| Pixel properties | Quadrant properties | ||||||
|---|---|---|---|---|---|---|---|
| Quadrant | DetID | PixID | Counts | Sigma | Mean | Median | Sigma |
| A | 10 | 83 | 118187 | 4555.92 | 120 | 118 | 25.9 |
| A | 12 | 189 | 11703 | 447.03 | 120 | 118 | 25.9 |
| A | 12 | 16 | 6408 | 242.71 | 120 | 118 | 25.9 |
| B | 0 | 183 | 206080 | 8558.75 | 117 | 114 | 24.1 |
| B | 0 | 230 | 4693 | 190.26 | 117 | 114 | 24.1 |
| B | 0 | 229 | 3362 | 134.95 | 117 | 114 | 24.1 |
| C | 15 | 214 | 43154 | 1475.68 | 118 | 119 | 29.2 |
| C | 0 | 10 | 5895 | 198.06 | 118 | 119 | 29.2 |
| C | 14 | 254 | 3340 | 110.45 | 118 | 119 | 29.2 |
| D | 10 | 203 | 1173816 | 39697.21 | 112 | 108 | 29.6 |
| D | 13 | 171 | 53262 | 1797.78 | 112 | 108 | 29.6 |
| D | 12 | 227 | 47609 | 1606.58 | 112 | 108 | 29.6 |
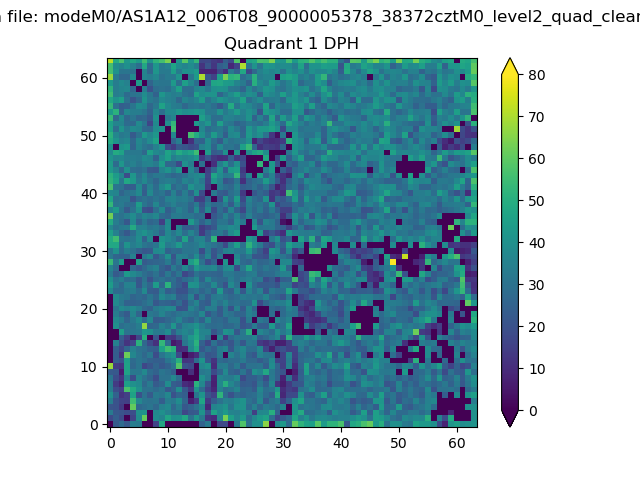
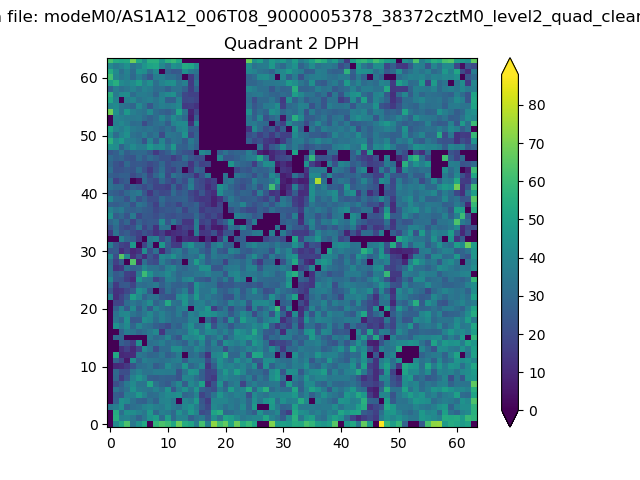
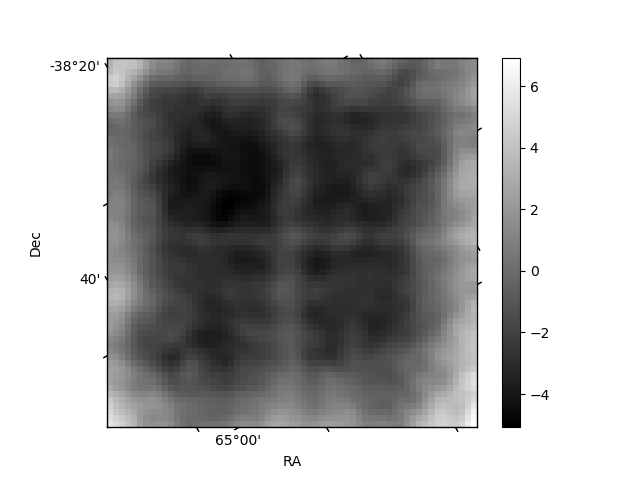
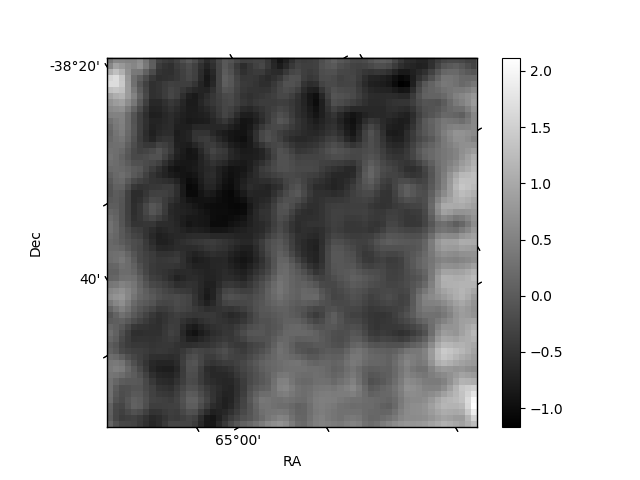
Histogram calculated using DETX and DETY for each event in the final _common_clean file
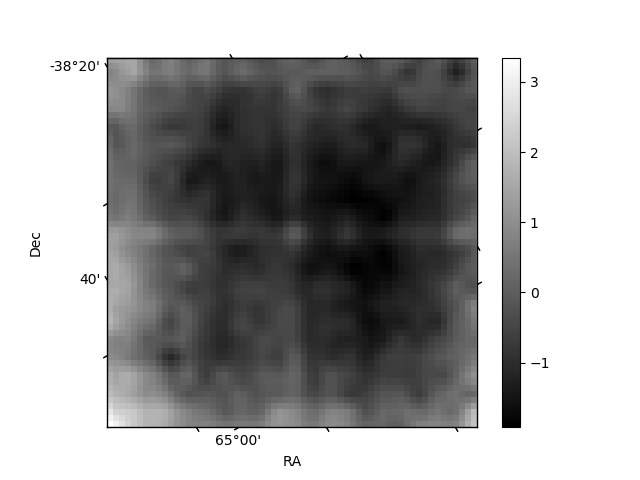
| Quadrant A | 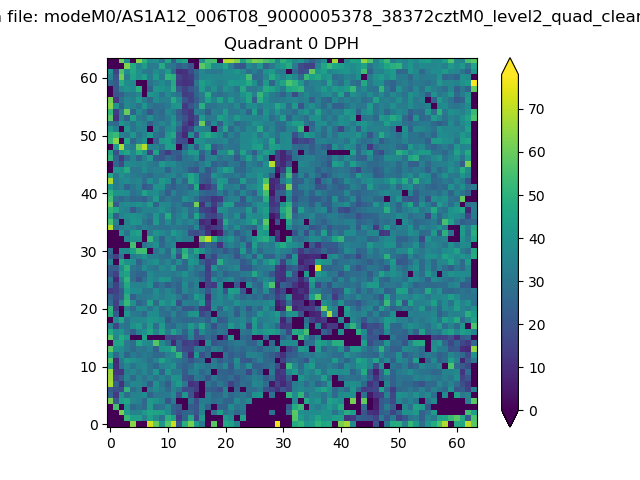 |
 |
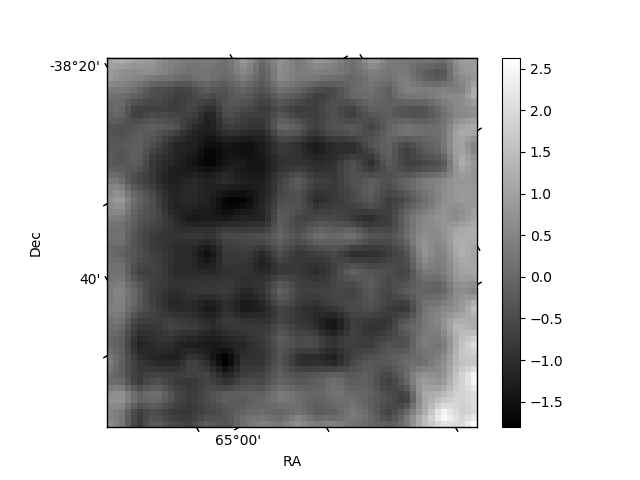
Quadrant B |
|---|---|---|---|
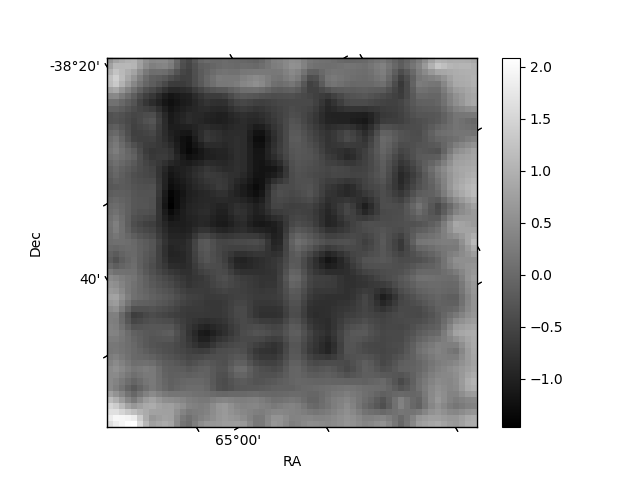
| Quadrant D | 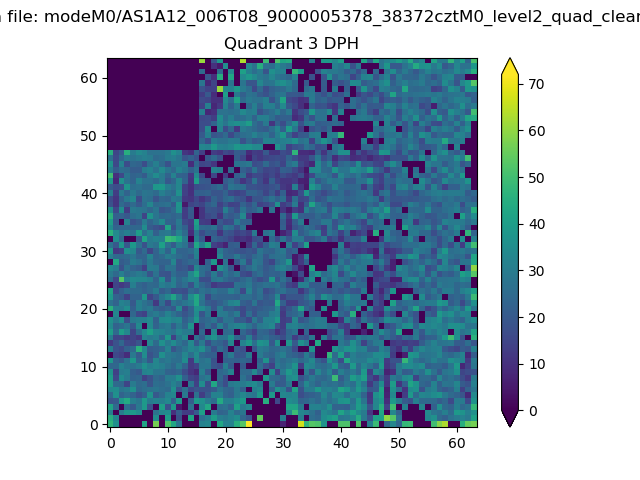 |
 |
Quadrant C |
| Plot type | Count rate plots | Images |
|---|---|---|
| Comparison with Poisson distribution Blue bars denote a histogram of data divided into 1 sec bins. Red curve is a Poisson curve with rate = median count rate of data. |
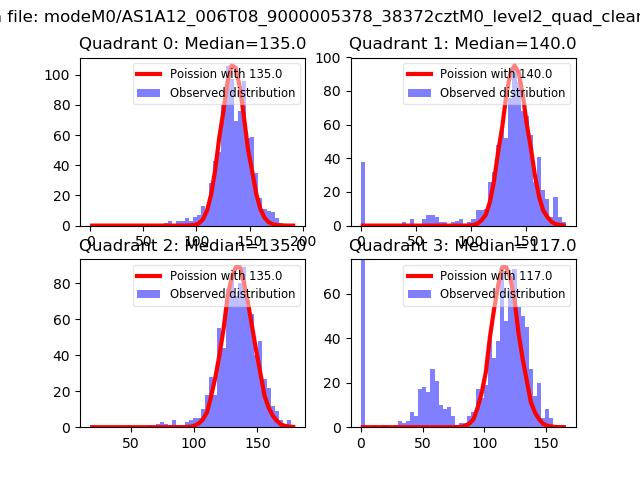 |
 |
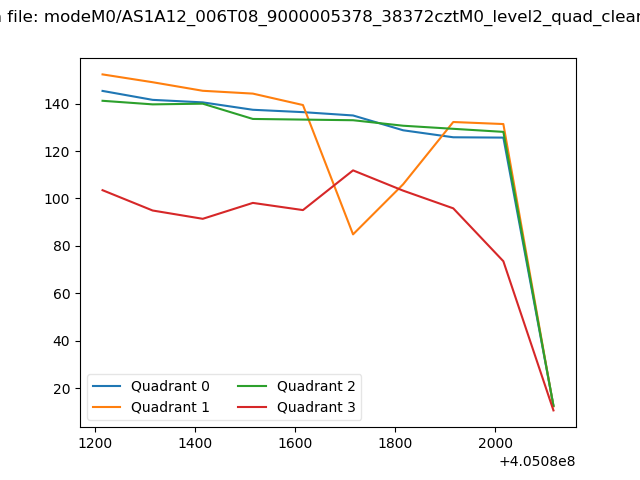
| Quadrant-wise count rates Data is divided into 100 sec bins |
 |
|
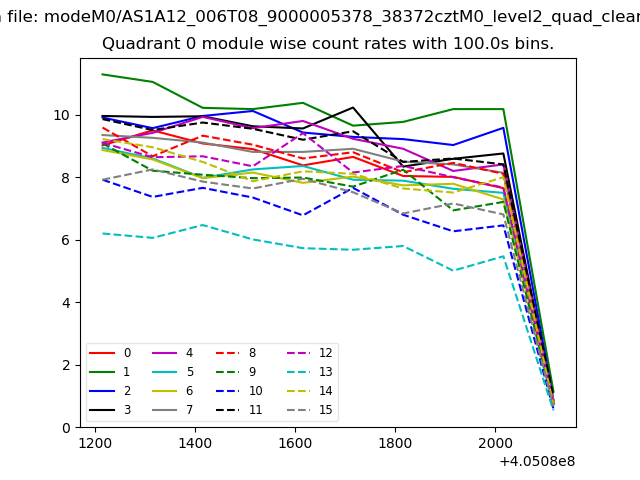
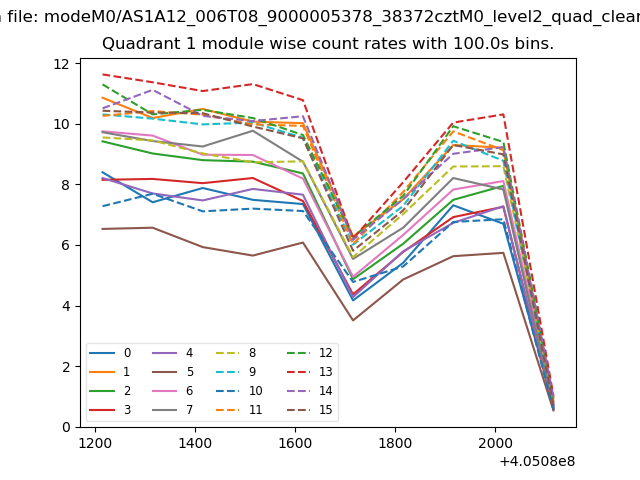
| Module-wise count rates for Quadrant A Data is divided into 100 sec bins |
 |
 |
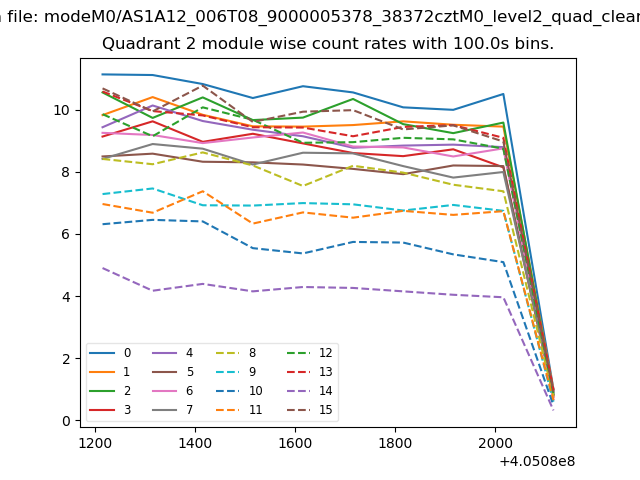
| Module-wise count rates for Quadrant B Data is divided into 100 sec bins |
 |
 |
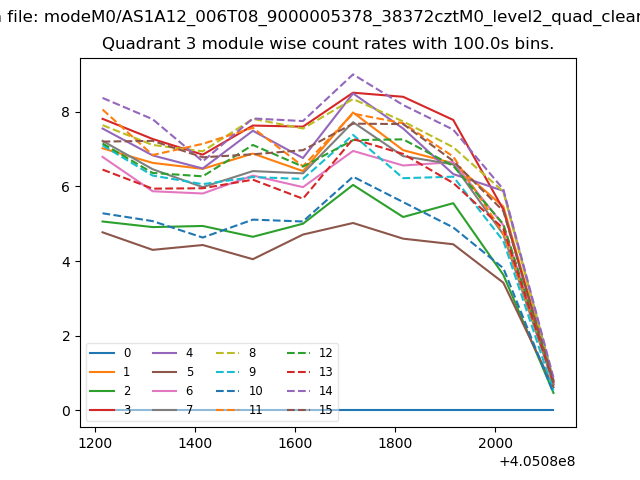
| Module-wise count rates for Quadrant C Data is divided into 100 sec bins |
 |
 |
| Module-wise count rates for Quadrant D Data is divided into 100 sec bins |
 |
 |
| Parameter | Plot |
|---|---|
| CZT HV Monitor |  |
| D_VDD | 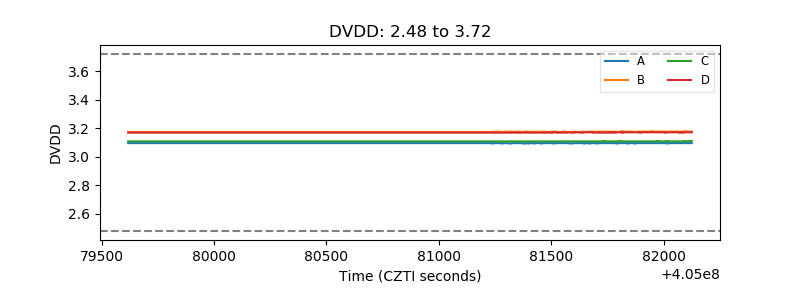 |
| Temperature 1 | 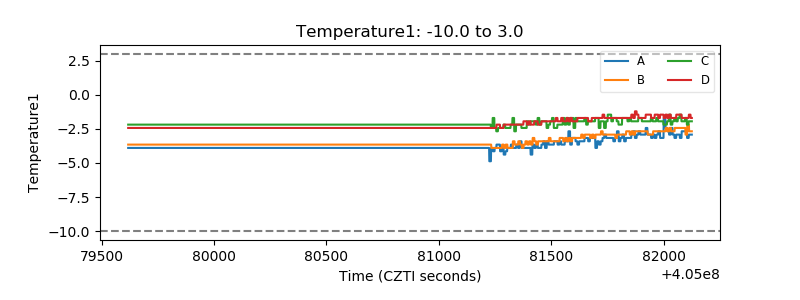 |
| Veto HV Monitor | 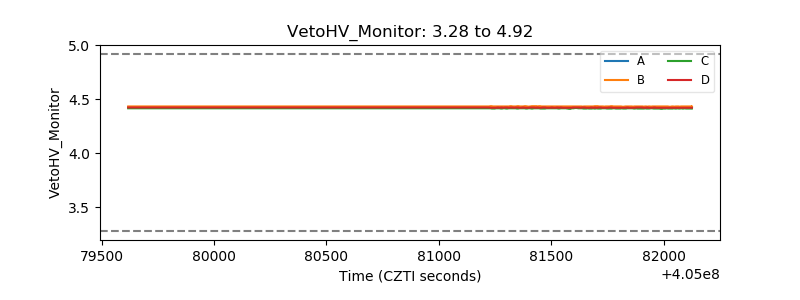 |
| Veto LLD | 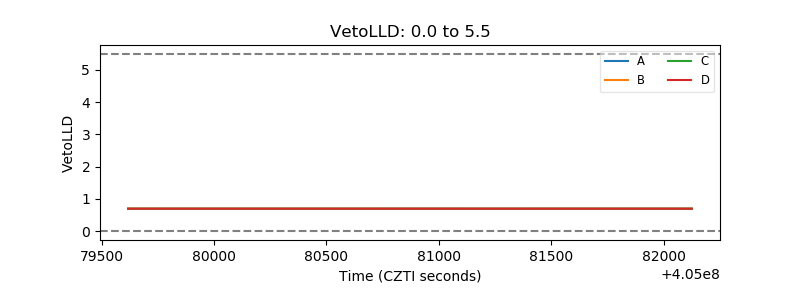 |
| Alpha Counter | 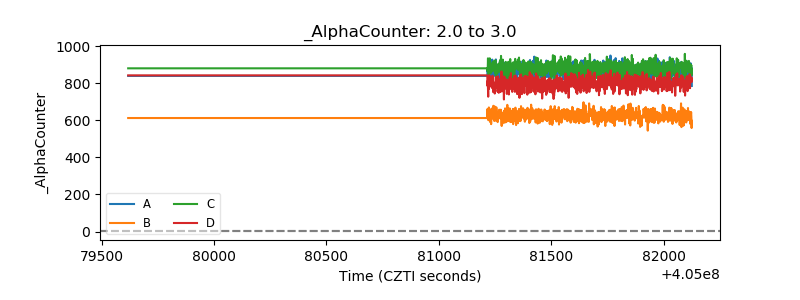 |
| _CPM_Rate | 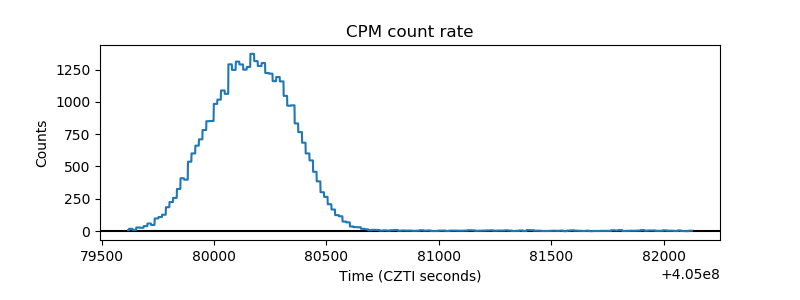 |
| CZT Counter | 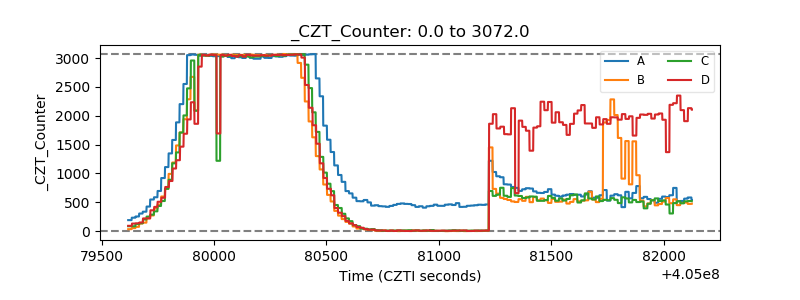 |
| +2.5 Volts monitor | 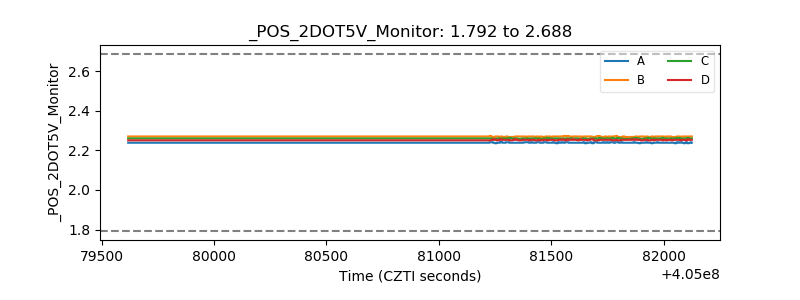 |
| +5 Volts monitor | 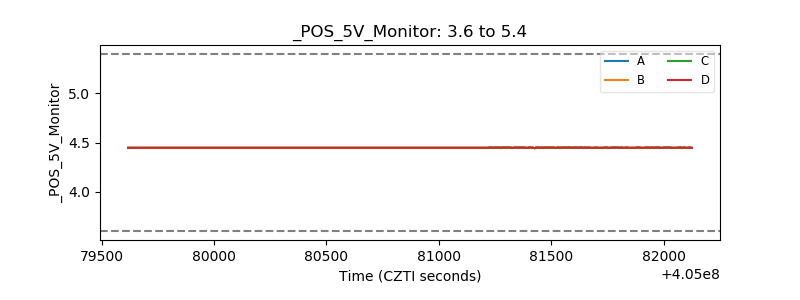 |
| _ROLL_ROT | 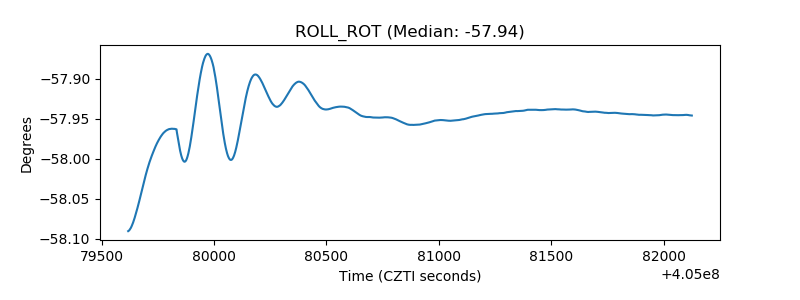 |
| _Roll_DEC | 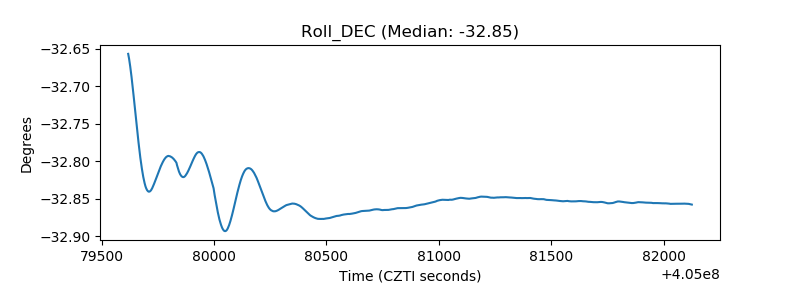 |
| _Roll_RA | 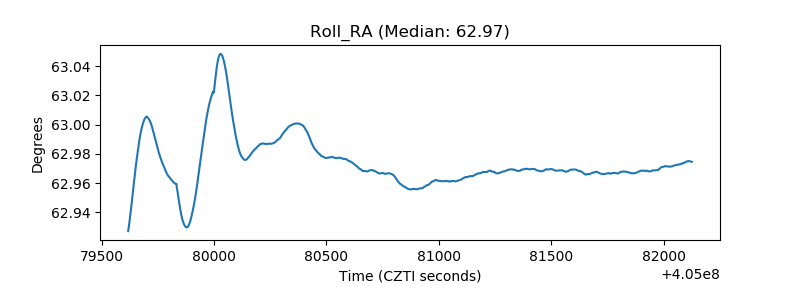 |
| Veto Counter | 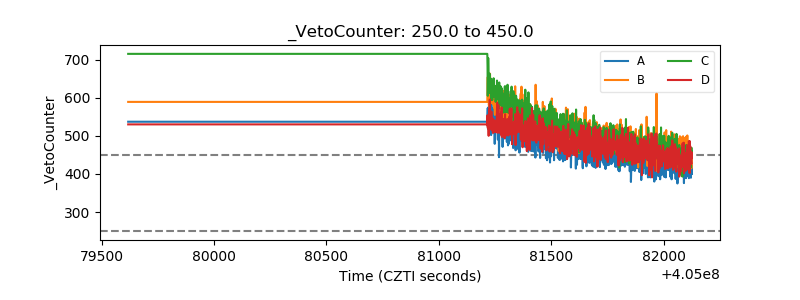 |