| Param | Original file | Final file |
|---|---|---|
| Filename | modeM0/AS1A12_006T08_9000005378_38373cztM0_level2.fits | modeM0/AS1A12_006T08_9000005378_38373cztM0_level2_quad_clean.evt |
| Size (bytes) | 516,896,640 | 92,047,680 |
| Size | 493.0 MB | 87.8 MB |
| Events in quadrant A | 3,207,328 | 668,984 |
| Events in quadrant B | 3,096,231 | 682,137 |
| Events in quadrant C | 2,691,276 | 655,353 |
| Events in quadrant D | 9,733,407 | 414,271 |
| Mode M0 | |||
|---|---|---|---|
| Quadrant | BADHDUFLAG | Total packets | Discarded packets |
| A | 0 | 12919 | 3 |
| B | 0 | 12484 | 2 |
| C | 0 | 11207 | 2 |
| D | 0 | 32473 | 2 |
| Mode M9 | |||
|---|---|---|---|
| Quadrant | BADHDUFLAG | Total packets | Discarded packets |
| A | 0 | 25 | 0 |
| B | 0 | 25 | 0 |
| C | 0 | 25 | 0 |
| D | 0 | 26 | 0 |
| Mode SS | |||
|---|---|---|---|
| Quadrant | BADHDUFLAG | Total packets | Discarded packets |
| A | 0 | 108 | 0 |
| B | 0 | 108 | 0 |
| C | 0 | 108 | 0 |
| D | 0 | 108 | 0 |
| Quadrant | Total seconds | Saturated seconds | Saturation percentage |
|---|---|---|---|
| A | 5229 | 50 | 0.956206% |
| B | 5229 | 114 | 2.180149% |
| C | 5229 | 11 | 0.210365% |
| D | 5229 | 1982 | 37.903997% |
Noise dominated data is calculated using 1-second bins in cleaned event files. If a bin has >2000 counts, and if more than 50% of those come from <1% of pixels, then it is considered to be noise-dominated and hence unusable.
| Quadrant | # 1 sec bins | Bins with >0 counts | Bins with >2000 counts | High rate bins dominated by noise | Noise dominated (total time) | Noise dominated (detector-on time) | Marked lightcurve |
|---|---|---|---|---|---|---|---|
| A | 7111 | 5230 | 29 | 29 | 0.41% | 0.55% | 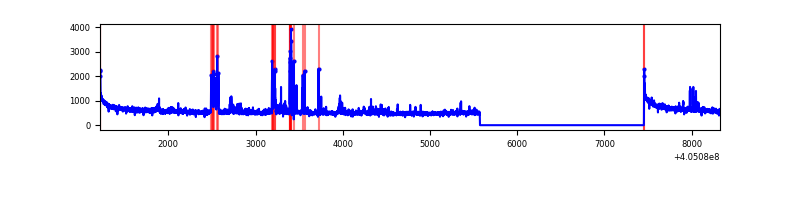 |
| B | 7111 | 5230 | 57 | 57 | 0.80% | 1.09% | 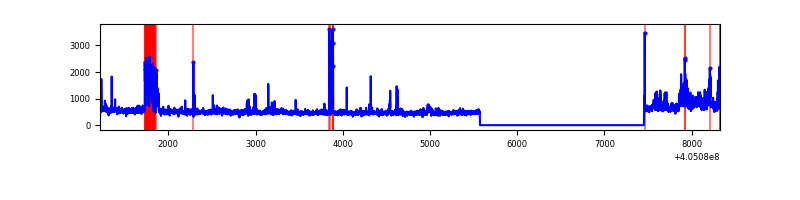 |
| C | 7111 | 5230 | 6 | 6 | 0.08% | 0.11% | 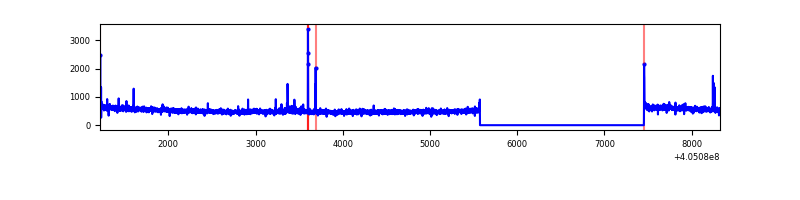 |
| D | 7111 | 5230 | 2304 | 2304 | 32.40% | 44.05% | 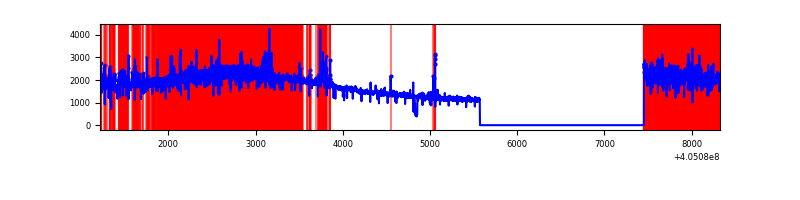 |
Top three noisy pixels from each quadrant. If the there are fewer than three noisy pixels in the level2.evt file, extra rows are filled as -1
| Pixel properties | Quadrant properties | ||||||
|---|---|---|---|---|---|---|---|
| Quadrant | DetID | PixID | Counts | Sigma | Mean | Median | Sigma |
| A | 10 | 83 | 387424 | 3036.32 | 636 | 624 | 127.4 |
| A | 12 | 16 | 149424 | 1168.06 | 636 | 624 | 127.4 |
| A | 9 | 143 | 131239 | 1025.31 | 636 | 624 | 127.4 |
| B | 0 | 183 | 438057 | 3686.37 | 631 | 617 | 118.7 |
| B | 0 | 189 | 79813 | 667.4 | 631 | 617 | 118.7 |
| B | 4 | 21 | 27096 | 223.14 | 631 | 617 | 118.7 |
| C | 15 | 214 | 222510 | 1562.49 | 616 | 621 | 142.0 |
| C | 14 | 254 | 39093 | 270.91 | 616 | 621 | 142.0 |
| C | 0 | 10 | 12848 | 86.1 | 616 | 621 | 142.0 |
| D | 10 | 203 | 6637780 | 46862.5 | 572 | 555 | 141.6 |
| D | 12 | 235 | 272165 | 1917.72 | 572 | 555 | 141.6 |
| D | 12 | 227 | 193340 | 1361.17 | 572 | 555 | 141.6 |
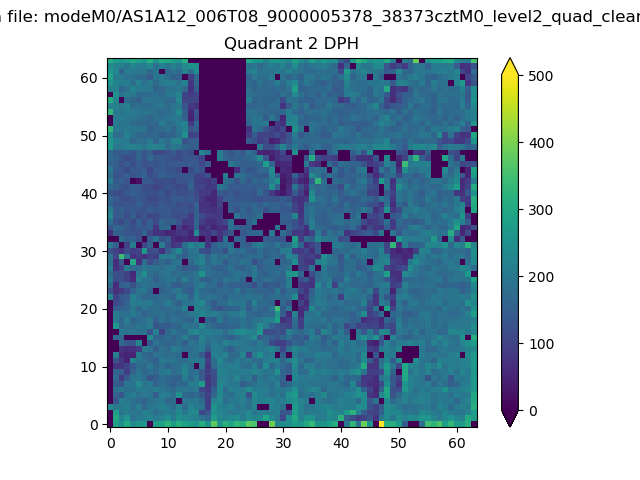
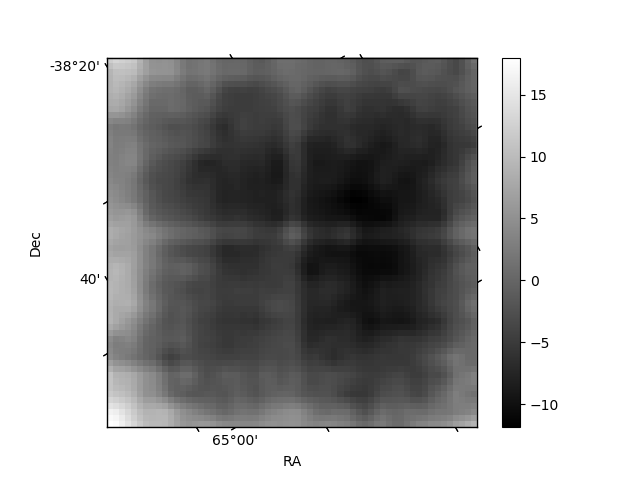
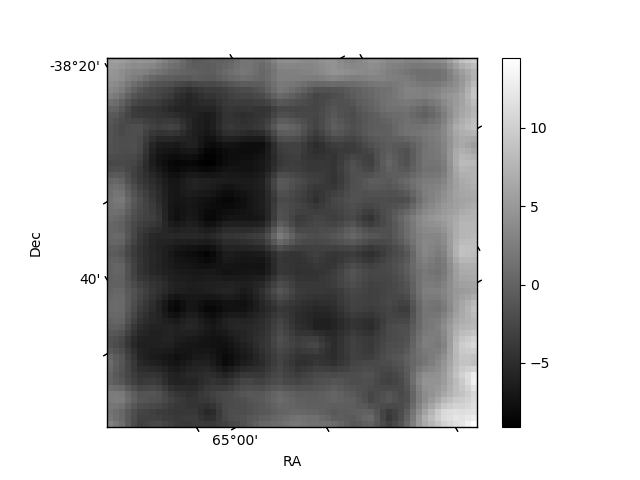
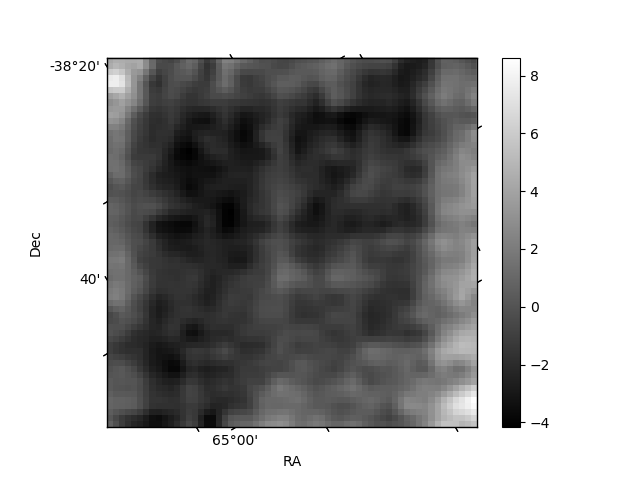
Histogram calculated using DETX and DETY for each event in the final _common_clean file
| Quadrant A | 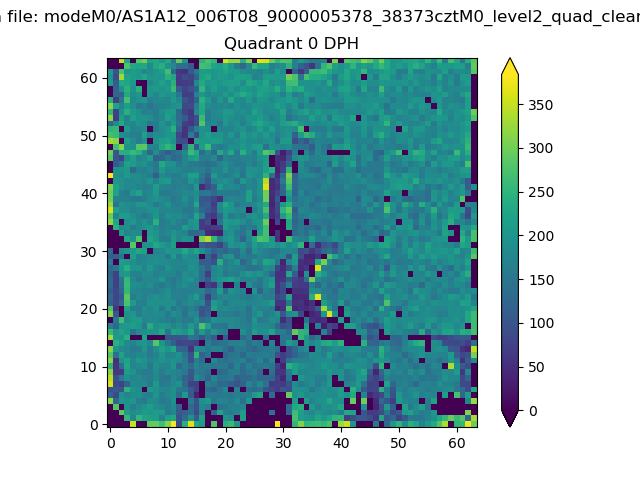 |
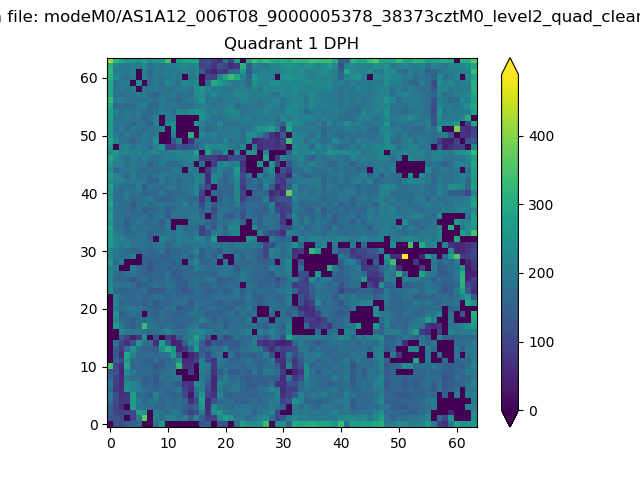 |
Quadrant B |
|---|---|---|---|
| Quadrant D | 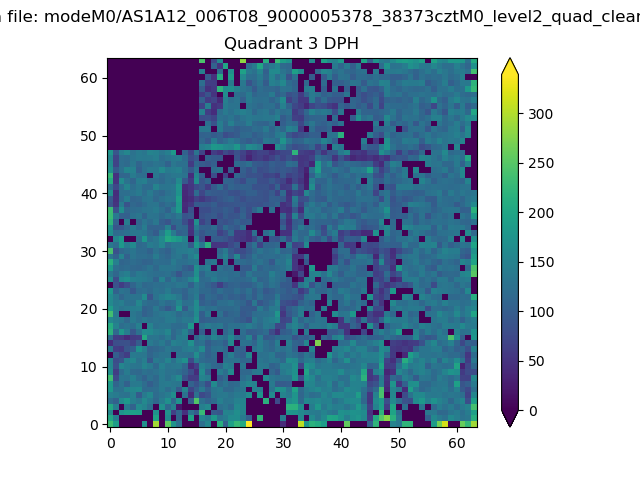 |
 |
Quadrant C |
| Plot type | Count rate plots | Images |
|---|---|---|
| Comparison with Poisson distribution Blue bars denote a histogram of data divided into 1 sec bins. Red curve is a Poisson curve with rate = median count rate of data. |
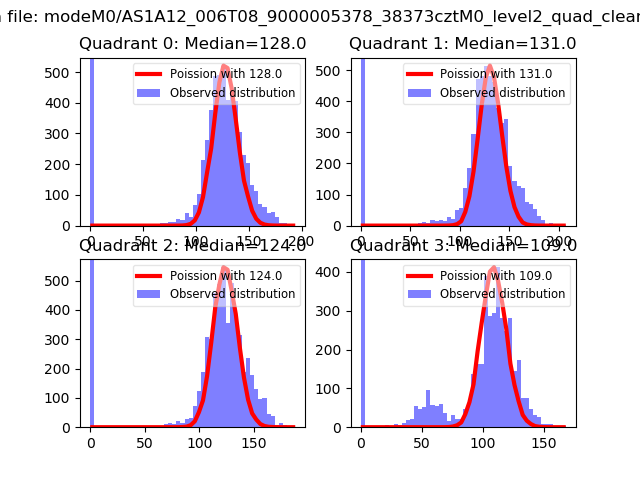 |
 |
| Quadrant-wise count rates Data is divided into 100 sec bins |
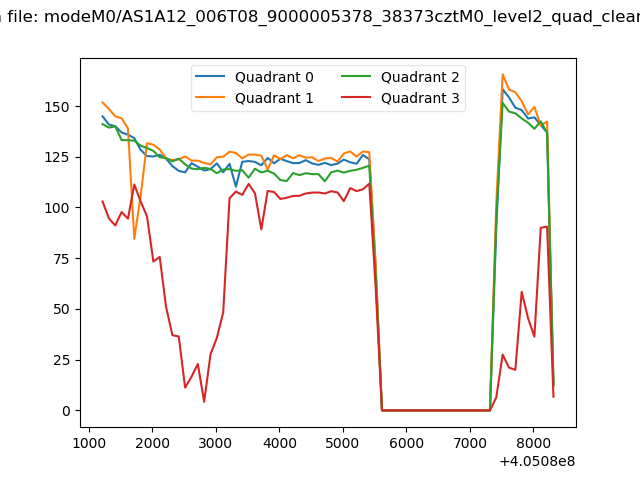 |
|
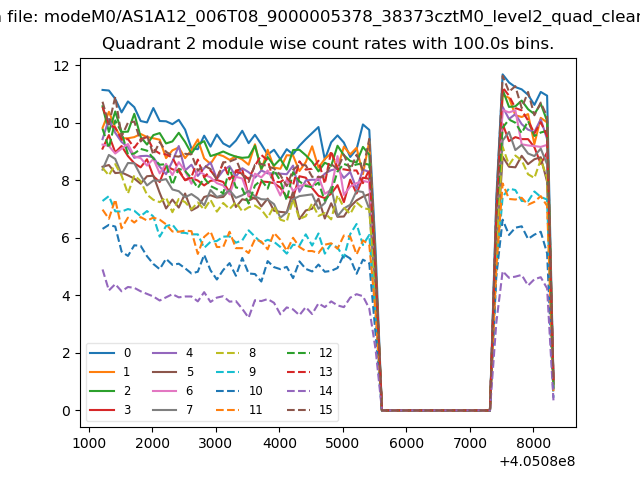
| Module-wise count rates for Quadrant A Data is divided into 100 sec bins |
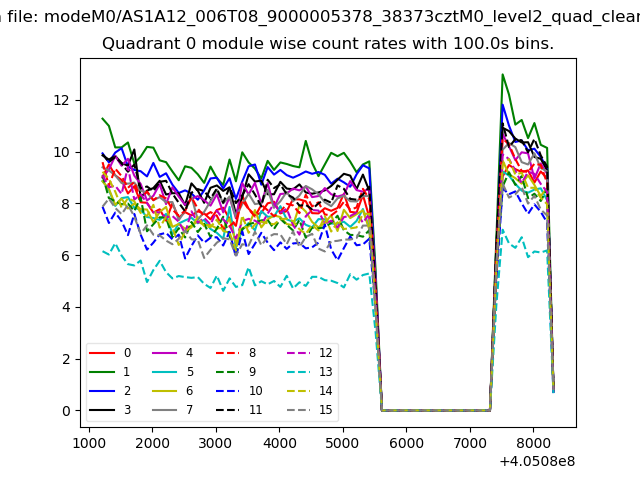 |
 |
| Module-wise count rates for Quadrant B Data is divided into 100 sec bins |
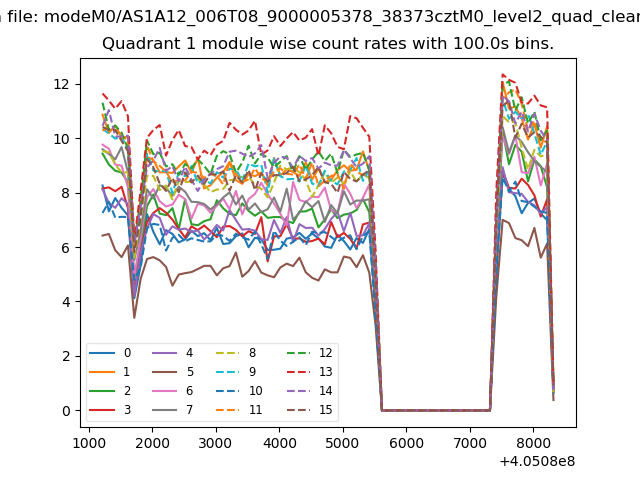 |
 |
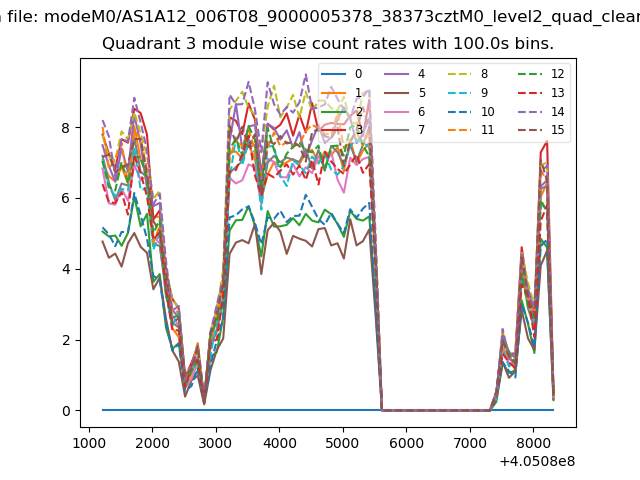
| Module-wise count rates for Quadrant C Data is divided into 100 sec bins |
 |
 |
| Module-wise count rates for Quadrant D Data is divided into 100 sec bins |
 |
 |
| Parameter | Plot |
|---|---|
| CZT HV Monitor | 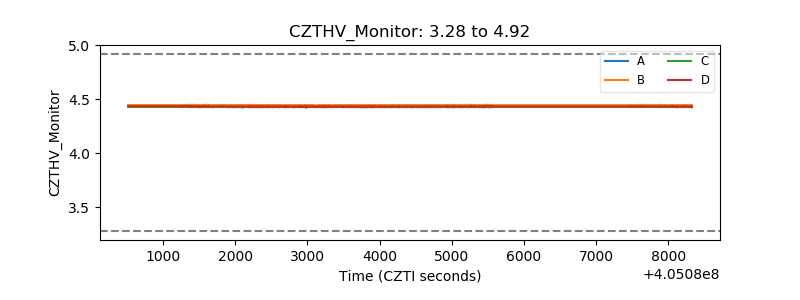 |
| D_VDD | 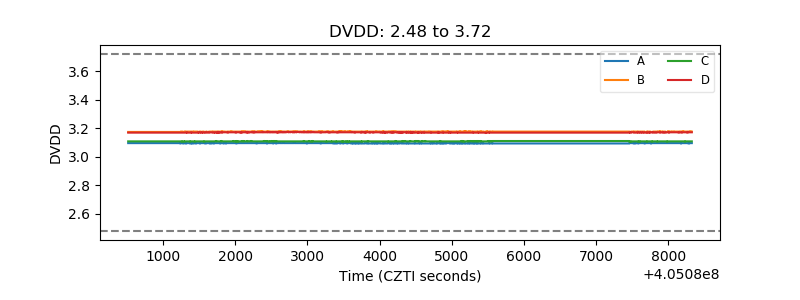 |
| Temperature 1 | 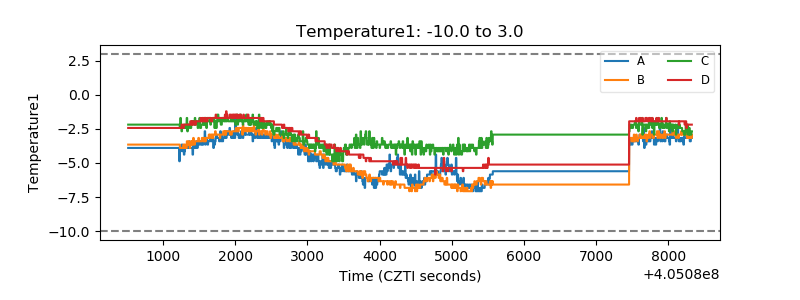 |
| Veto HV Monitor | 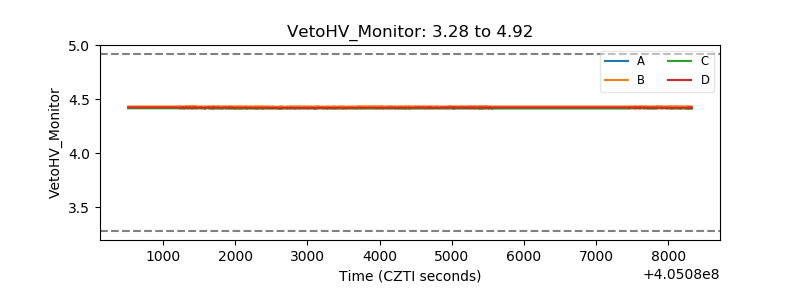 |
| Veto LLD | 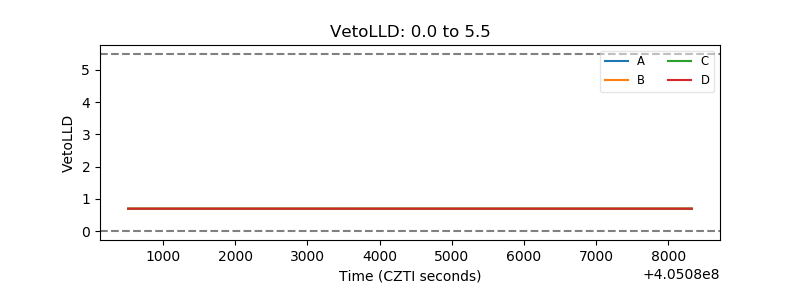 |
| Alpha Counter | 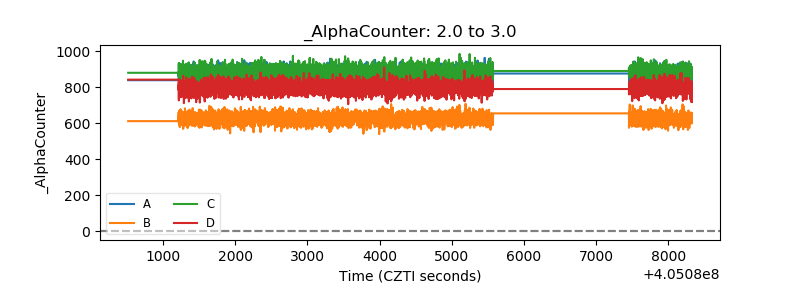 |
| _CPM_Rate | 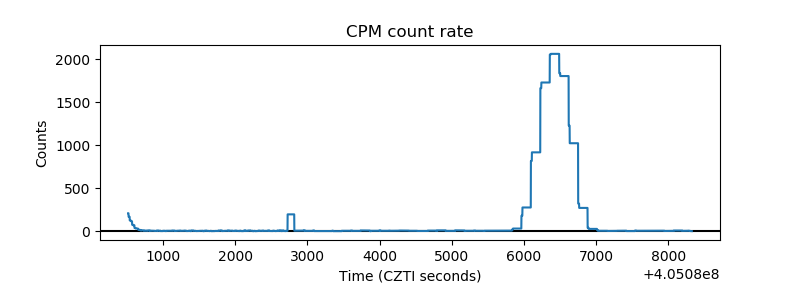 |
| CZT Counter | 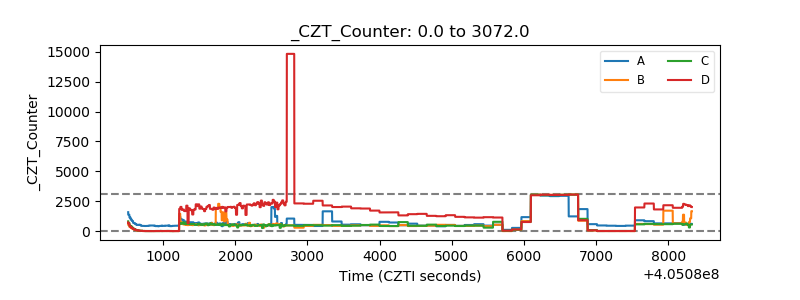 |
| +2.5 Volts monitor | 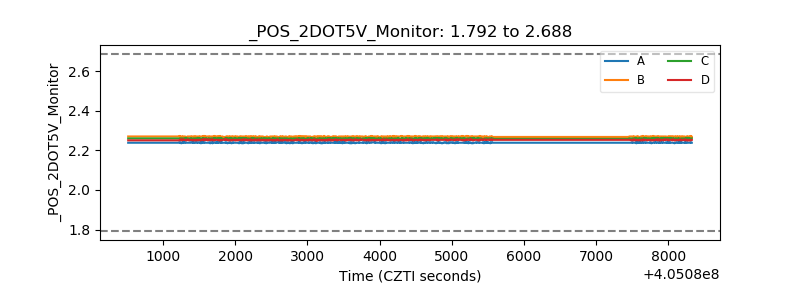 |
| +5 Volts monitor | 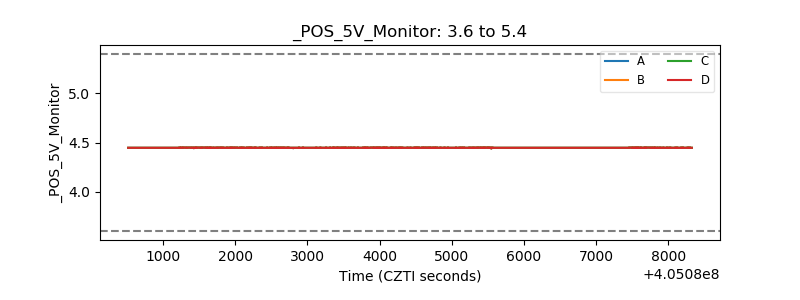 |
| _ROLL_ROT | 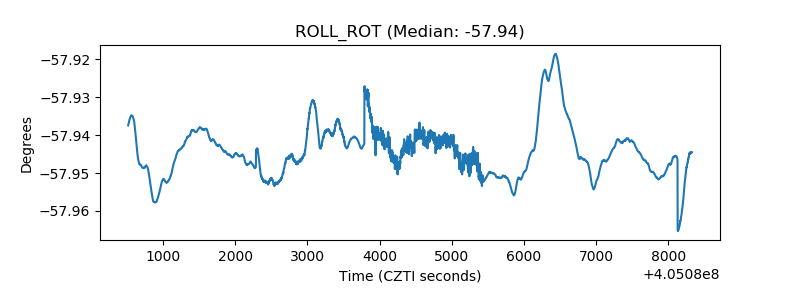 |
| _Roll_DEC | 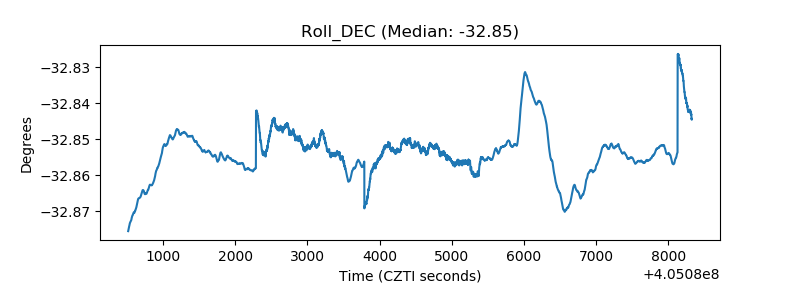 |
| _Roll_RA | 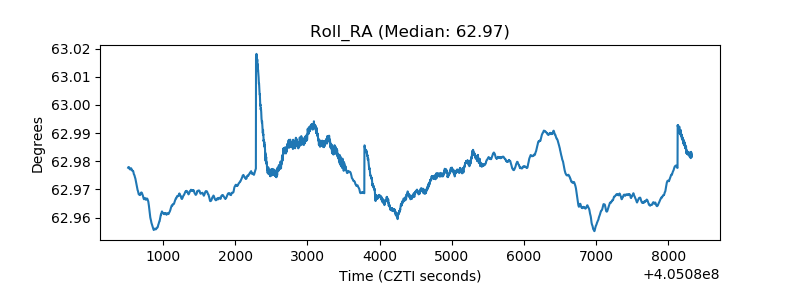 |
| Veto Counter | 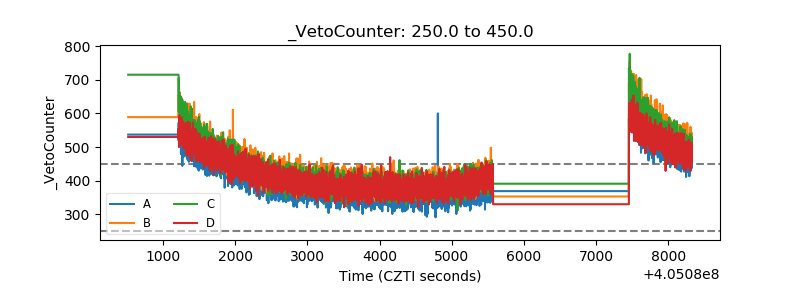 |