| Param | Original file | Final file |
|---|---|---|
| Filename | modeM0/AS1A12_006T08_9000005378_38374cztM0_level2.fits | modeM0/AS1A12_006T08_9000005378_38374cztM0_level2_quad_clean.evt |
| Size (bytes) | 556,142,400 | 97,505,280 |
| Size | 530.4 MB | 93.0 MB |
| Events in quadrant A | 3,335,220 | 737,122 |
| Events in quadrant B | 3,329,442 | 760,000 |
| Events in quadrant C | 2,888,986 | 710,234 |
| Events in quadrant D | 10,610,386 | 364,438 |
| Mode M0 | |||
|---|---|---|---|
| Quadrant | BADHDUFLAG | Total packets | Discarded packets |
| A | 0 | 13396 | 3 |
| B | 0 | 13373 | 2 |
| C | 0 | 11825 | 2 |
| D | 0 | 35230 | 2 |
| Mode M9 | |||
|---|---|---|---|
| Quadrant | BADHDUFLAG | Total packets | Discarded packets |
| A | 0 | 38 | 0 |
| B | 0 | 38 | 0 |
| C | 0 | 38 | 0 |
| D | 0 | 38 | 0 |
| Mode SS | |||
|---|---|---|---|
| Quadrant | BADHDUFLAG | Total packets | Discarded packets |
| A | 0 | 110 | 0 |
| B | 0 | 110 | 0 |
| C | 0 | 110 | 0 |
| D | 0 | 110 | 0 |
| Quadrant | Total seconds | Saturated seconds | Saturation percentage |
|---|---|---|---|
| A | 5444 | 36 | 0.661278% |
| B | 5444 | 44 | 0.808229% |
| C | 5444 | 12 | 0.220426% |
| D | 5444 | 2670 | 49.044820% |
Noise dominated data is calculated using 1-second bins in cleaned event files. If a bin has >2000 counts, and if more than 50% of those come from <1% of pixels, then it is considered to be noise-dominated and hence unusable.
| Quadrant | # 1 sec bins | Bins with >0 counts | Bins with >2000 counts | High rate bins dominated by noise | Noise dominated (total time) | Noise dominated (detector-on time) | Marked lightcurve |
|---|---|---|---|---|---|---|---|
| A | 7447 | 5445 | 15 | 15 | 0.20% | 0.28% | 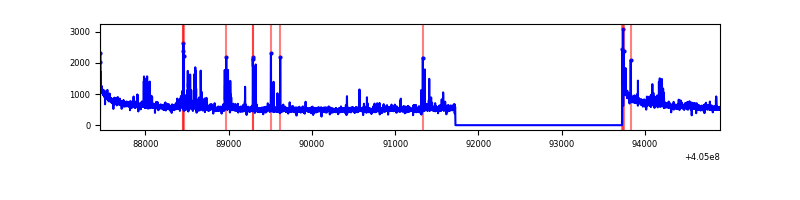 |
| B | 7447 | 5445 | 15 | 15 | 0.20% | 0.28% | 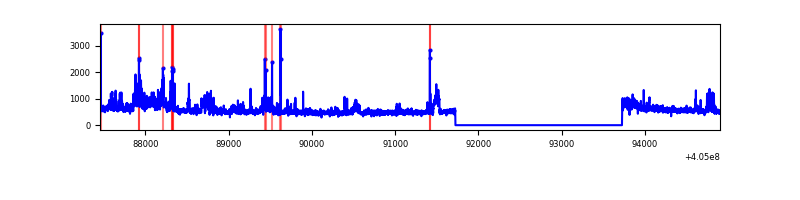 |
| C | 7447 | 5445 | 2 | 2 | 0.03% | 0.04% | 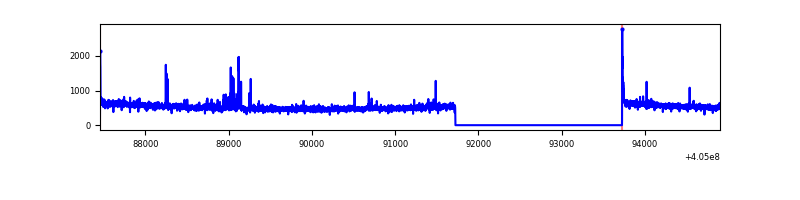 |
| D | 7447 | 5445 | 3092 | 3092 | 41.52% | 56.79% | 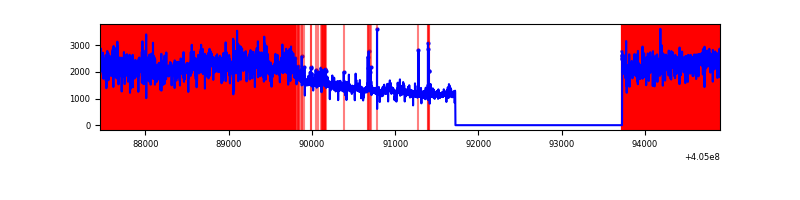 |
Top three noisy pixels from each quadrant. If the there are fewer than three noisy pixels in the level2.evt file, extra rows are filled as -1
| Pixel properties | Quadrant properties | ||||||
|---|---|---|---|---|---|---|---|
| Quadrant | DetID | PixID | Counts | Sigma | Mean | Median | Sigma |
| A | 10 | 83 | 398999 | 2904.47 | 683 | 673 | 137.1 |
| A | 9 | 143 | 126255 | 915.7 | 683 | 673 | 137.1 |
| A | 12 | 16 | 101176 | 732.84 | 683 | 673 | 137.1 |
| B | 0 | 183 | 411400 | 3223.13 | 681 | 665 | 127.4 |
| B | 0 | 189 | 115384 | 900.23 | 681 | 665 | 127.4 |
| B | 4 | 21 | 30681 | 235.54 | 681 | 665 | 127.4 |
| C | 15 | 214 | 229796 | 1516.55 | 657 | 662 | 151.1 |
| C | 14 | 254 | 71190 | 466.8 | 657 | 662 | 151.1 |
| C | 0 | 10 | 23379 | 150.35 | 657 | 662 | 151.1 |
| D | 10 | 203 | 6707304 | 47054.91 | 592 | 577 | 142.5 |
| D | 12 | 235 | 1133674 | 7949.9 | 592 | 577 | 142.5 |
| D | 7 | 223 | 232111 | 1624.46 | 592 | 577 | 142.5 |
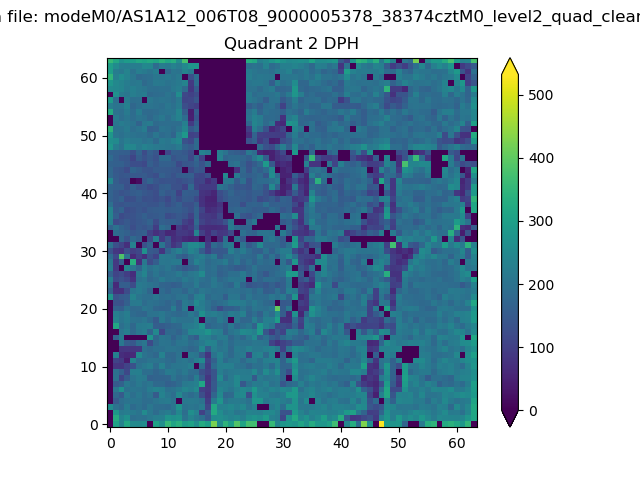
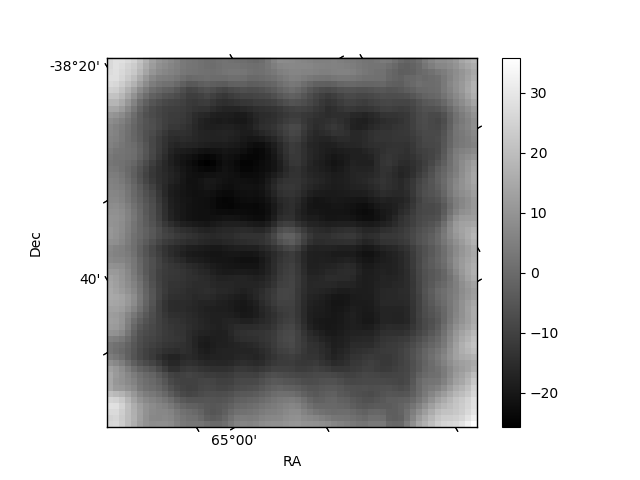
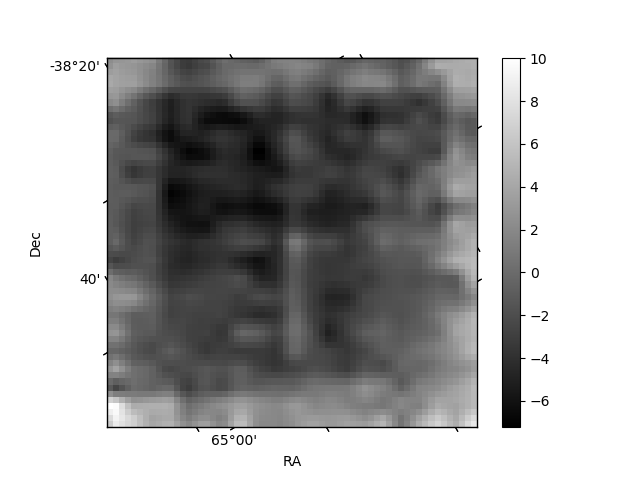
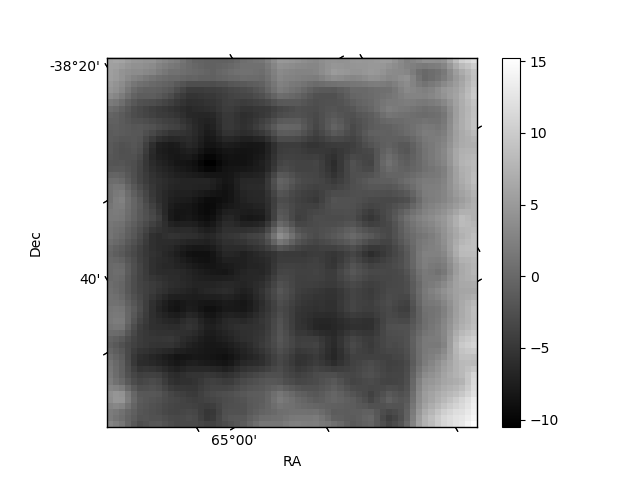
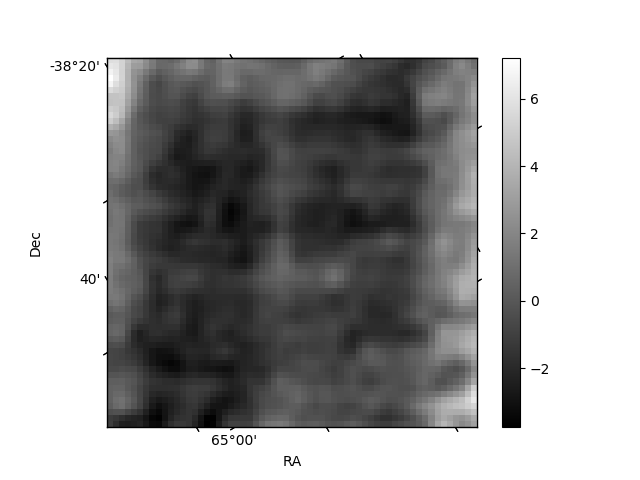
Histogram calculated using DETX and DETY for each event in the final _common_clean file
| Quadrant A | 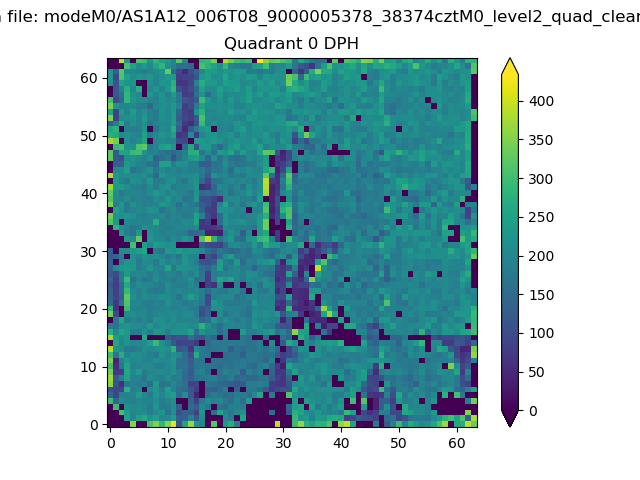 |
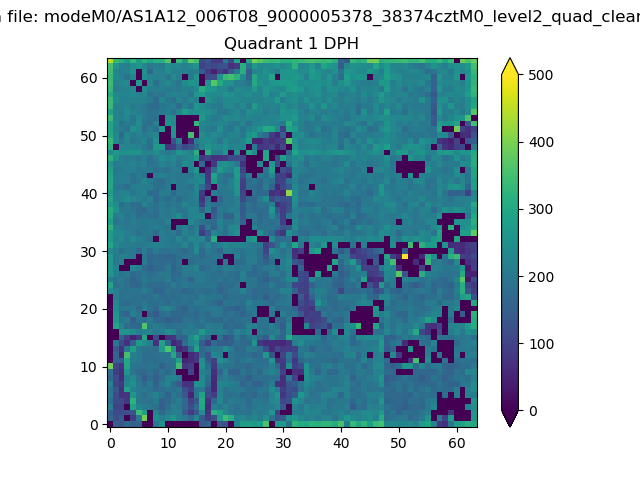 |
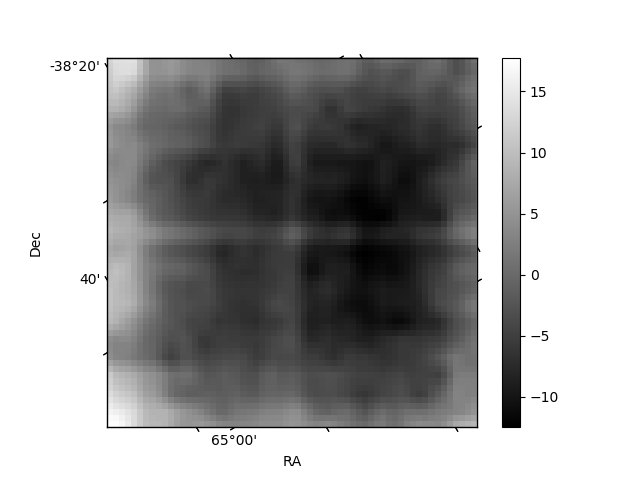
Quadrant B |
|---|---|---|---|
| Quadrant D | 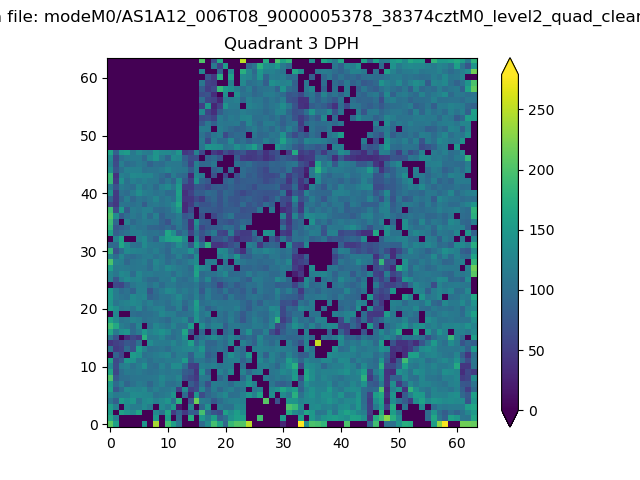 |
 |
Quadrant C |
| Plot type | Count rate plots | Images |
|---|---|---|
| Comparison with Poisson distribution Blue bars denote a histogram of data divided into 1 sec bins. Red curve is a Poisson curve with rate = median count rate of data. |
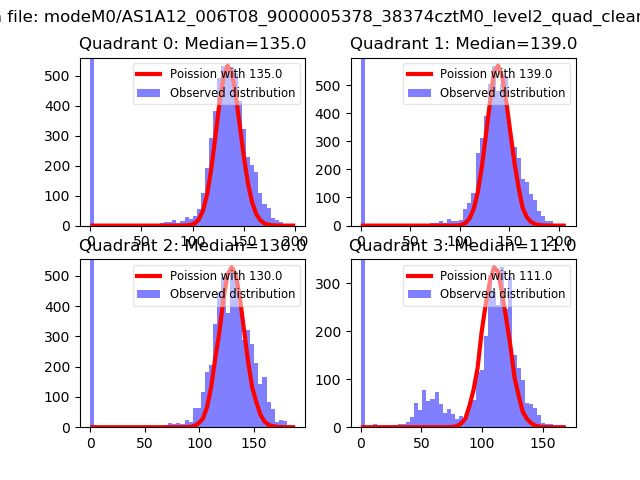 |
 |
| Quadrant-wise count rates Data is divided into 100 sec bins |
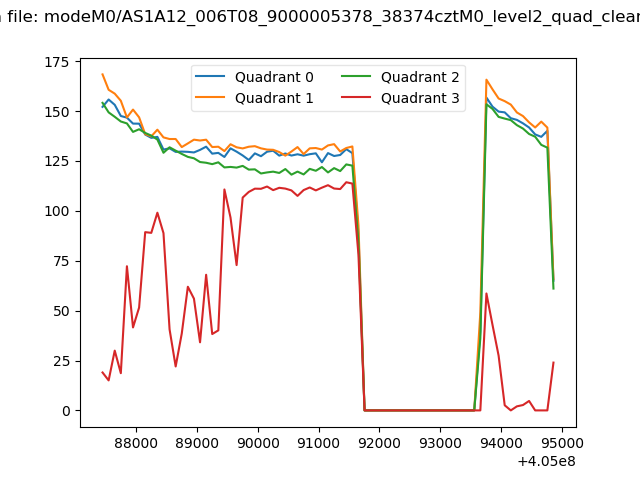 |
|
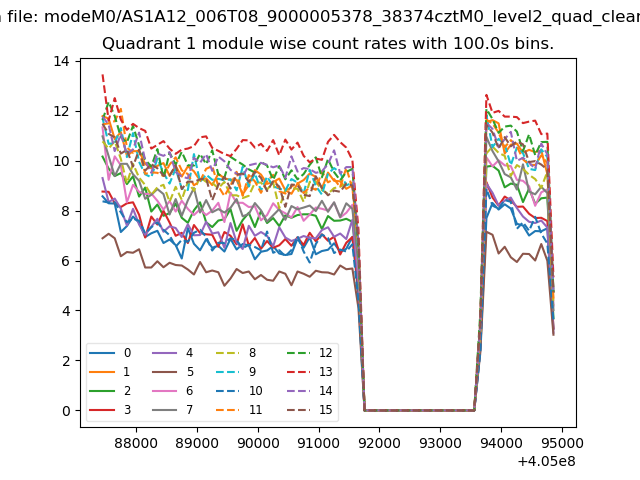
| Module-wise count rates for Quadrant A Data is divided into 100 sec bins |
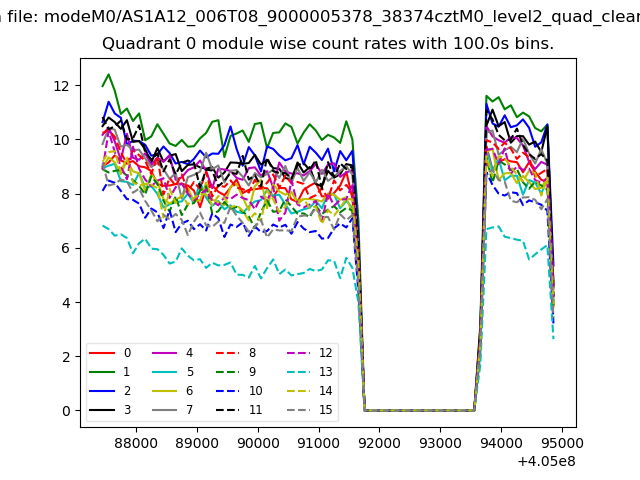 |
 |
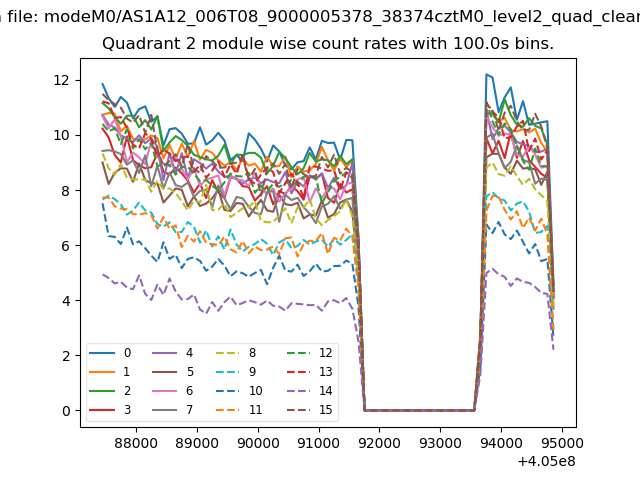
| Module-wise count rates for Quadrant B Data is divided into 100 sec bins |
 |
 |
| Module-wise count rates for Quadrant C Data is divided into 100 sec bins |
 |
 |
| Module-wise count rates for Quadrant D Data is divided into 100 sec bins |
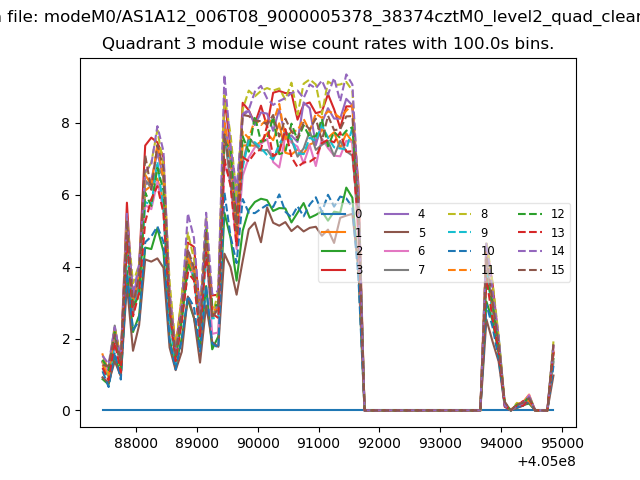 |
 |
| Parameter | Plot |
|---|---|
| CZT HV Monitor | 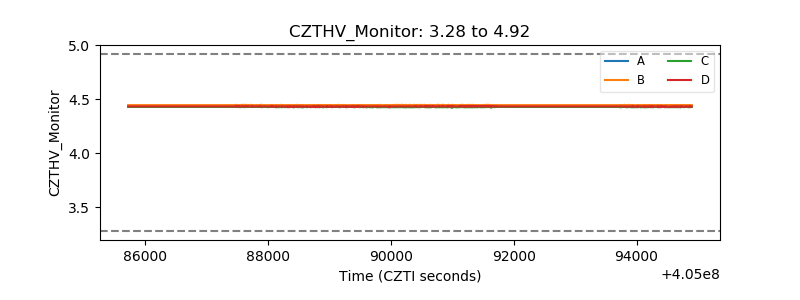 |
| D_VDD | 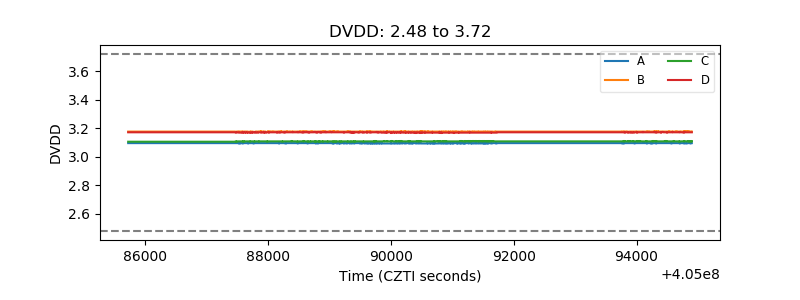 |
| Temperature 1 | 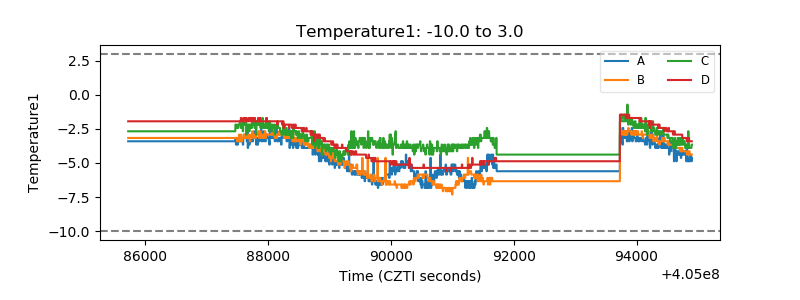 |
| Veto HV Monitor | 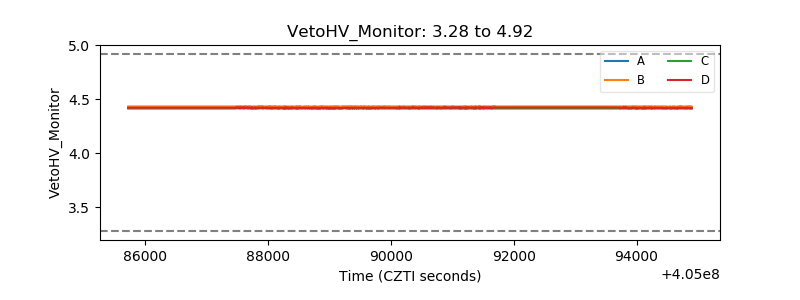 |
| Veto LLD | 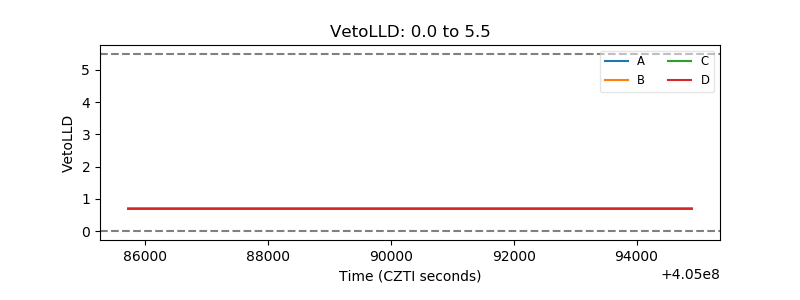 |
| Alpha Counter | 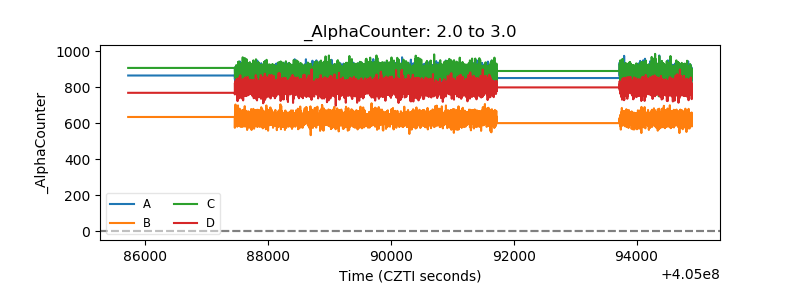 |
| _CPM_Rate | 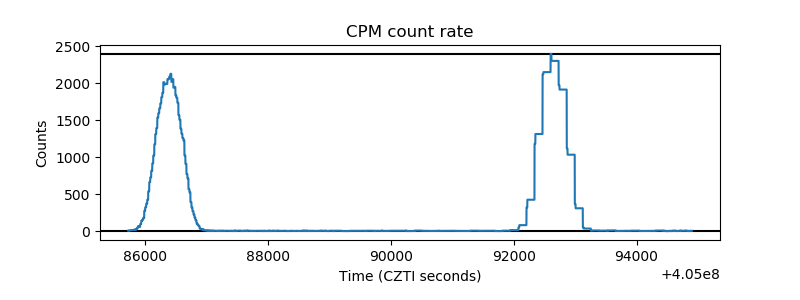 |
| CZT Counter | 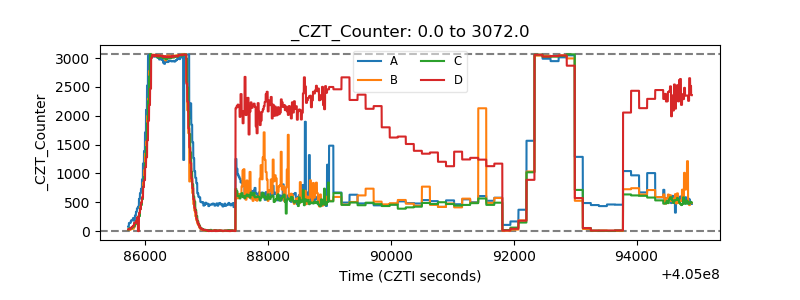 |
| +2.5 Volts monitor | 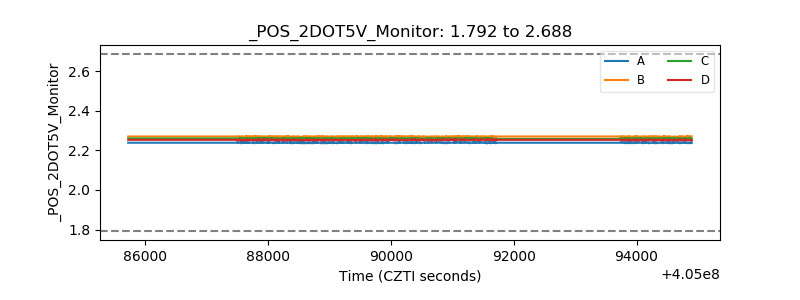 |
| +5 Volts monitor | 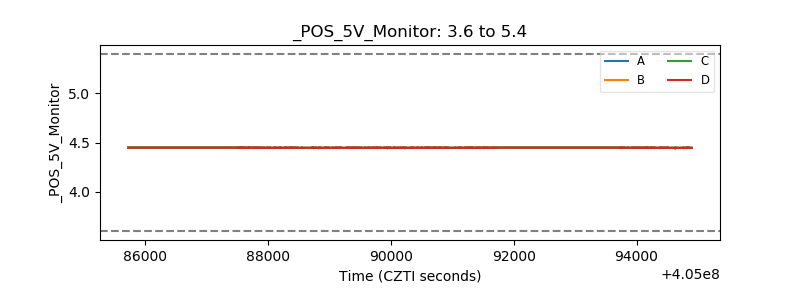 |
| _ROLL_ROT | 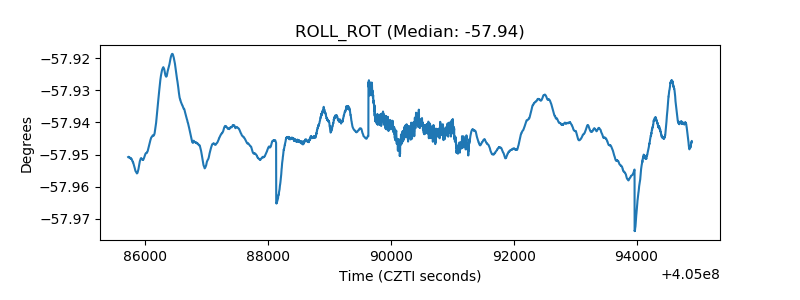 |
| _Roll_DEC | 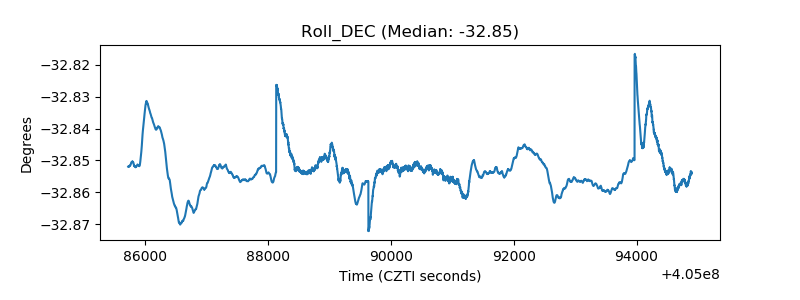 |
| _Roll_RA | 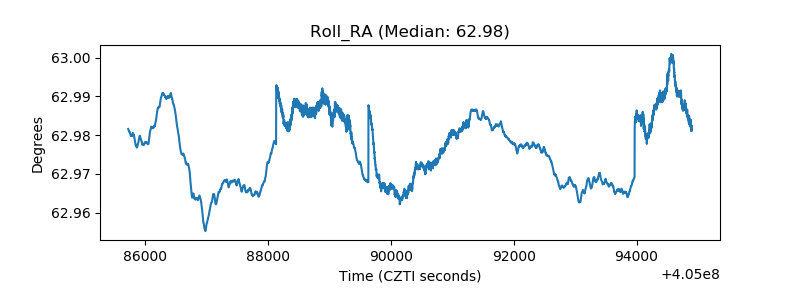 |
| Veto Counter | 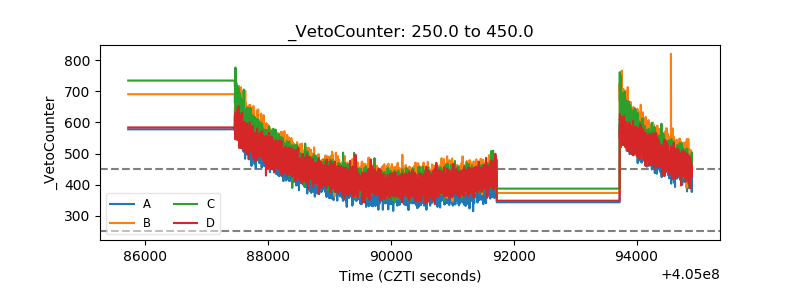 |