| Param | Original file | Final file |
|---|---|---|
| Filename | modeM0/AS1A12_006T08_9000005378_38375cztM0_level2.fits | modeM0/AS1A12_006T08_9000005378_38375cztM0_level2_quad_clean.evt |
| Size (bytes) | 436,809,600 | 89,343,360 |
| Size | 416.6 MB | 85.2 MB |
| Events in quadrant A | 2,793,331 | 653,839 |
| Events in quadrant B | 2,573,105 | 674,160 |
| Events in quadrant C | 2,481,456 | 623,864 |
| Events in quadrant D | 7,948,250 | 416,789 |
| Mode M0 | |||
|---|---|---|---|
| Quadrant | BADHDUFLAG | Total packets | Discarded packets |
| A | 0 | 11486 | 173 |
| B | 0 | 10705 | 141 |
| C | 0 | 10295 | 148 |
| D | 0 | 27557 | 609 |
| Mode M9 | |||
|---|---|---|---|
| Quadrant | BADHDUFLAG | Total packets | Discarded packets |
| A | 0 | 21 | 0 |
| B | 0 | 21 | 0 |
| C | 0 | 21 | 0 |
| D | 0 | 21 | 0 |
| Mode SS | |||
|---|---|---|---|
| Quadrant | BADHDUFLAG | Total packets | Discarded packets |
| A | 0 | 100 | 2 |
| B | 0 | 100 | 6 |
| C | 0 | 100 | 0 |
| D | 0 | 100 | 2 |
| Quadrant | Total seconds | Saturated seconds | Saturation percentage |
|---|---|---|---|
| A | 4825 | 30 | 0.621762% |
| B | 4825 | 9 | 0.186528% |
| C | 4820 | 7 | 0.145228% |
| D | 4748 | 1267 | 26.684920% |
Noise dominated data is calculated using 1-second bins in cleaned event files. If a bin has >2000 counts, and if more than 50% of those come from <1% of pixels, then it is considered to be noise-dominated and hence unusable.
| Quadrant | # 1 sec bins | Bins with >0 counts | Bins with >2000 counts | High rate bins dominated by noise | Noise dominated (total time) | Noise dominated (detector-on time) | Marked lightcurve |
|---|---|---|---|---|---|---|---|
| A | 6979 | 4881 | 11 | 11 | 0.16% | 0.23% | 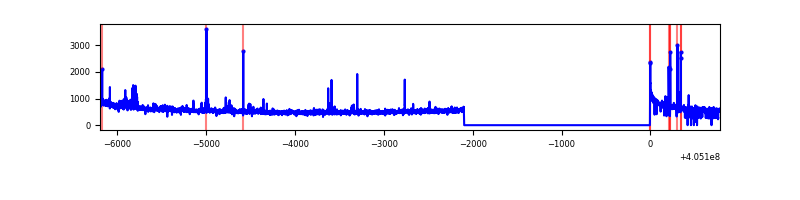 |
| B | 6979 | 4878 | 0 | 0 | 0.00% | 0.00% | 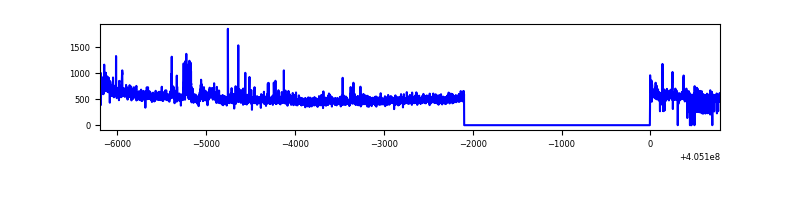 |
| C | 6978 | 4873 | 1 | 1 | 0.01% | 0.02% | 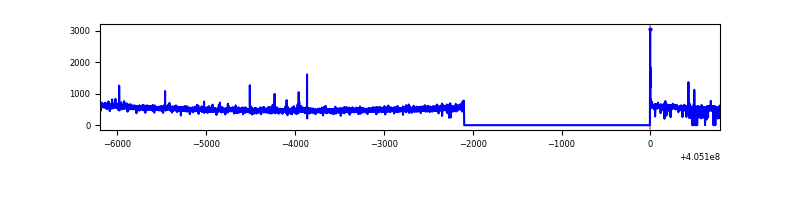 |
| D | 6977 | 4846 | 1450 | 1450 | 20.78% | 29.92% | 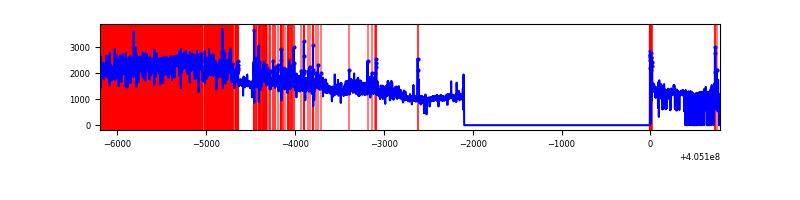 |
Top three noisy pixels from each quadrant. If the there are fewer than three noisy pixels in the level2.evt file, extra rows are filled as -1
| Pixel properties | Quadrant properties | ||||||
|---|---|---|---|---|---|---|---|
| Quadrant | DetID | PixID | Counts | Sigma | Mean | Median | Sigma |
| A | 10 | 83 | 328433 | 2723.76 | 599 | 591 | 120.4 |
| A | 9 | 143 | 62547 | 514.74 | 599 | 591 | 120.4 |
| A | 12 | 16 | 36653 | 299.61 | 599 | 591 | 120.4 |
| B | 0 | 183 | 102005 | 894.01 | 600 | 586 | 113.4 |
| B | 0 | 230 | 28516 | 246.2 | 600 | 586 | 113.4 |
| B | 0 | 189 | 25502 | 219.64 | 600 | 586 | 113.4 |
| C | 15 | 214 | 204616 | 1546.75 | 574 | 580 | 131.9 |
| C | 14 | 254 | 19407 | 142.72 | 574 | 580 | 131.9 |
| C | 0 | 10 | 10718 | 76.85 | 574 | 580 | 131.9 |
| D | 10 | 203 | 4646927 | 36096.46 | 530 | 517 | 128.7 |
| D | 12 | 235 | 893267 | 6935.49 | 530 | 517 | 128.7 |
| D | 2 | 16 | 196029 | 1518.87 | 530 | 517 | 128.7 |
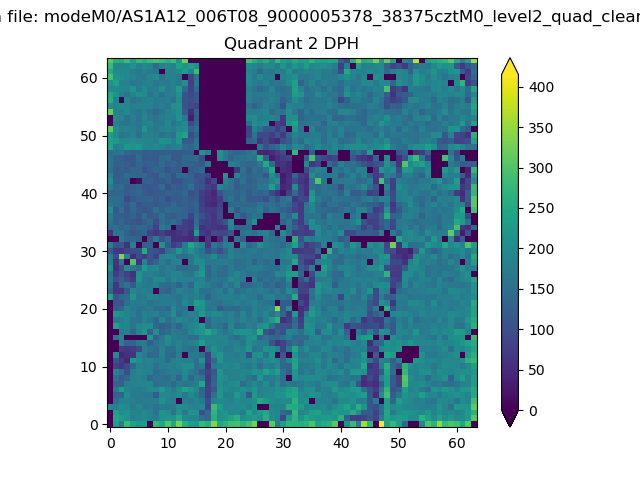
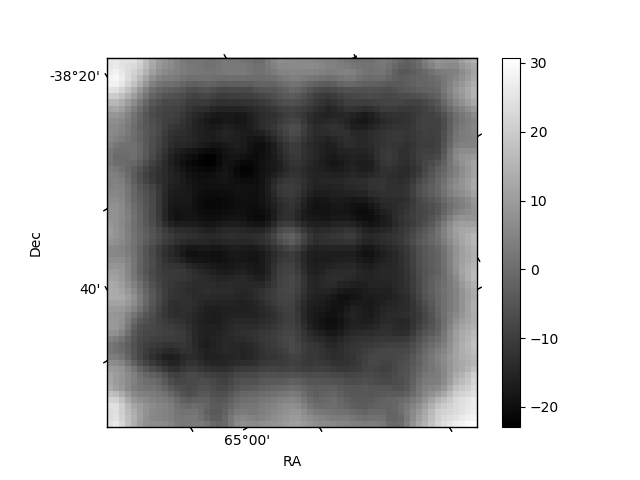
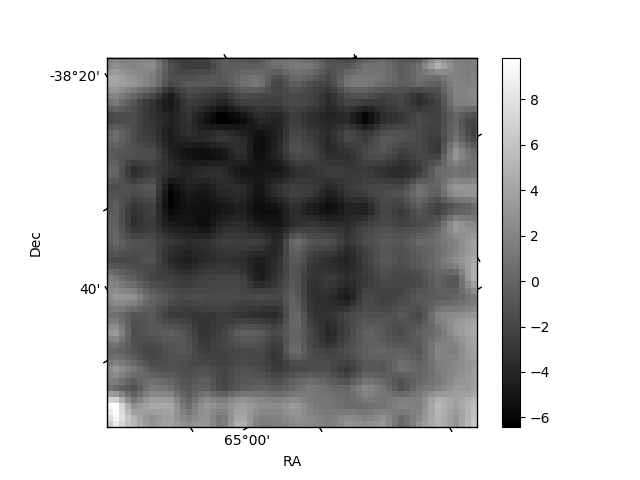
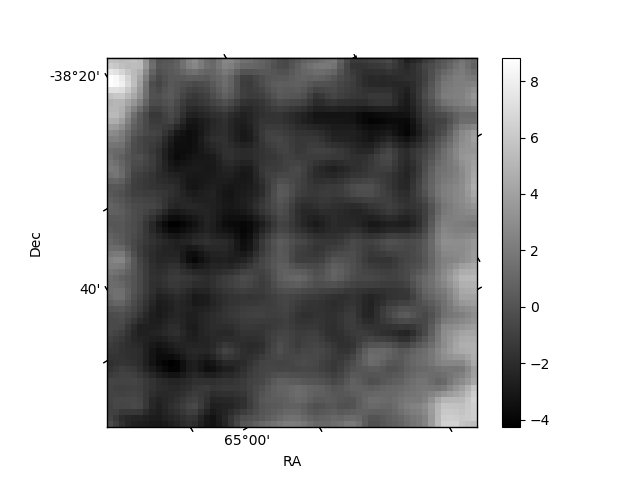
Histogram calculated using DETX and DETY for each event in the final _common_clean file
| Quadrant A | 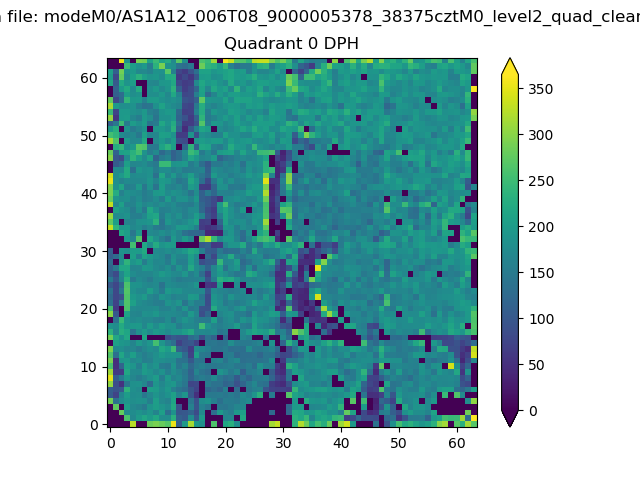 |
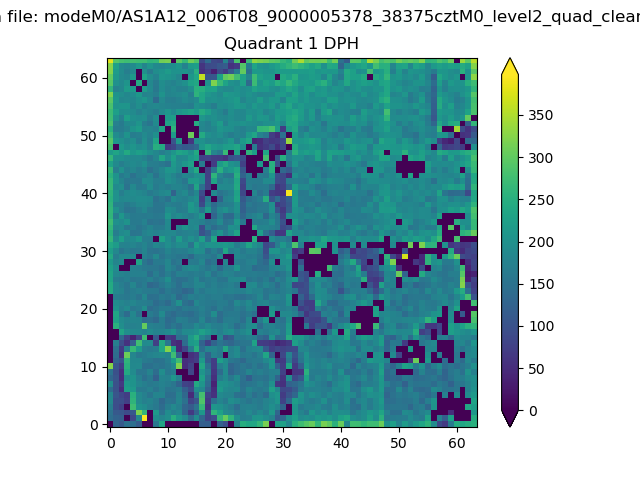 |
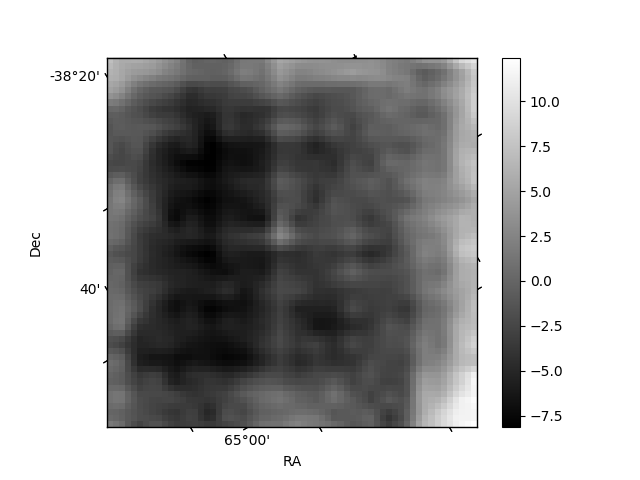
Quadrant B |
|---|---|---|---|
| Quadrant D | 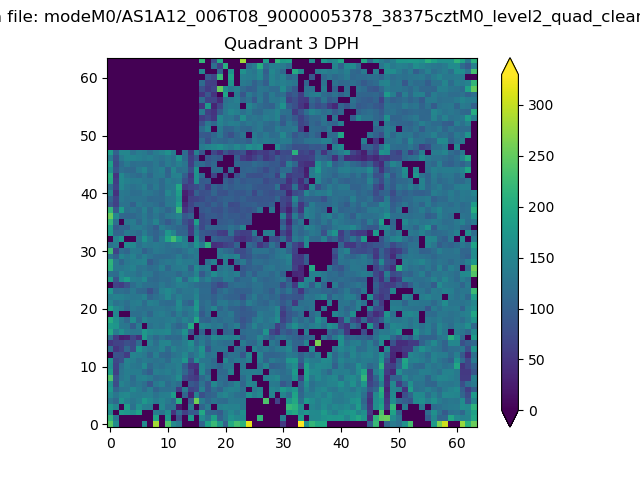 |
 |
Quadrant C |
| Plot type | Count rate plots | Images |
|---|---|---|
| Comparison with Poisson distribution Blue bars denote a histogram of data divided into 1 sec bins. Red curve is a Poisson curve with rate = median count rate of data. |
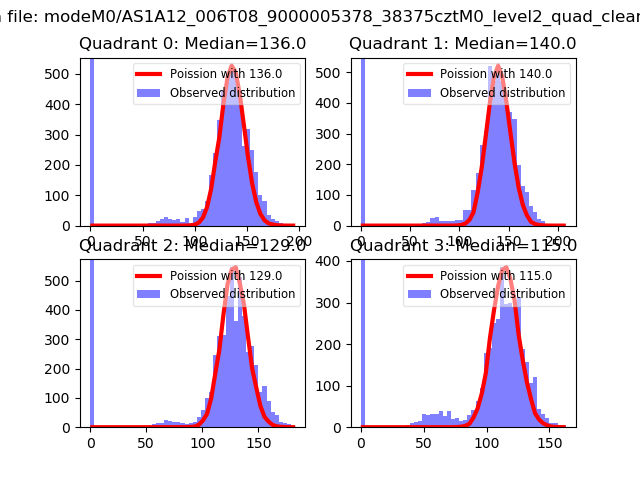 |
 |
| Quadrant-wise count rates Data is divided into 100 sec bins |
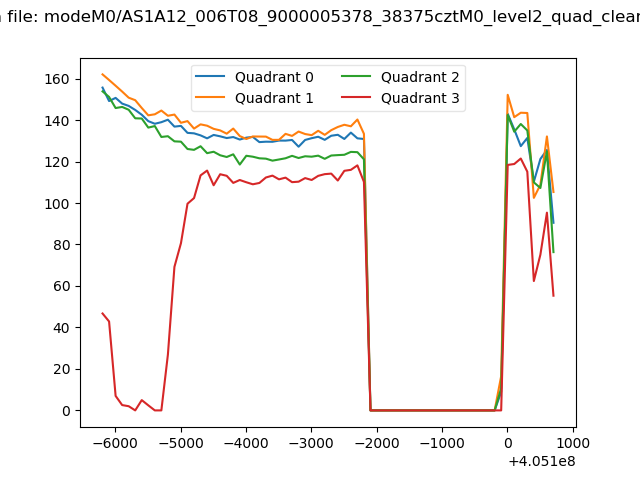 |
|
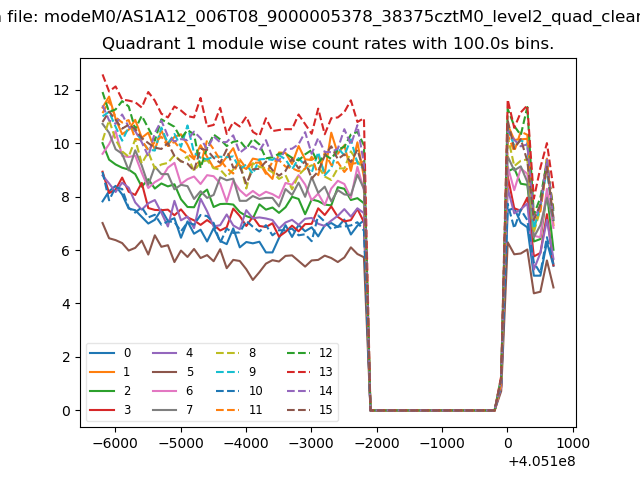
| Module-wise count rates for Quadrant A Data is divided into 100 sec bins |
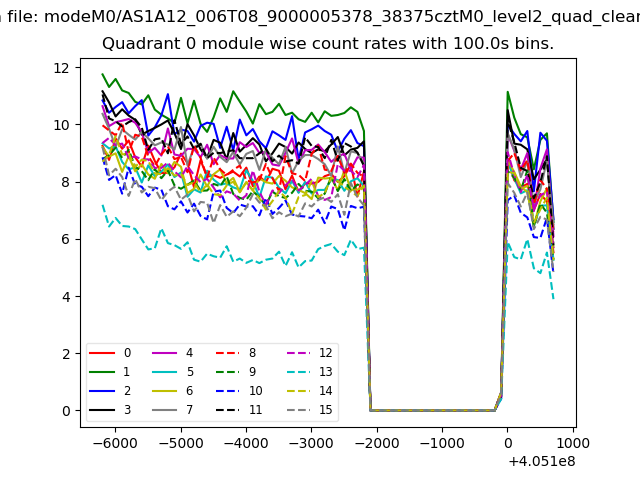 |
 |
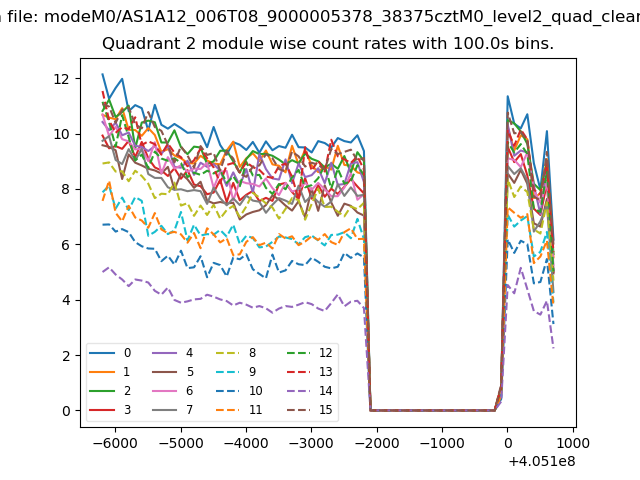
| Module-wise count rates for Quadrant B Data is divided into 100 sec bins |
 |
 |
| Module-wise count rates for Quadrant C Data is divided into 100 sec bins |
 |
 |
| Module-wise count rates for Quadrant D Data is divided into 100 sec bins |
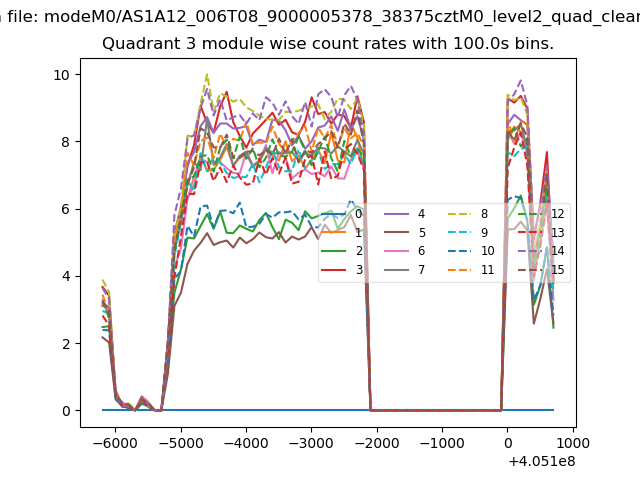 |
 |
| Parameter | Plot |
|---|---|
| CZT HV Monitor | 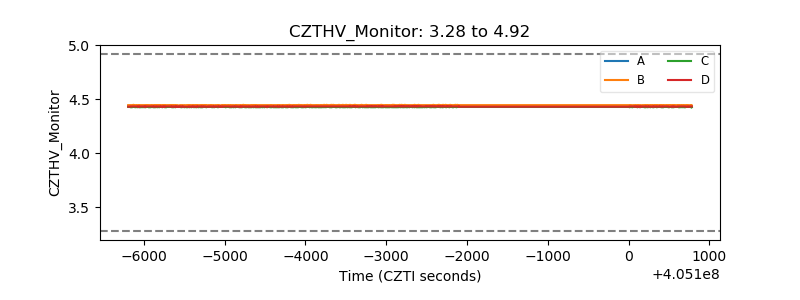 |
| D_VDD | 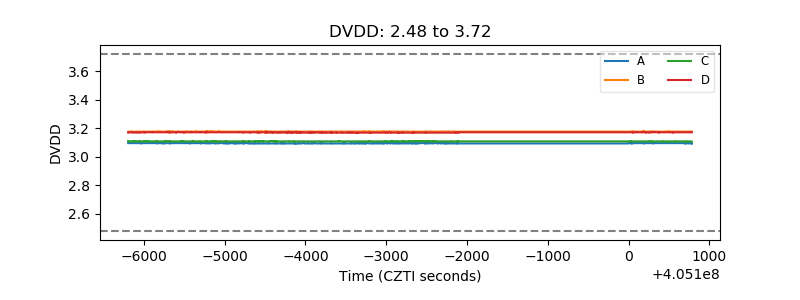 |
| Temperature 1 | 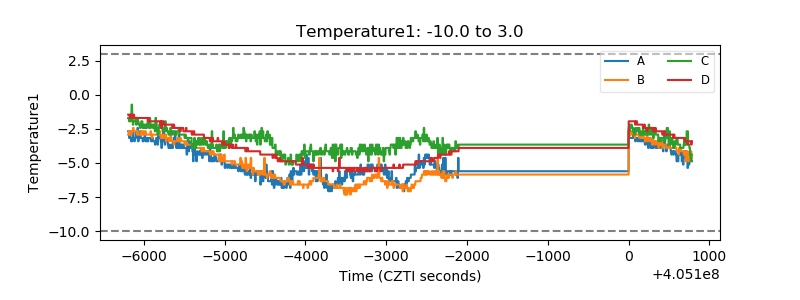 |
| Veto HV Monitor | 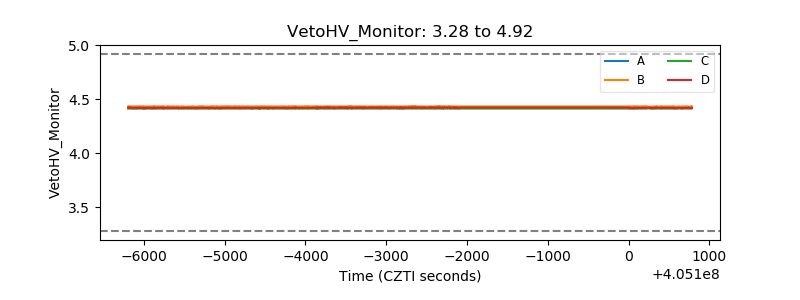 |
| Veto LLD | 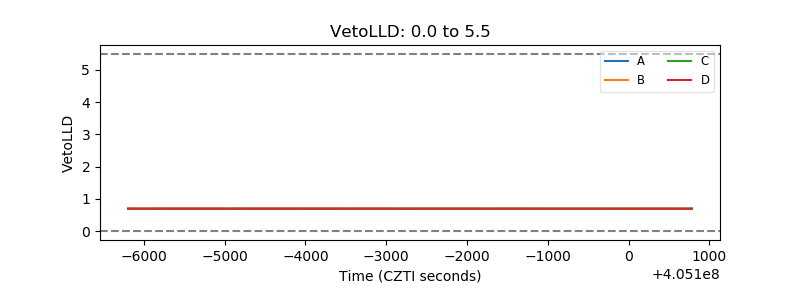 |
| Alpha Counter | 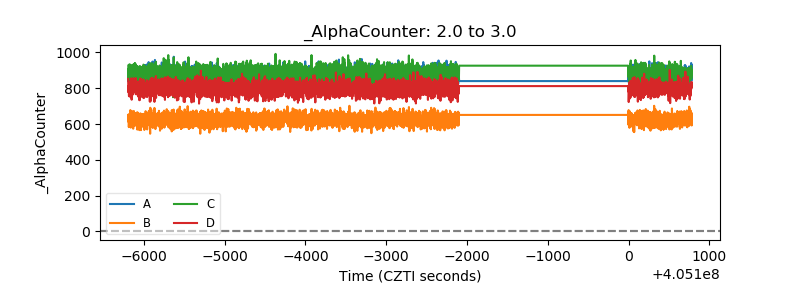 |
| _CPM_Rate | 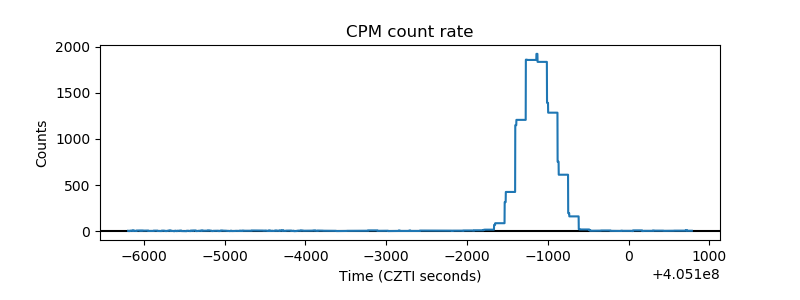 |
| CZT Counter | 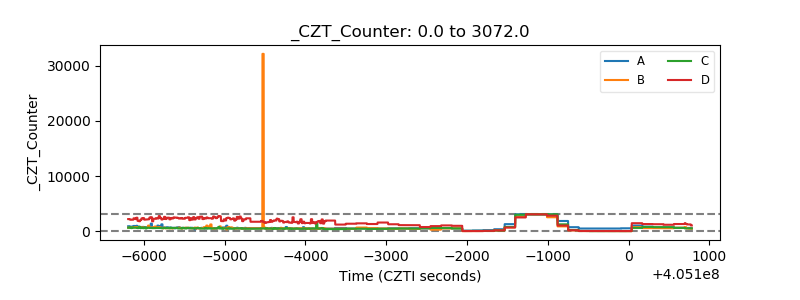 |
| +2.5 Volts monitor | 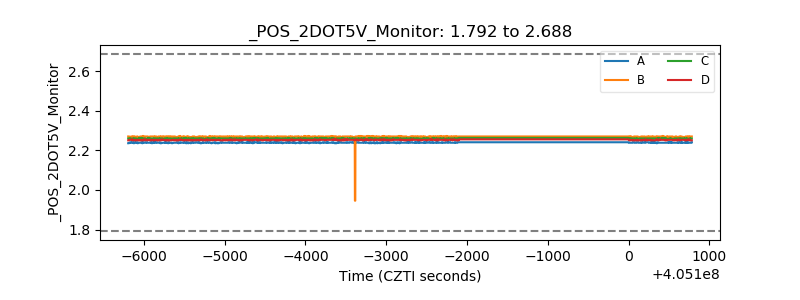 |
| +5 Volts monitor | 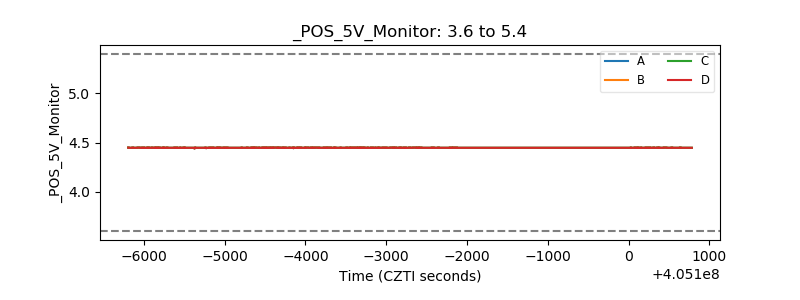 |
| _ROLL_ROT | 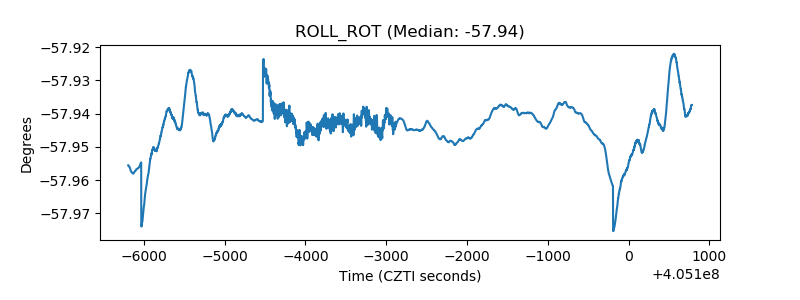 |
| _Roll_DEC | 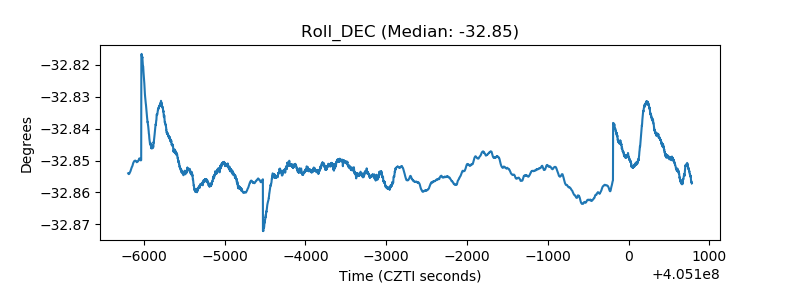 |
| _Roll_RA | 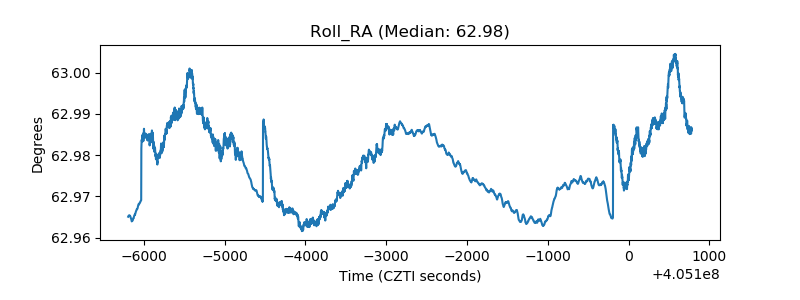 |
| Veto Counter | 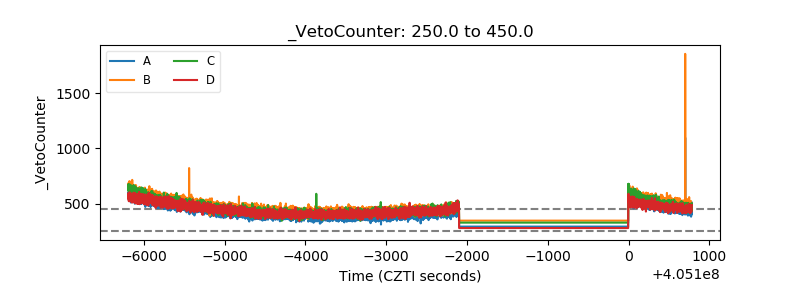 |