| Param | Original file | Final file |
|---|---|---|
| Filename | modeM0/AS1A12_006T08_9000005378_38376cztM0_level2.fits | modeM0/AS1A12_006T08_9000005378_38376cztM0_level2_quad_clean.evt |
| Size (bytes) | 102,242,880 | 24,229,440 |
| Size | 97.5 MB | 23.1 MB |
| Events in quadrant A | 810,214 | 165,640 |
| Events in quadrant B | 676,274 | 173,206 |
| Events in quadrant C | 655,408 | 160,908 |
| Events in quadrant D | 1,546,275 | 143,389 |
| Mode M0 | |||
|---|---|---|---|
| Quadrant | BADHDUFLAG | Total packets | Discarded packets |
| A | 0 | 3225 | 1 |
| B | 0 | 2711 | 1 |
| C | 0 | 2608 | 1 |
| D | 0 | 5431 | 1 |
| Mode M9 | |||
|---|---|---|---|
| Quadrant | BADHDUFLAG | Total packets | Discarded packets |
| A | 0 | 18 | 0 |
| B | 0 | 18 | 0 |
| C | 0 | 18 | 0 |
| D | 0 | 19 | 0 |
| Mode SS | |||
|---|---|---|---|
| Quadrant | BADHDUFLAG | Total packets | Discarded packets |
| A | 0 | 24 | 0 |
| B | 0 | 24 | 0 |
| C | 0 | 24 | 0 |
| D | 0 | 24 | 0 |
| Quadrant | Total seconds | Saturated seconds | Saturation percentage |
|---|---|---|---|
| A | 1207 | 24 | 1.988401% |
| B | 1207 | 4 | 0.331400% |
| C | 1207 | 4 | 0.331400% |
| D | 1207 | 55 | 4.556752% |
Noise dominated data is calculated using 1-second bins in cleaned event files. If a bin has >2000 counts, and if more than 50% of those come from <1% of pixels, then it is considered to be noise-dominated and hence unusable.
| Quadrant | # 1 sec bins | Bins with >0 counts | Bins with >2000 counts | High rate bins dominated by noise | Noise dominated (total time) | Noise dominated (detector-on time) | Marked lightcurve |
|---|---|---|---|---|---|---|---|
| A | 1207 | 1207 | 12 | 12 | 0.99% | 0.99% | 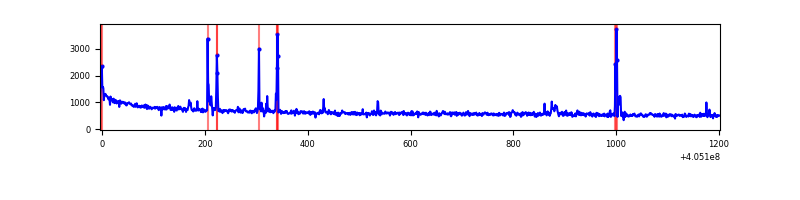 |
| B | 1207 | 1207 | 1 | 1 | 0.08% | 0.08% | 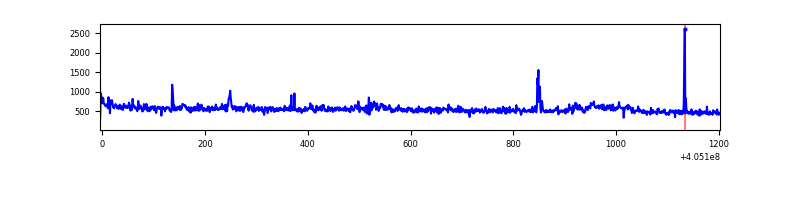 |
| C | 1207 | 1207 | 1 | 1 | 0.08% | 0.08% | 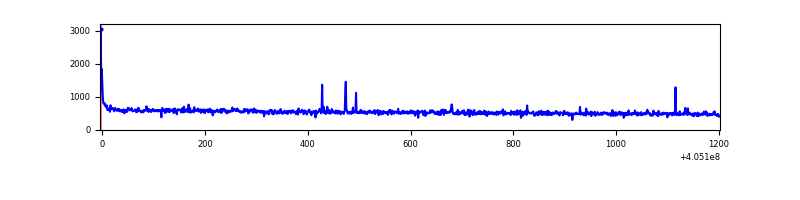 |
| D | 1207 | 1207 | 43 | 43 | 3.56% | 3.56% | 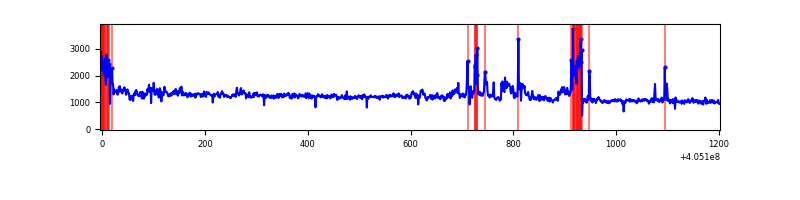 |
Top three noisy pixels from each quadrant. If the there are fewer than three noisy pixels in the level2.evt file, extra rows are filled as -1
| Pixel properties | Quadrant properties | ||||||
|---|---|---|---|---|---|---|---|
| Quadrant | DetID | PixID | Counts | Sigma | Mean | Median | Sigma |
| A | 10 | 83 | 135714 | 4135.85 | 156 | 154 | 32.8 |
| A | 9 | 143 | 58156 | 1769.61 | 156 | 154 | 32.8 |
| A | 13 | 6 | 6861 | 204.63 | 156 | 154 | 32.8 |
| B | 0 | 199 | 12993 | 406.83 | 157 | 153 | 31.6 |
| B | 0 | 155 | 8768 | 272.97 | 157 | 153 | 31.6 |
| B | 0 | 230 | 8741 | 272.11 | 157 | 153 | 31.6 |
| C | 15 | 214 | 55536 | 1542.02 | 148 | 149 | 35.9 |
| C | 0 | 10 | 10205 | 279.97 | 148 | 149 | 35.9 |
| C | 14 | 254 | 6905 | 188.09 | 148 | 149 | 35.9 |
| D | 10 | 203 | 777890 | 21043.84 | 145 | 140 | 37.0 |
| D | 12 | 235 | 94853 | 2562.68 | 145 | 140 | 37.0 |
| D | 12 | 227 | 55578 | 1500.0 | 145 | 140 | 37.0 |
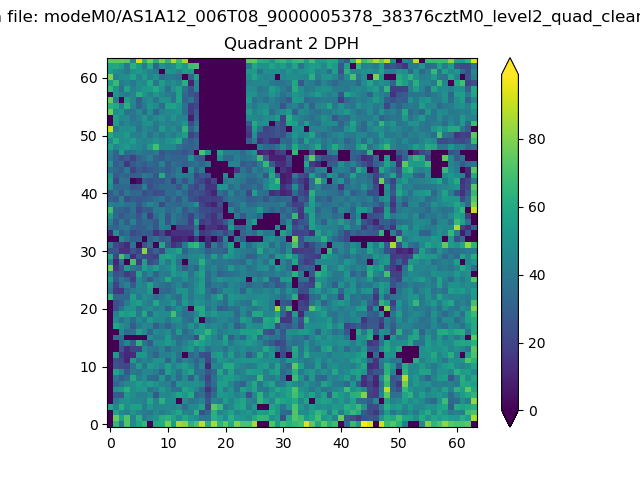
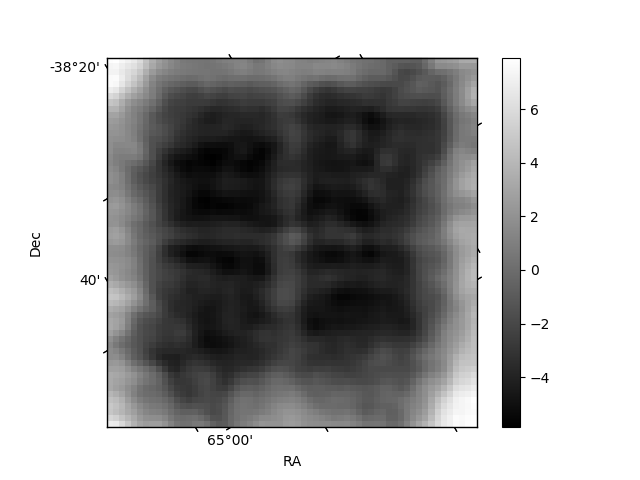
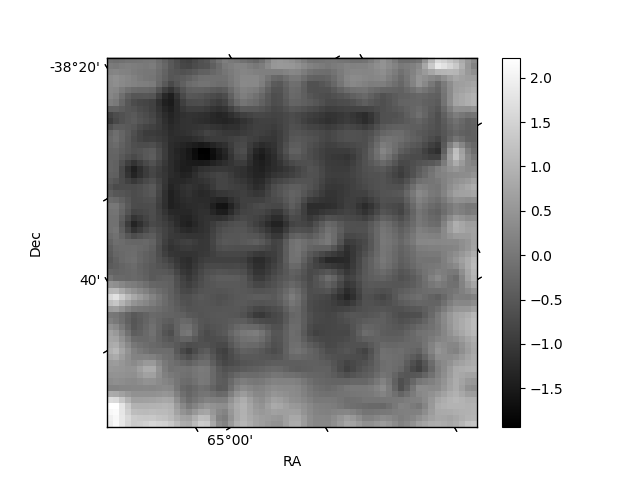
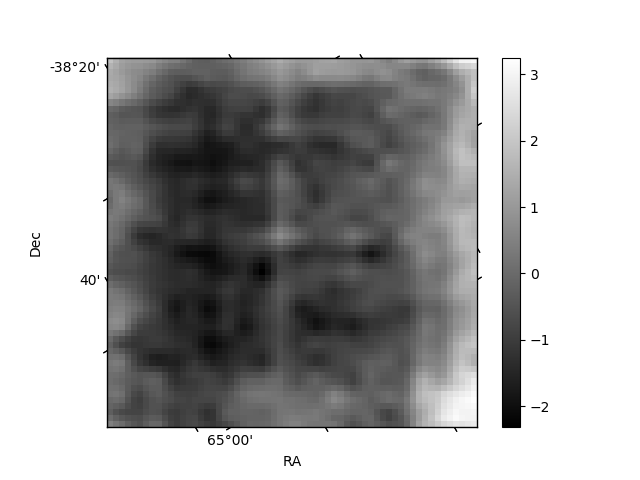
Histogram calculated using DETX and DETY for each event in the final _common_clean file
| Quadrant A | 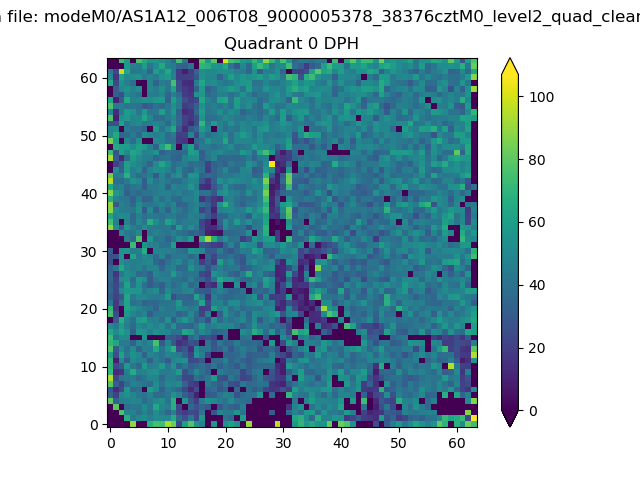 |
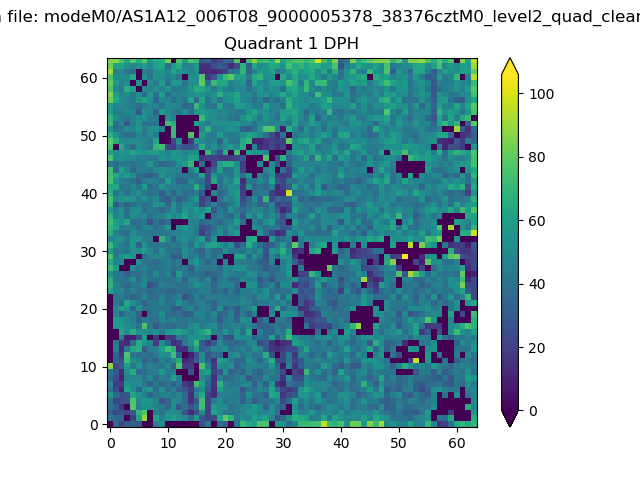 |
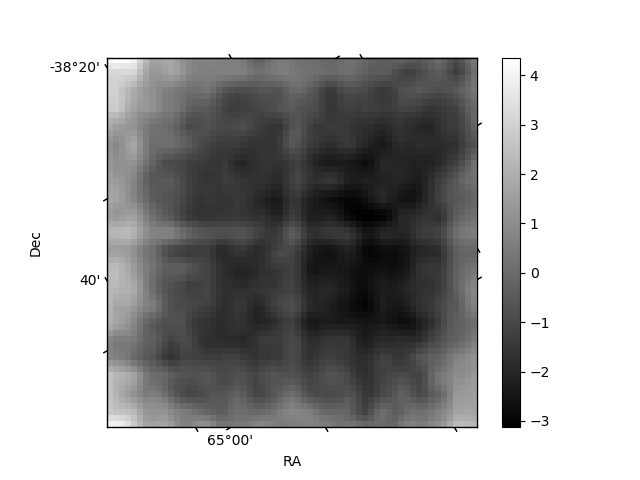
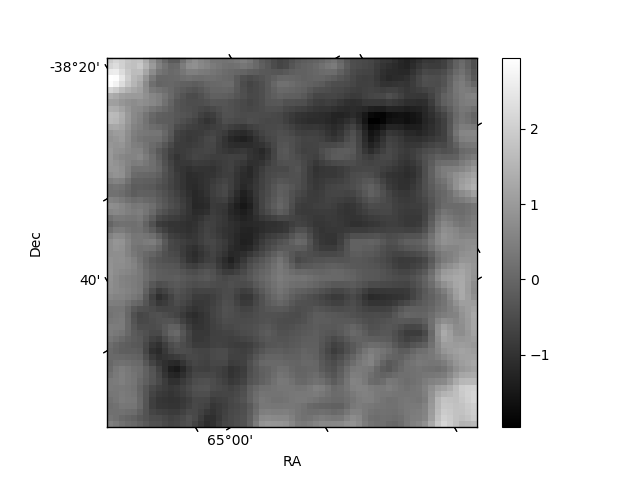
Quadrant B |
|---|---|---|---|
| Quadrant D | 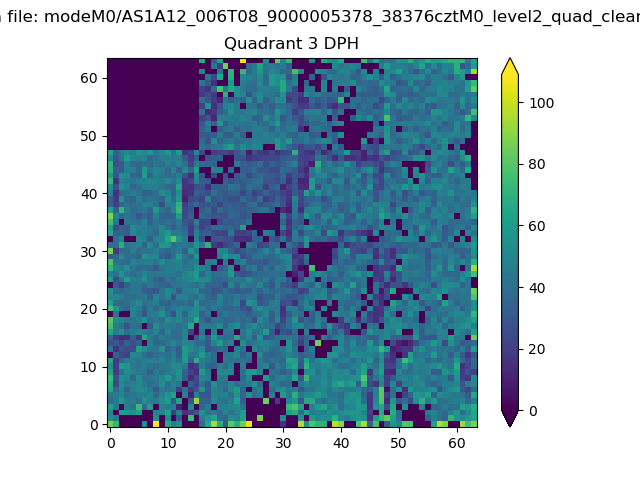 |
 |
Quadrant C |
| Plot type | Count rate plots | Images |
|---|---|---|
| Comparison with Poisson distribution Blue bars denote a histogram of data divided into 1 sec bins. Red curve is a Poisson curve with rate = median count rate of data. |
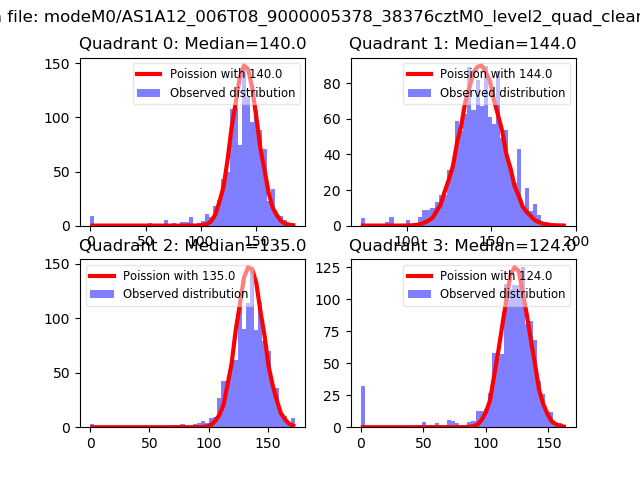 |
 |
| Quadrant-wise count rates Data is divided into 100 sec bins |
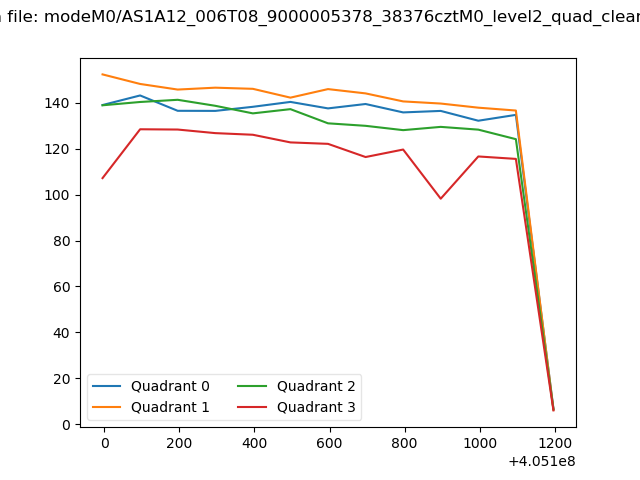 |
|
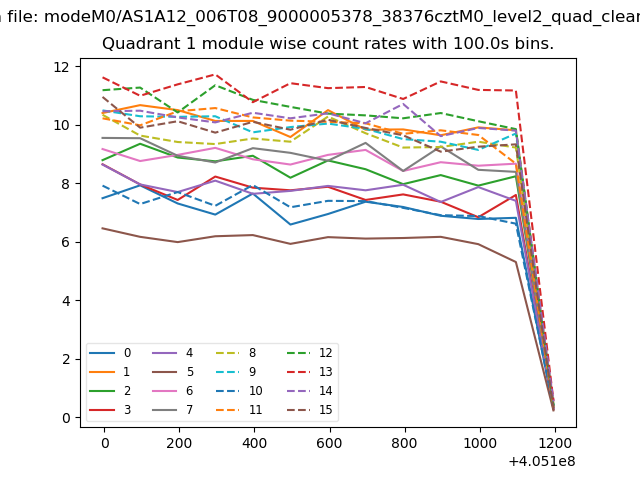
| Module-wise count rates for Quadrant A Data is divided into 100 sec bins |
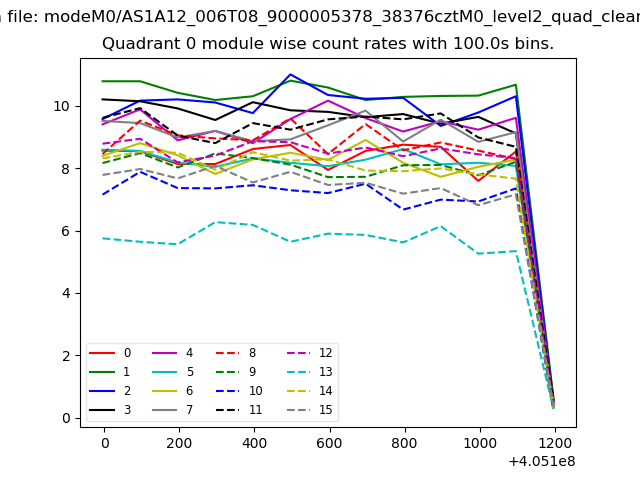 |
 |
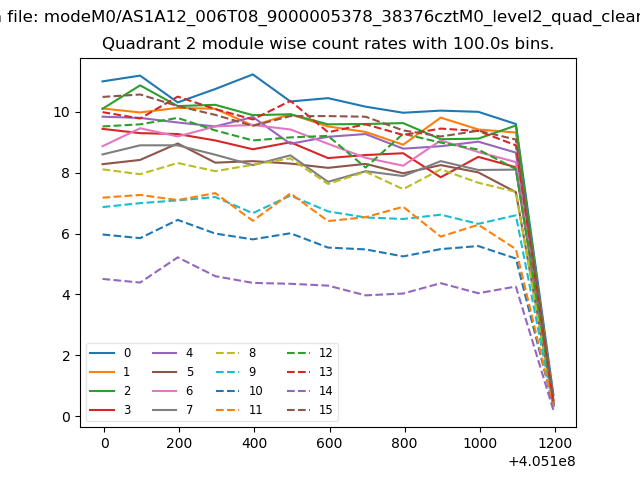
| Module-wise count rates for Quadrant B Data is divided into 100 sec bins |
 |
 |
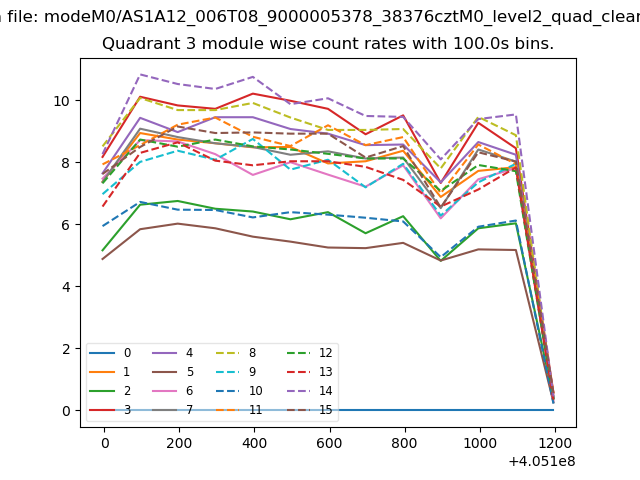
| Module-wise count rates for Quadrant C Data is divided into 100 sec bins |
 |
 |
| Module-wise count rates for Quadrant D Data is divided into 100 sec bins |
 |
 |
| Parameter | Plot |
|---|---|
| CZT HV Monitor | 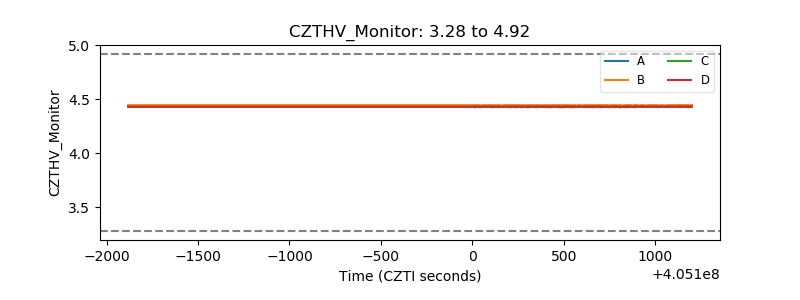 |
| D_VDD | 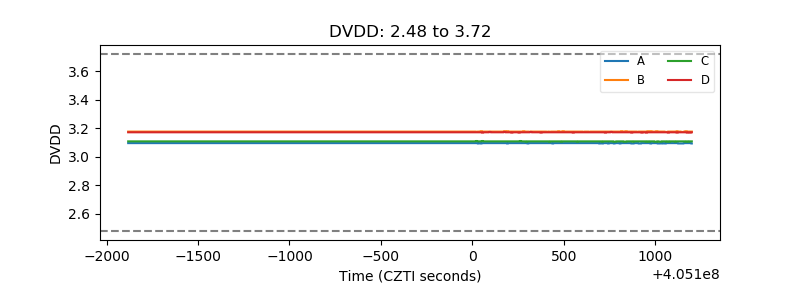 |
| Temperature 1 | 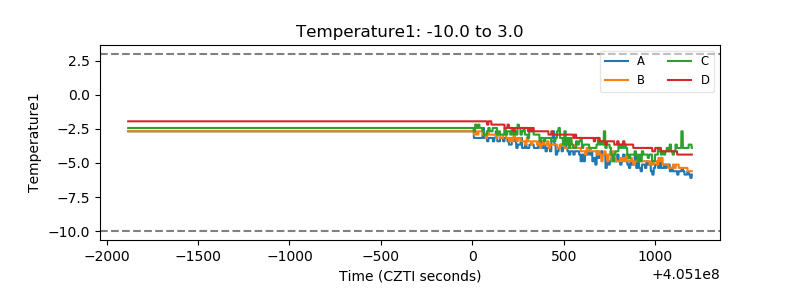 |
| Veto HV Monitor | 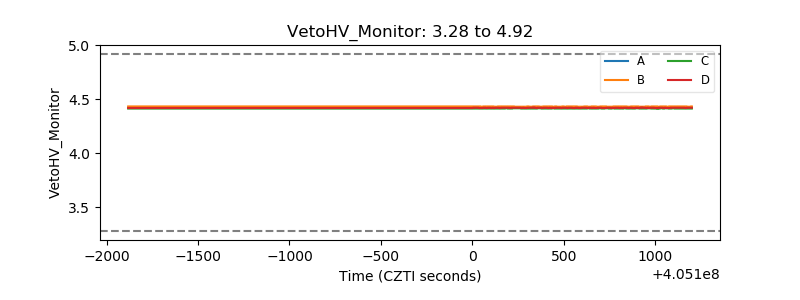 |
| Veto LLD | 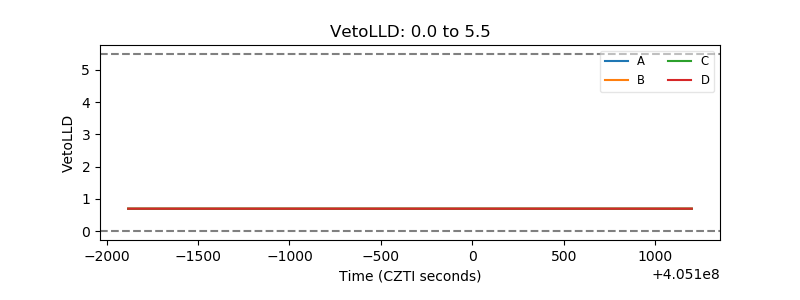 |
| Alpha Counter | 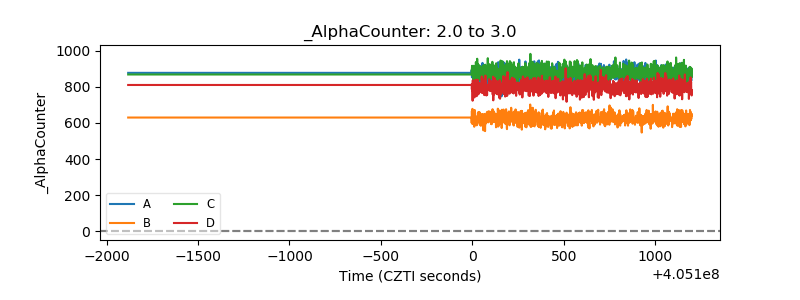 |
| _CPM_Rate | 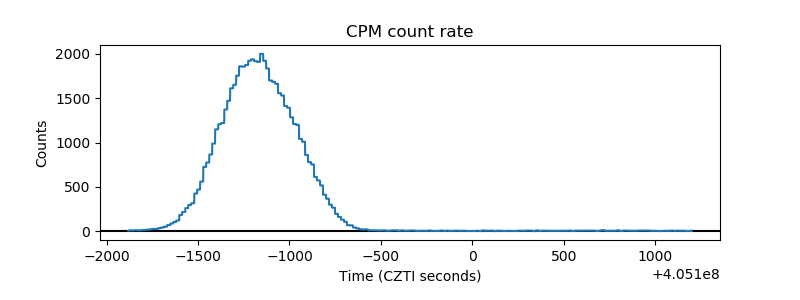 |
| CZT Counter | 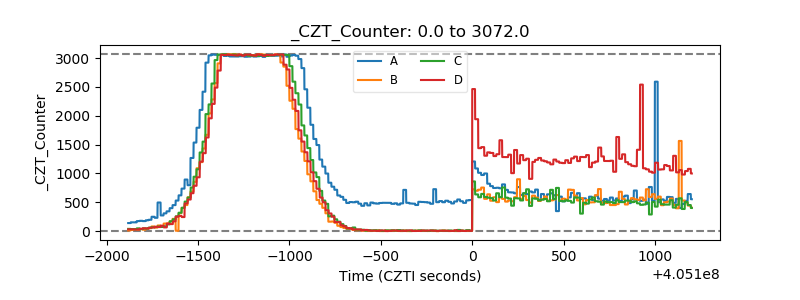 |
| +2.5 Volts monitor | 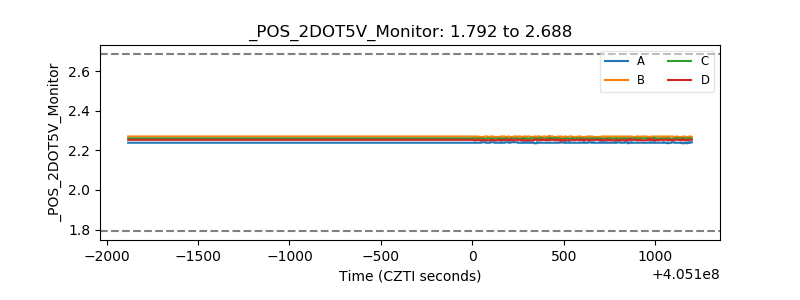 |
| +5 Volts monitor | 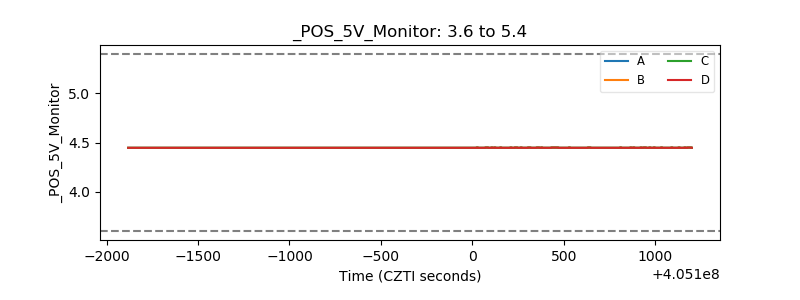 |
| _ROLL_ROT | 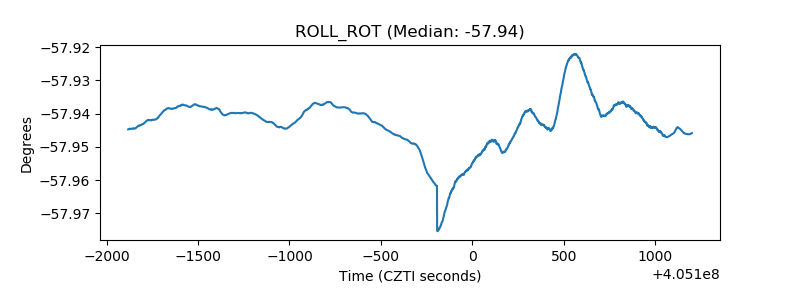 |
| _Roll_DEC | 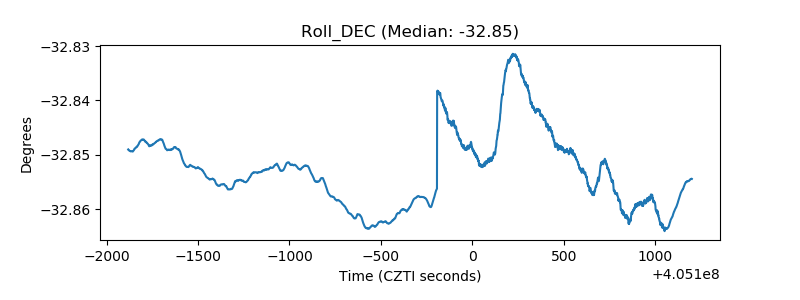 |
| _Roll_RA | 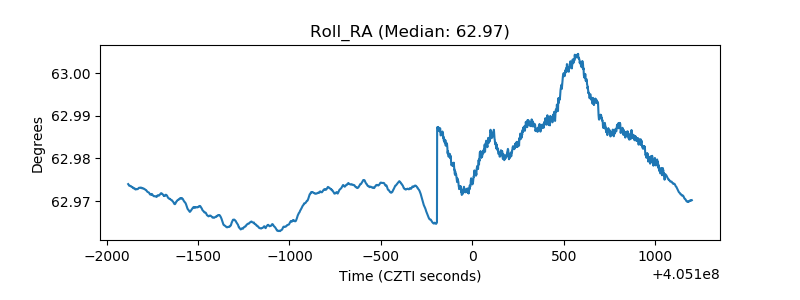 |
| Veto Counter | 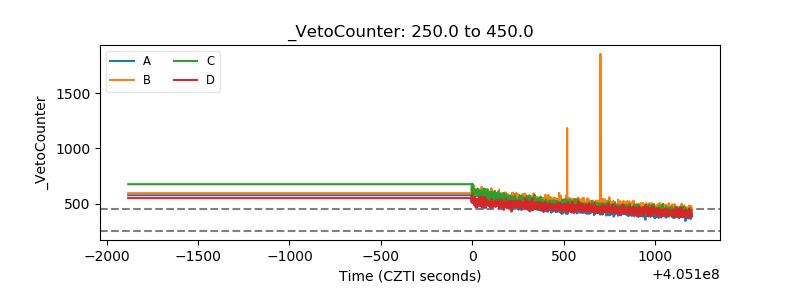 |