| Param | Original file | Final file |
|---|---|---|
| Filename | modeM0/AS1A12_025T09_9000005382_38391cztM0_level2.fits | modeM0/AS1A12_025T09_9000005382_38391cztM0_level2_quad_clean.evt |
| Size (bytes) | 194,169,600 | 40,812,480 |
| Size | 185.2 MB | 38.9 MB |
| Events in quadrant A | 1,282,715 | 284,228 |
| Events in quadrant B | 1,409,792 | 287,479 |
| Events in quadrant C | 1,159,328 | 272,838 |
| Events in quadrant D | 3,153,618 | 224,369 |
| Mode M9 | |||
|---|---|---|---|
| Quadrant | BADHDUFLAG | Total packets | Discarded packets |
| A | 0 | 21 | 0 |
| B | 0 | 21 | 0 |
| C | 0 | 21 | 0 |
| D | 0 | 21 | 0 |
| Mode M0 | |||
|---|---|---|---|
| Quadrant | BADHDUFLAG | Total packets | Discarded packets |
| A | 0 | 5198 | 2 |
| B | 0 | 5661 | 1 |
| C | 0 | 4761 | 1 |
| D | 0 | 10841 | 1 |
| Mode SS | |||
|---|---|---|---|
| Quadrant | BADHDUFLAG | Total packets | Discarded packets |
| A | 0 | 48 | 0 |
| B | 0 | 48 | 0 |
| C | 0 | 48 | 0 |
| D | 0 | 48 | 0 |
| Quadrant | Total seconds | Saturated seconds | Saturation percentage |
|---|---|---|---|
| A | 2317 | 16 | 0.690548% |
| B | 2317 | 57 | 2.460078% |
| C | 2317 | 7 | 0.302115% |
| D | 2317 | 343 | 14.803625% |
Noise dominated data is calculated using 1-second bins in cleaned event files. If a bin has >2000 counts, and if more than 50% of those come from <1% of pixels, then it is considered to be noise-dominated and hence unusable.
| Quadrant | # 1 sec bins | Bins with >0 counts | Bins with >2000 counts | High rate bins dominated by noise | Noise dominated (total time) | Noise dominated (detector-on time) | Marked lightcurve |
|---|---|---|---|---|---|---|---|
| A | 4440 | 2318 | 4 | 4 | 0.09% | 0.17% | 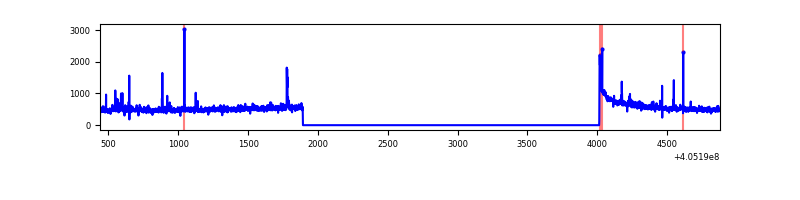 |
| B | 4440 | 2318 | 21 | 21 | 0.47% | 0.91% | 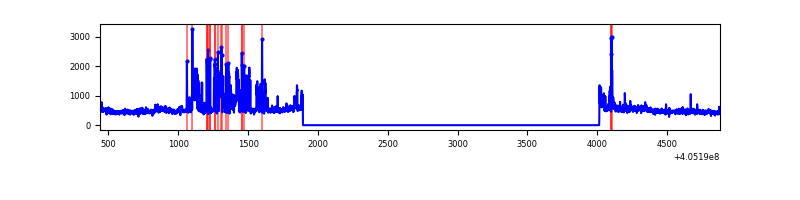 |
| C | 4440 | 2318 | 5 | 5 | 0.11% | 0.22% | 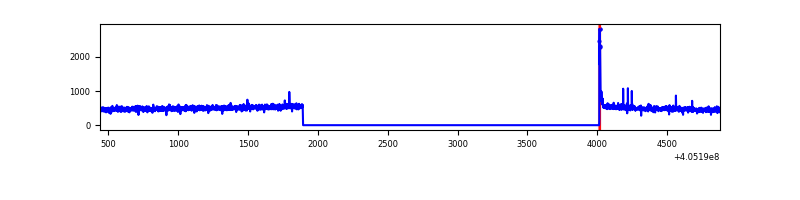 |
| D | 4440 | 2318 | 413 | 413 | 9.30% | 17.82% | 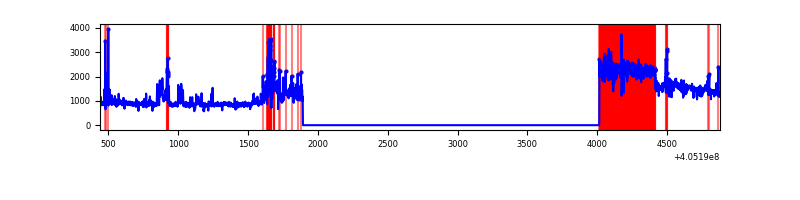 |
Top three noisy pixels from each quadrant. If the there are fewer than three noisy pixels in the level2.evt file, extra rows are filled as -1
| Pixel properties | Quadrant properties | ||||||
|---|---|---|---|---|---|---|---|
| Quadrant | DetID | PixID | Counts | Sigma | Mean | Median | Sigma |
| A | 10 | 83 | 179963 | 3238.58 | 269 | 265 | 55.5 |
| A | 9 | 143 | 34169 | 611.03 | 269 | 265 | 55.5 |
| A | 12 | 16 | 11489 | 202.28 | 269 | 265 | 55.5 |
| B | 4 | 21 | 235184 | 4495.9 | 267 | 260 | 52.3 |
| B | 0 | 183 | 68110 | 1298.49 | 267 | 260 | 52.3 |
| B | 4 | 171 | 17949 | 338.53 | 267 | 260 | 52.3 |
| C | 15 | 214 | 100038 | 1590.59 | 264 | 265 | 62.7 |
| C | 0 | 10 | 21207 | 333.86 | 264 | 265 | 62.7 |
| C | 14 | 254 | 5127 | 77.51 | 264 | 265 | 62.7 |
| D | 10 | 203 | 1331614 | 21068.53 | 253 | 246 | 63.2 |
| D | 1 | 20 | 412035 | 6516.45 | 253 | 246 | 63.2 |
| D | 2 | 16 | 321591 | 5085.2 | 253 | 246 | 63.2 |
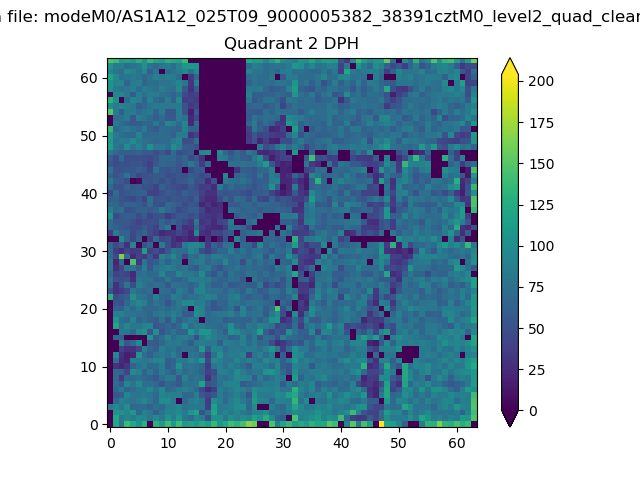
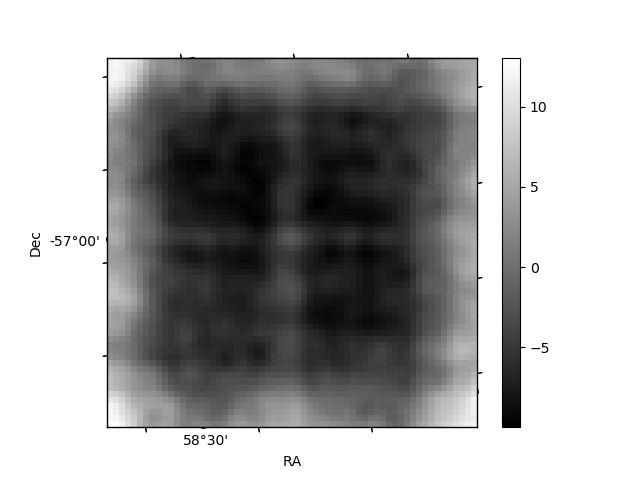
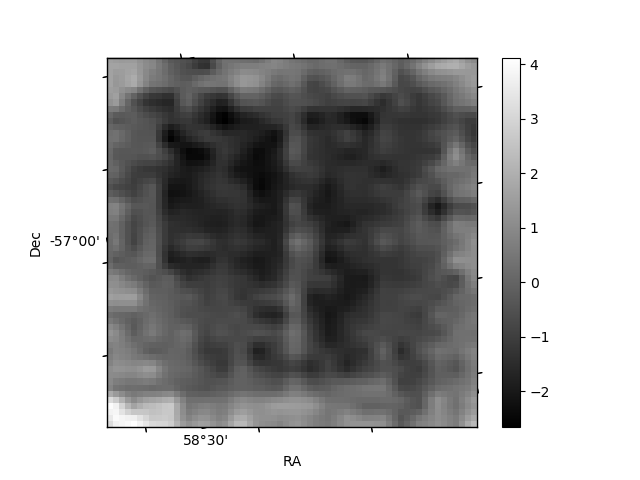
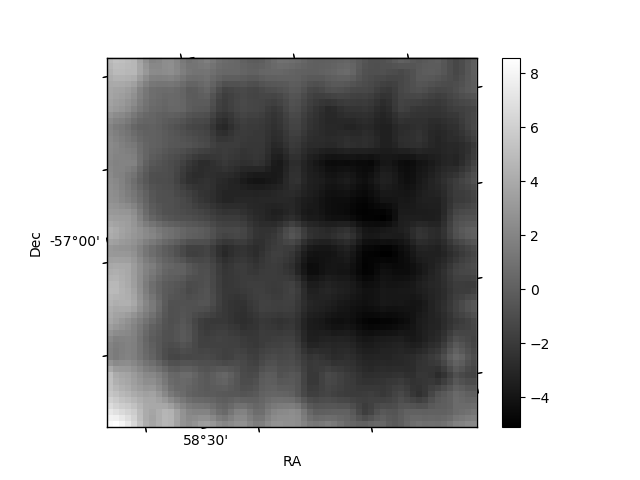
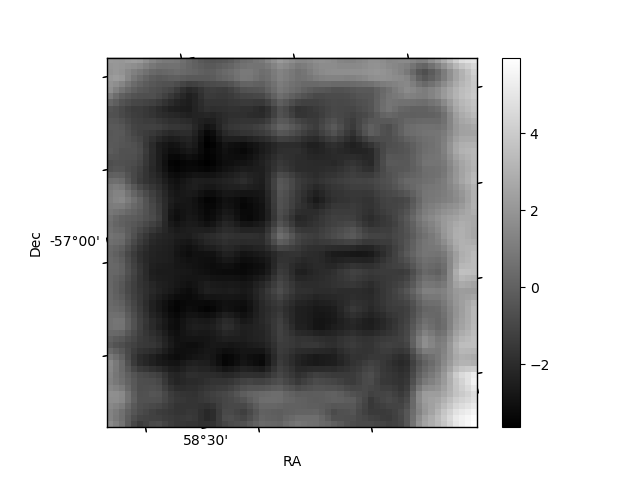
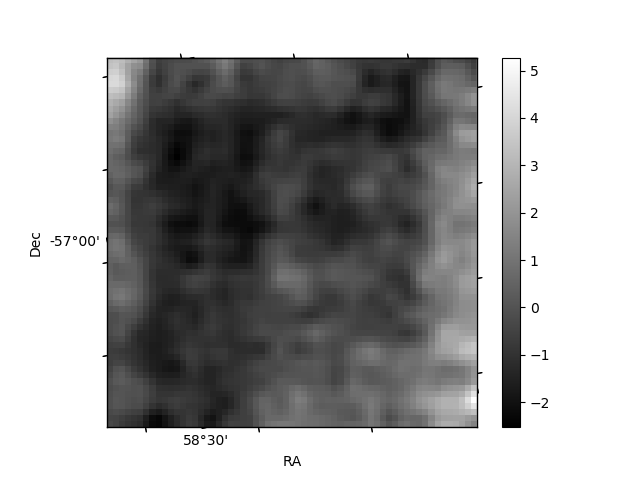
Histogram calculated using DETX and DETY for each event in the final _common_clean file
| Quadrant A | 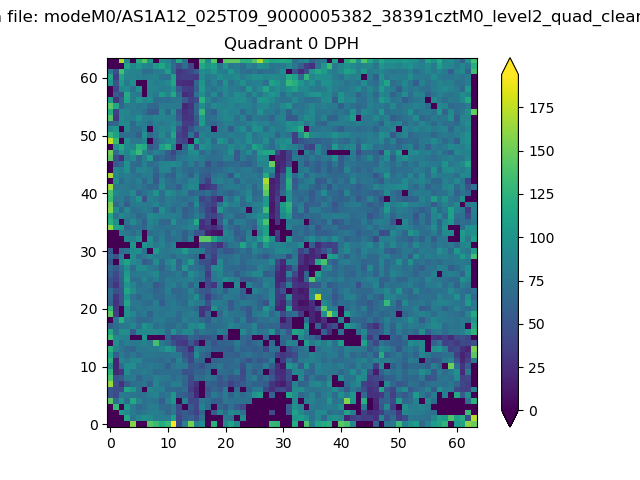 |
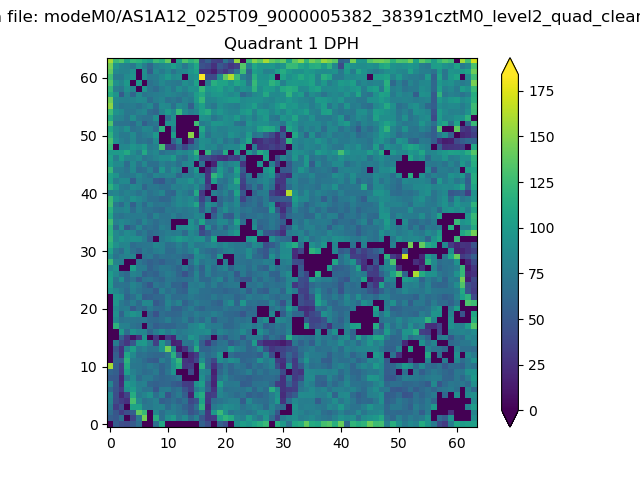 |
Quadrant B |
|---|---|---|---|
| Quadrant D | 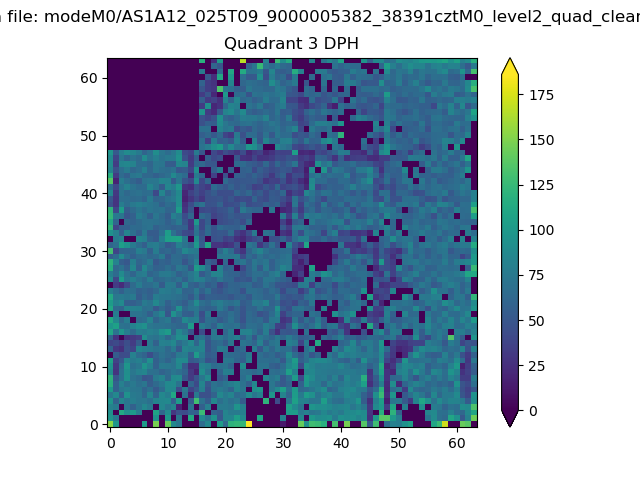 |
 |
Quadrant C |
| Plot type | Count rate plots | Images |
|---|---|---|
| Comparison with Poisson distribution Blue bars denote a histogram of data divided into 1 sec bins. Red curve is a Poisson curve with rate = median count rate of data. |
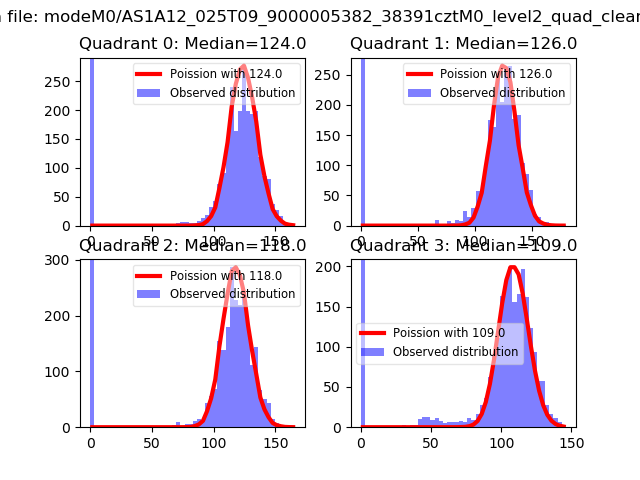 |
 |
| Quadrant-wise count rates Data is divided into 100 sec bins |
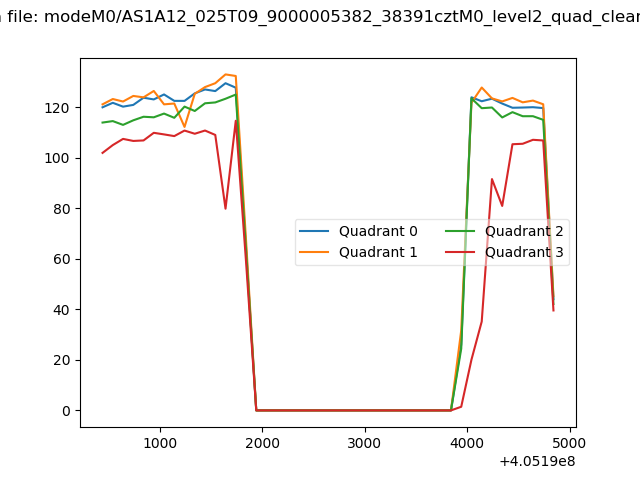 |
|
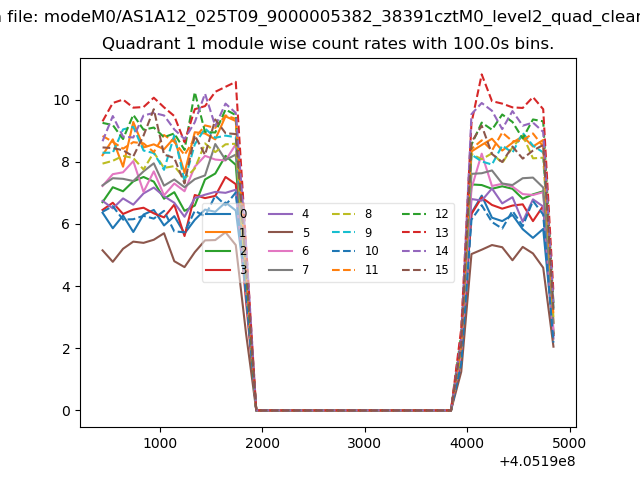
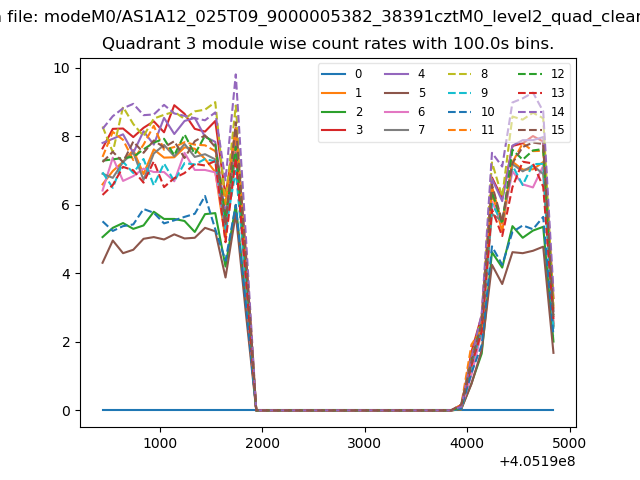
| Module-wise count rates for Quadrant A Data is divided into 100 sec bins |
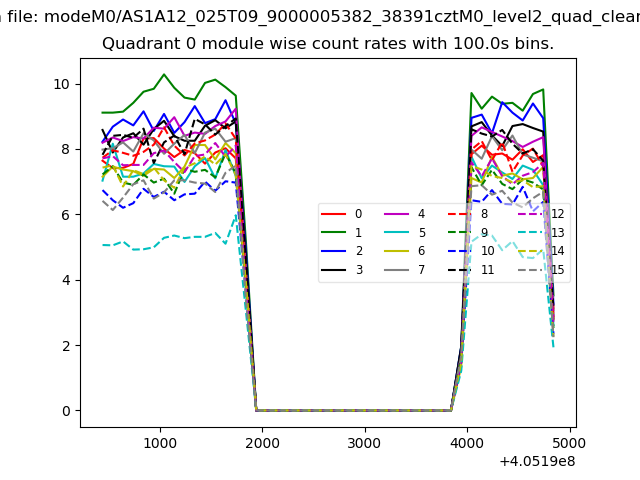 |
 |
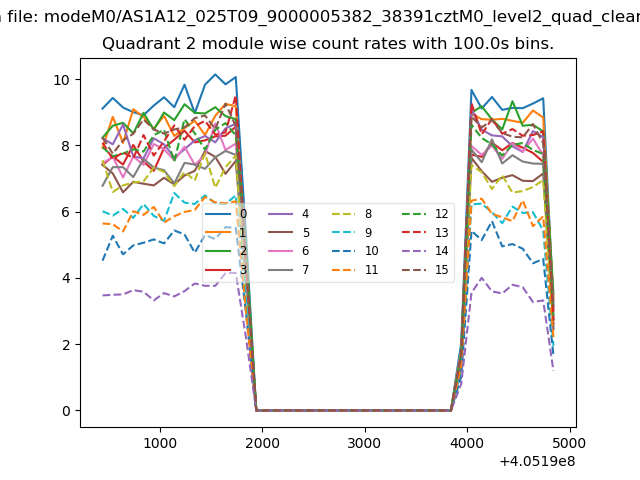
| Module-wise count rates for Quadrant B Data is divided into 100 sec bins |
 |
 |
| Module-wise count rates for Quadrant C Data is divided into 100 sec bins |
 |
 |
| Module-wise count rates for Quadrant D Data is divided into 100 sec bins |
 |
 |
| Parameter | Plot |
|---|---|
| CZT HV Monitor | 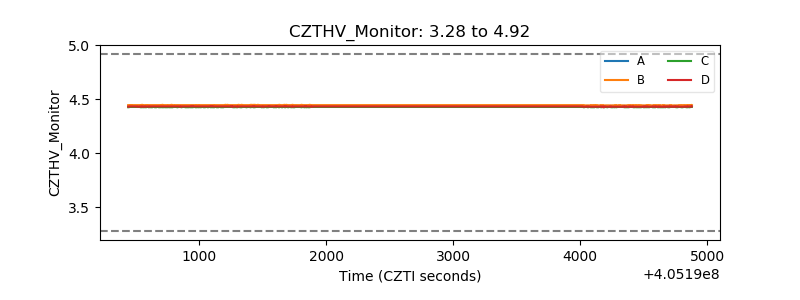 |
| D_VDD | 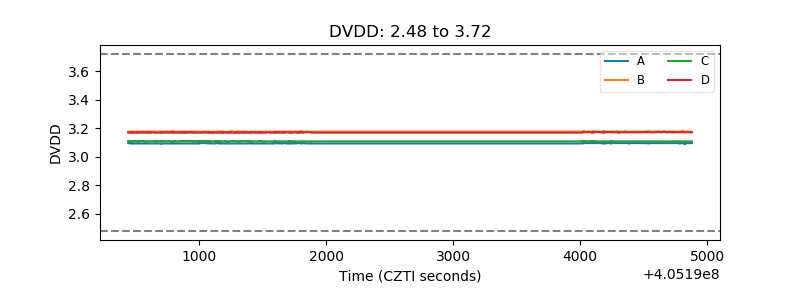 |
| Temperature 1 | 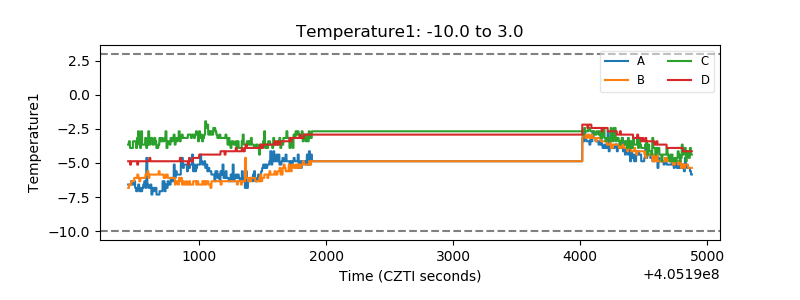 |
| Veto HV Monitor | 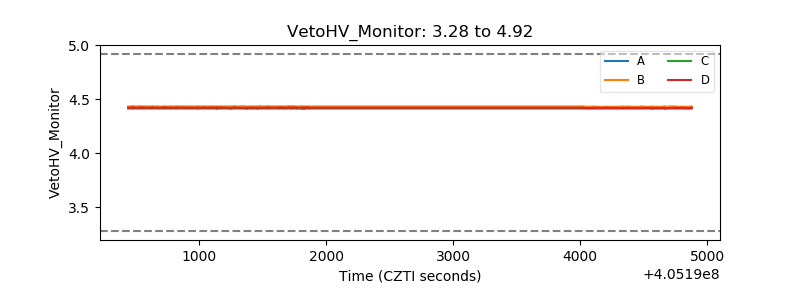 |
| Veto LLD | 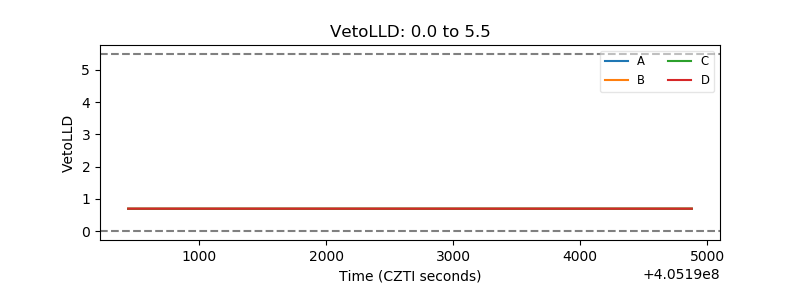 |
| Alpha Counter | 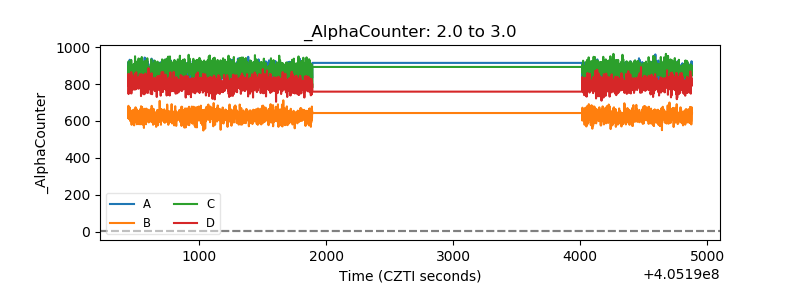 |
| _CPM_Rate | 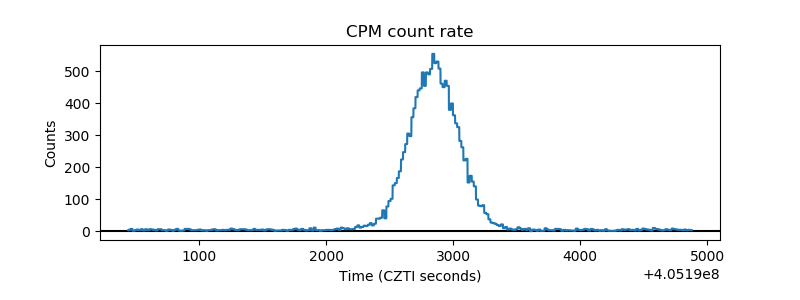 |
| CZT Counter | 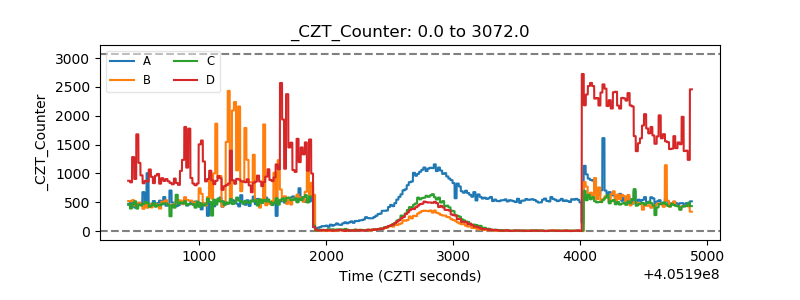 |
| +2.5 Volts monitor | 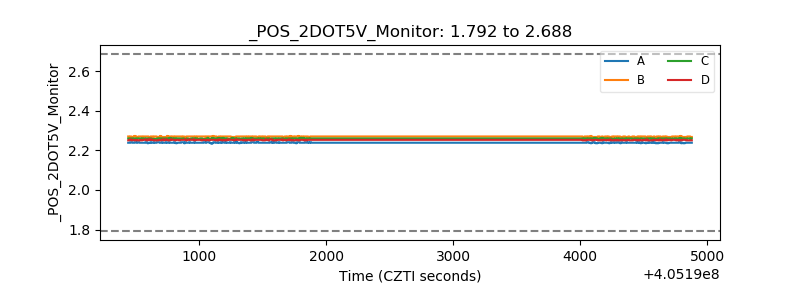 |
| +5 Volts monitor | 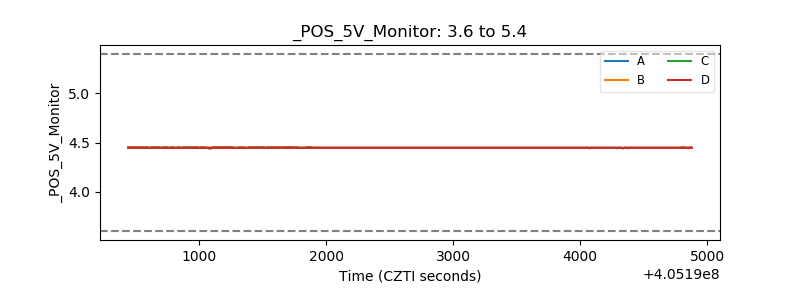 |
| _ROLL_ROT | 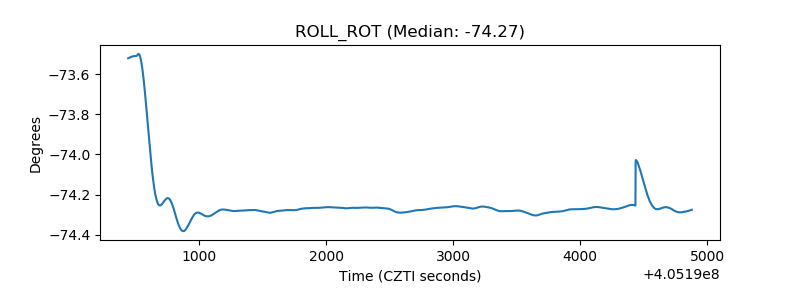 |
| _Roll_DEC | 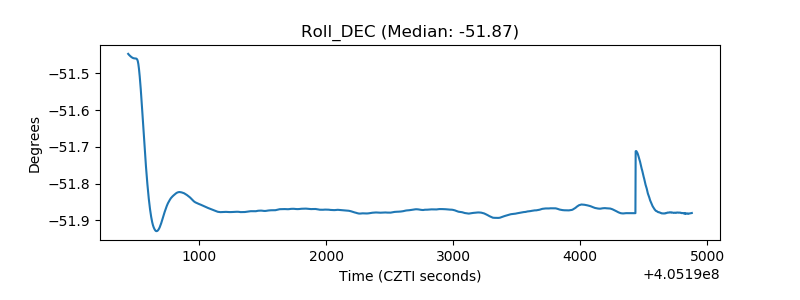 |
| _Roll_RA | 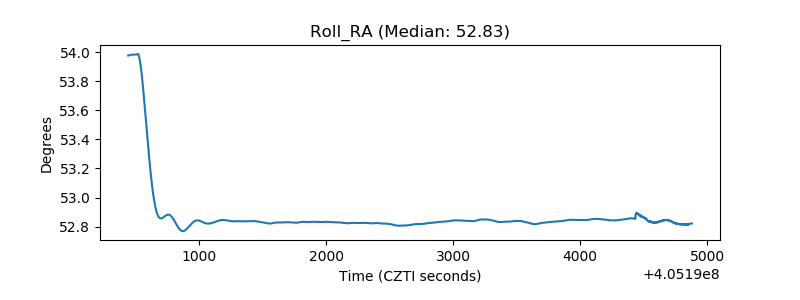 |
| Veto Counter | 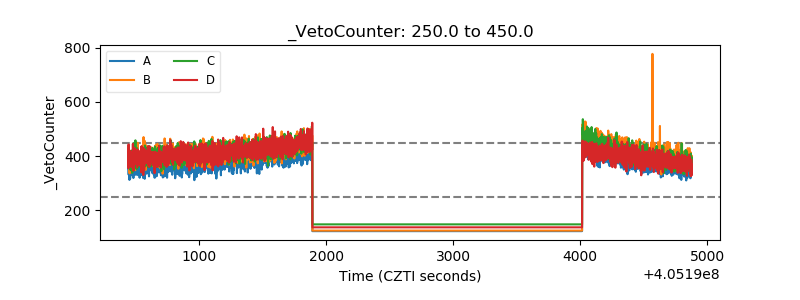 |