| Param | Original file | Final file |
|---|---|---|
| Filename | modeM0/AS1A12_025T09_9000005382_38392cztM0_level2.fits | modeM0/AS1A12_025T09_9000005382_38392cztM0_level2_quad_clean.evt |
| Size (bytes) | 427,968,000 | 85,930,560 |
| Size | 408.1 MB | 81.9 MB |
| Events in quadrant A | 2,767,088 | 597,911 |
| Events in quadrant B | 2,855,739 | 610,226 |
| Events in quadrant C | 2,830,044 | 565,829 |
| Events in quadrant D | 6,993,012 | 470,382 |
| Mode M9 | |||
|---|---|---|---|
| Quadrant | BADHDUFLAG | Total packets | Discarded packets |
| A | 0 | 32 | 0 |
| B | 0 | 32 | 0 |
| C | 0 | 32 | 0 |
| D | 0 | 33 | 0 |
| Mode M0 | |||
|---|---|---|---|
| Quadrant | BADHDUFLAG | Total packets | Discarded packets |
| A | 0 | 11384 | 3 |
| B | 0 | 11968 | 2 |
| C | 0 | 11609 | 2 |
| D | 0 | 24191 | 2 |
| Mode SS | |||
|---|---|---|---|
| Quadrant | BADHDUFLAG | Total packets | Discarded packets |
| A | 0 | 104 | 0 |
| B | 0 | 104 | 0 |
| C | 0 | 104 | 0 |
| D | 0 | 104 | 0 |
| Quadrant | Total seconds | Saturated seconds | Saturation percentage |
|---|---|---|---|
| A | 5101 | 24 | 0.470496% |
| B | 5101 | 29 | 0.568516% |
| C | 5101 | 132 | 2.587728% |
| D | 5101 | 782 | 15.330327% |
Noise dominated data is calculated using 1-second bins in cleaned event files. If a bin has >2000 counts, and if more than 50% of those come from <1% of pixels, then it is considered to be noise-dominated and hence unusable.
| Quadrant | # 1 sec bins | Bins with >0 counts | Bins with >2000 counts | High rate bins dominated by noise | Noise dominated (total time) | Noise dominated (detector-on time) | Marked lightcurve |
|---|---|---|---|---|---|---|---|
| A | 7074 | 5102 | 16 | 16 | 0.23% | 0.31% | 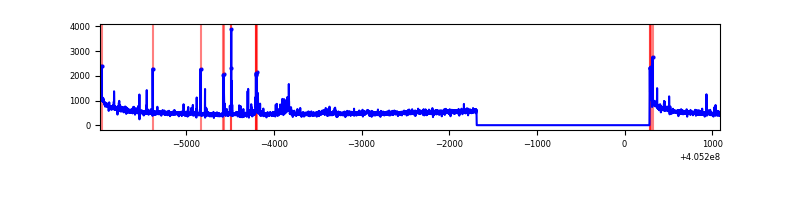 |
| B | 7074 | 5102 | 12 | 12 | 0.17% | 0.24% | 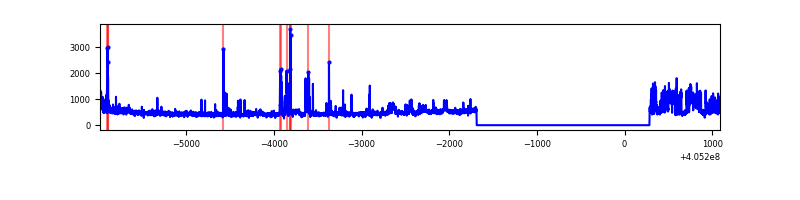 |
| C | 7074 | 5102 | 119 | 119 | 1.68% | 2.33% | 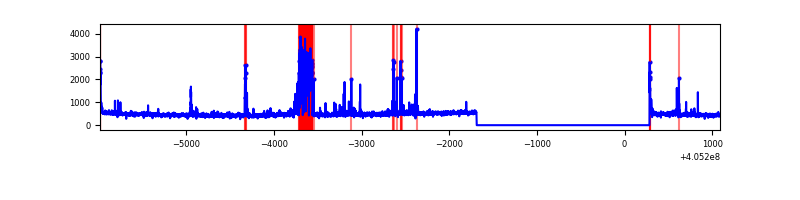 |
| D | 7074 | 5102 | 929 | 929 | 13.13% | 18.21% | 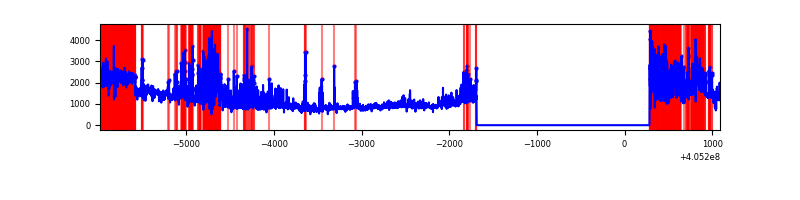 |
Top three noisy pixels from each quadrant. If the there are fewer than three noisy pixels in the level2.evt file, extra rows are filled as -1
| Pixel properties | Quadrant properties | ||||||
|---|---|---|---|---|---|---|---|
| Quadrant | DetID | PixID | Counts | Sigma | Mean | Median | Sigma |
| A | 10 | 83 | 387336 | 3388.55 | 562 | 551 | 114.1 |
| A | 12 | 16 | 87460 | 761.39 | 562 | 551 | 114.1 |
| A | 9 | 143 | 39781 | 343.69 | 562 | 551 | 114.1 |
| B | 0 | 183 | 542452 | 5027.89 | 561 | 547 | 107.8 |
| B | 0 | 230 | 25779 | 234.11 | 561 | 547 | 107.8 |
| B | 0 | 155 | 15137 | 135.37 | 561 | 547 | 107.8 |
| C | 14 | 254 | 445572 | 3494.74 | 545 | 548 | 127.3 |
| C | 15 | 214 | 215944 | 1691.49 | 545 | 548 | 127.3 |
| C | 0 | 10 | 40160 | 311.07 | 545 | 548 | 127.3 |
| D | 10 | 203 | 2715645 | 21185.2 | 523 | 509 | 128.2 |
| D | 7 | 223 | 688077 | 5364.84 | 523 | 509 | 128.2 |
| D | 1 | 20 | 617000 | 4810.25 | 523 | 509 | 128.2 |
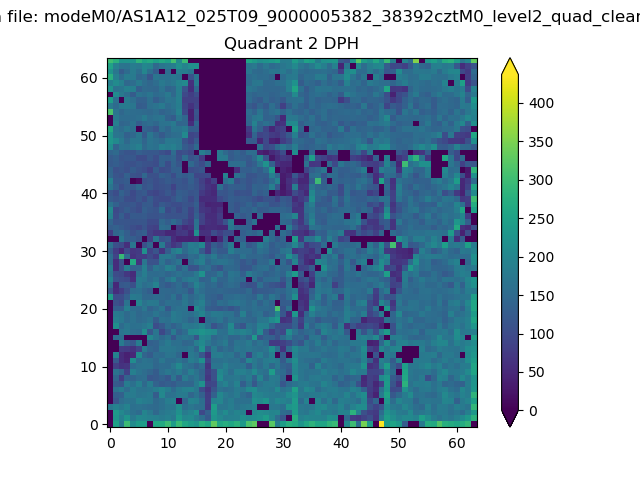
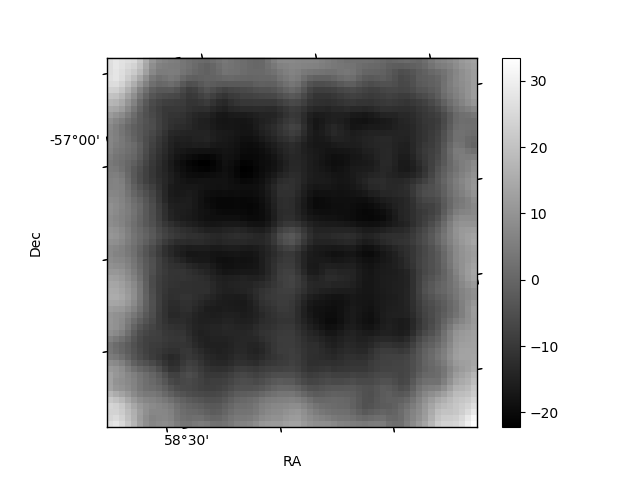
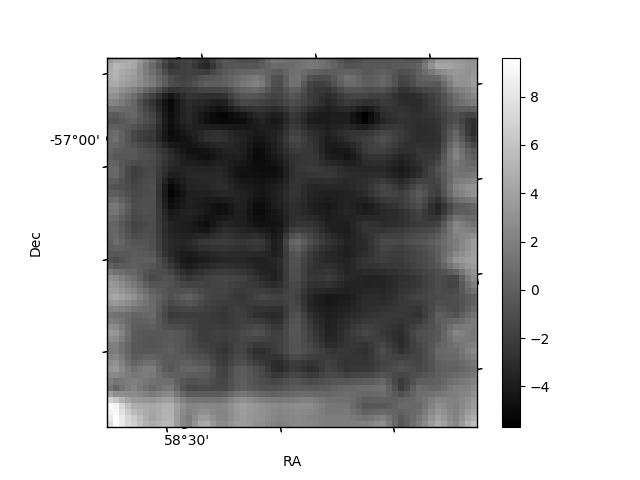
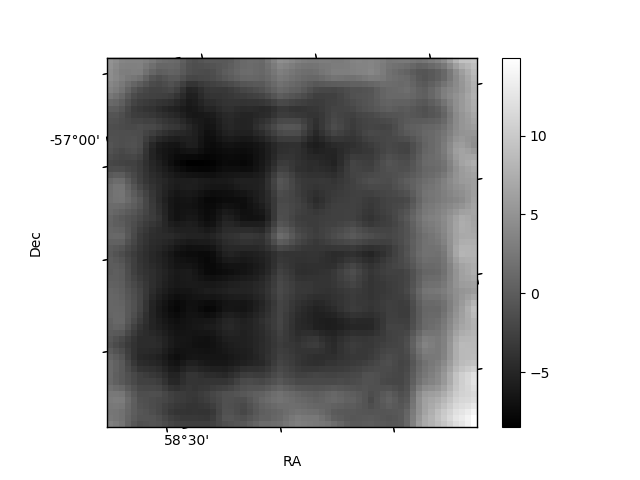
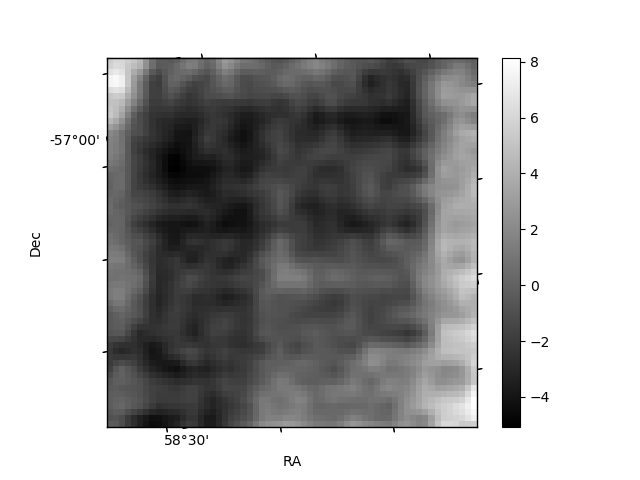
Histogram calculated using DETX and DETY for each event in the final _common_clean file
| Quadrant A | 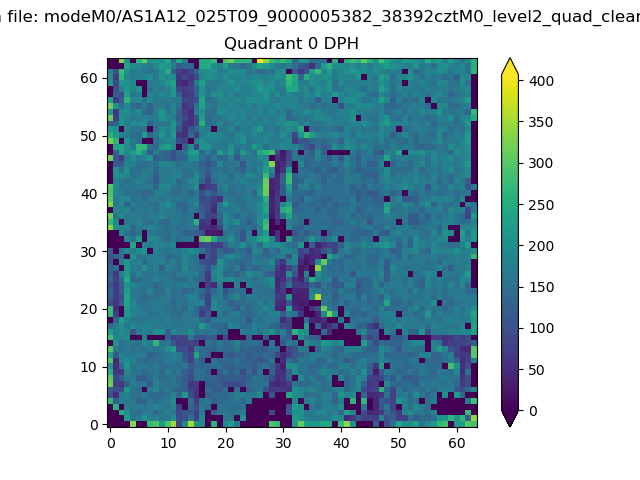 |
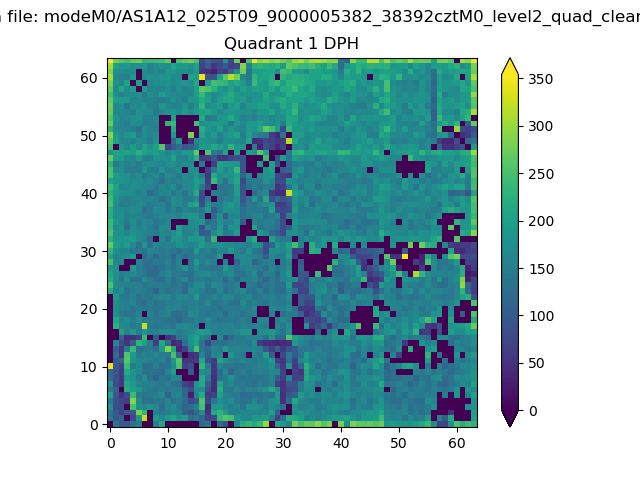 |
Quadrant B |
|---|---|---|---|
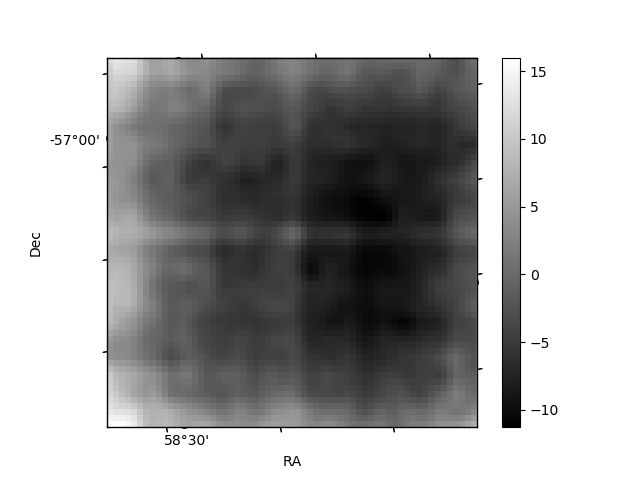
| Quadrant D | 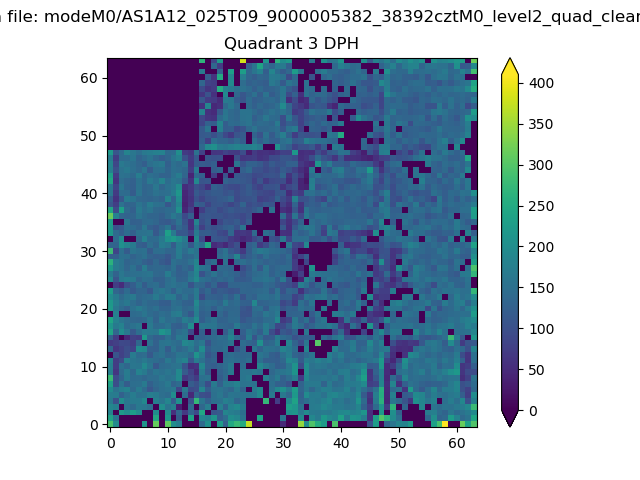 |
 |
Quadrant C |
| Plot type | Count rate plots | Images |
|---|---|---|
| Comparison with Poisson distribution Blue bars denote a histogram of data divided into 1 sec bins. Red curve is a Poisson curve with rate = median count rate of data. |
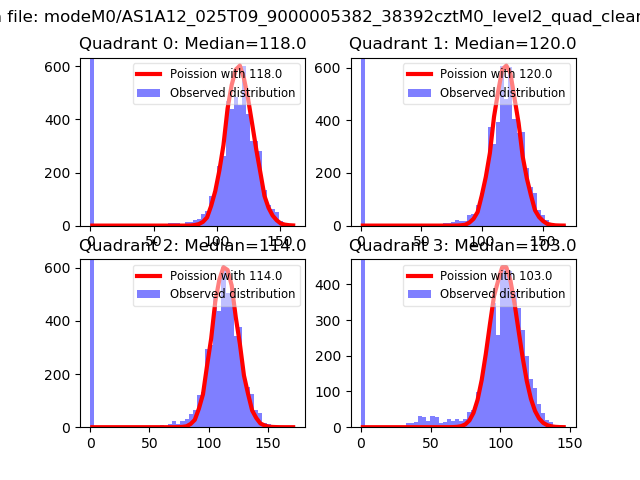 |
 |
| Quadrant-wise count rates Data is divided into 100 sec bins |
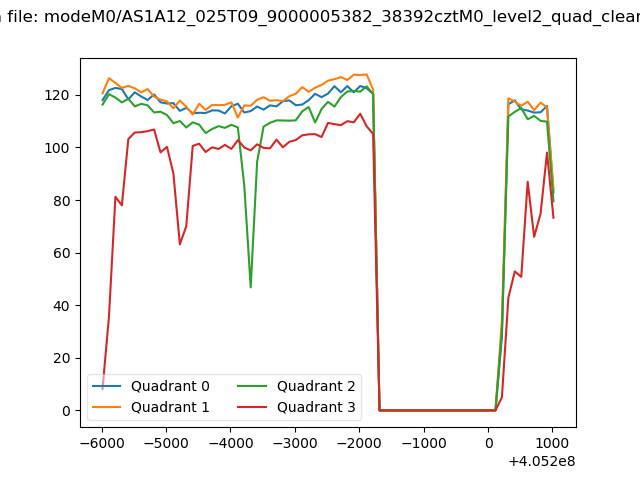 |
|
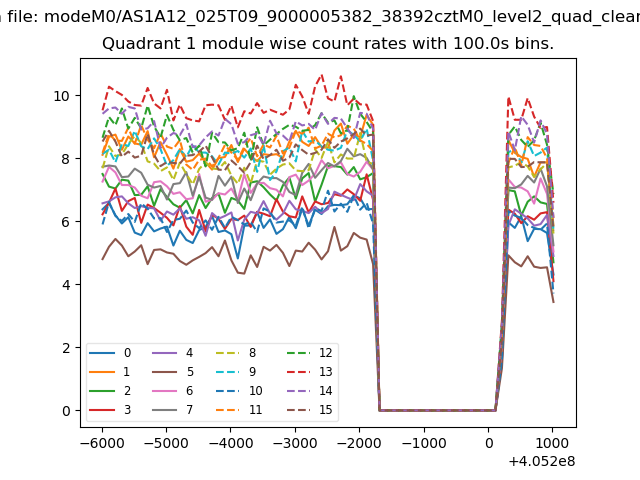
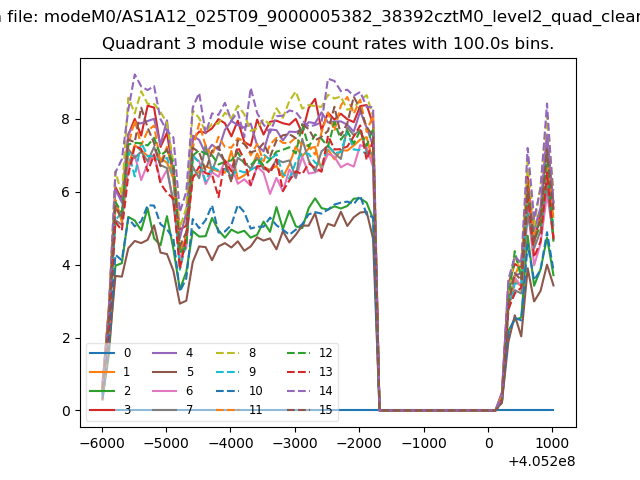
| Module-wise count rates for Quadrant A Data is divided into 100 sec bins |
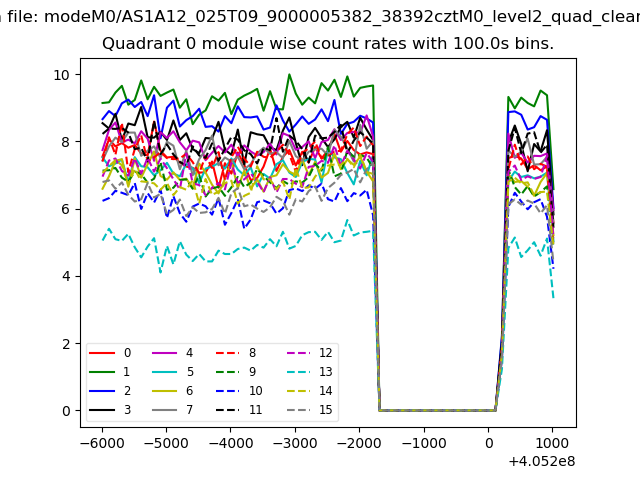 |
 |
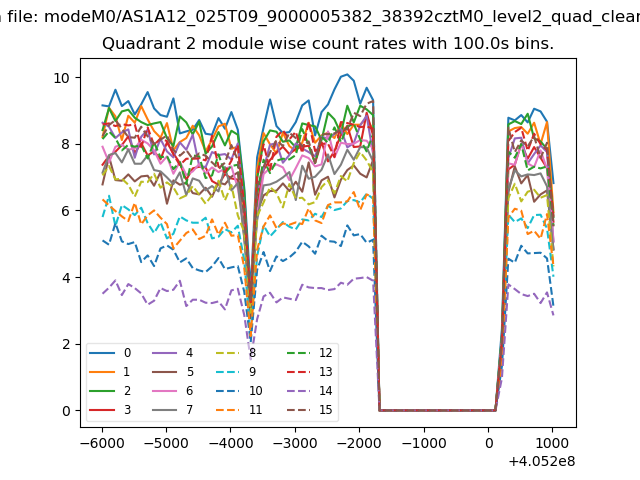
| Module-wise count rates for Quadrant B Data is divided into 100 sec bins |
 |
 |
| Module-wise count rates for Quadrant C Data is divided into 100 sec bins |
 |
 |
| Module-wise count rates for Quadrant D Data is divided into 100 sec bins |
 |
 |
| Parameter | Plot |
|---|---|
| CZT HV Monitor | 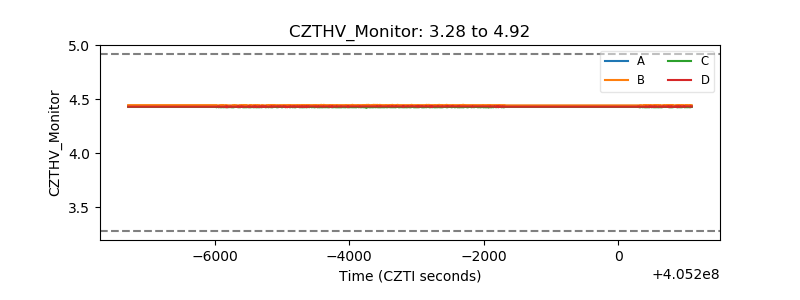 |
| D_VDD | 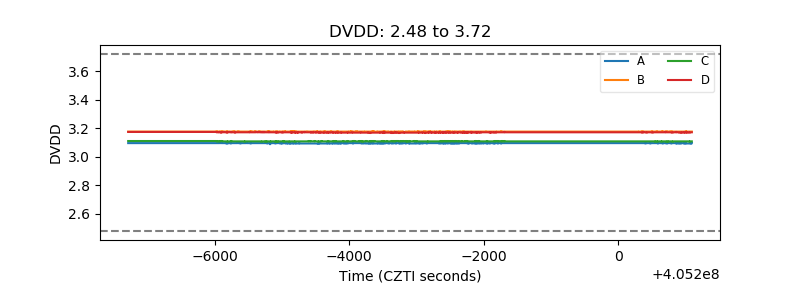 |
| Temperature 1 | 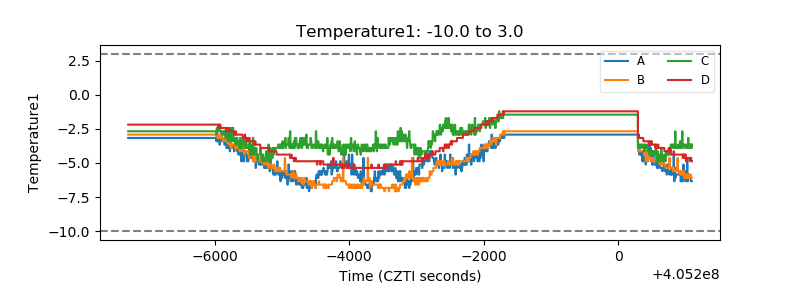 |
| Veto HV Monitor | 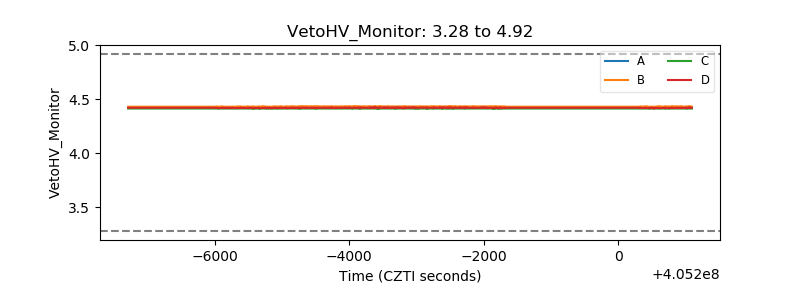 |
| Veto LLD | 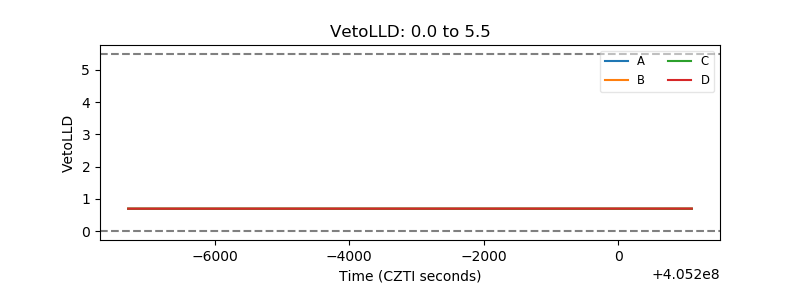 |
| Alpha Counter | 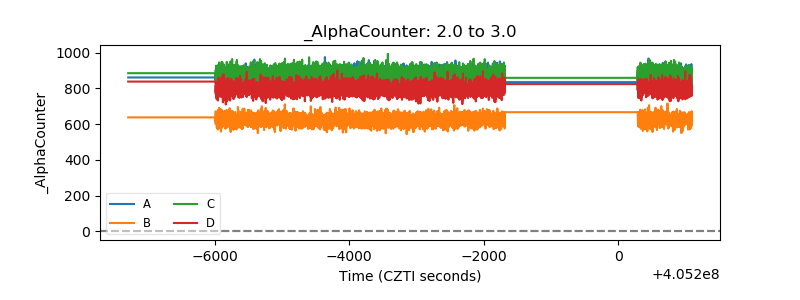 |
| _CPM_Rate | 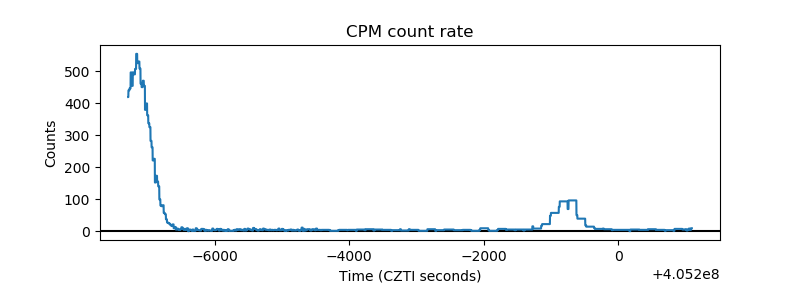 |
| CZT Counter | 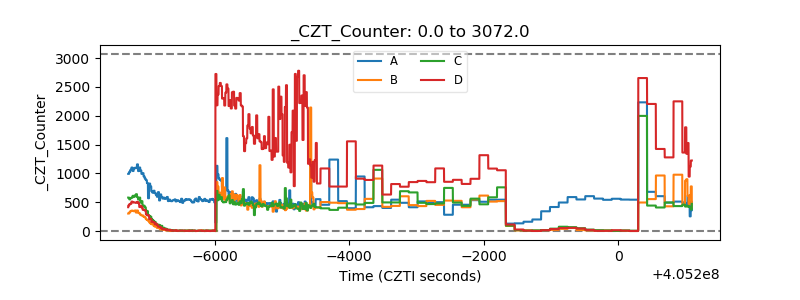 |
| +2.5 Volts monitor | 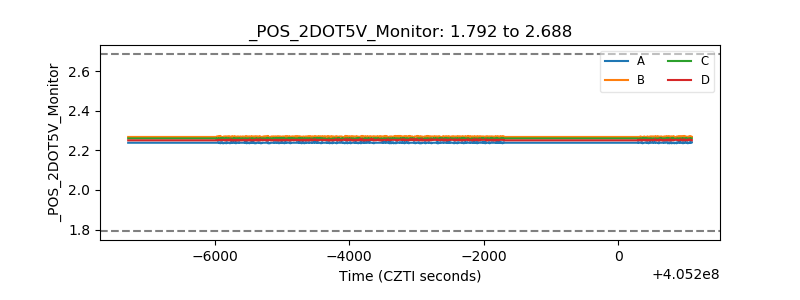 |
| +5 Volts monitor | 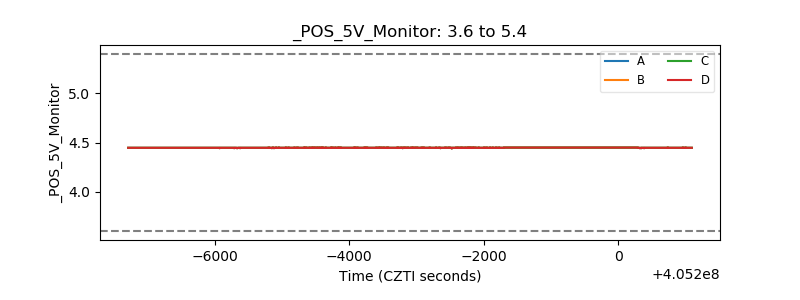 |
| _ROLL_ROT | 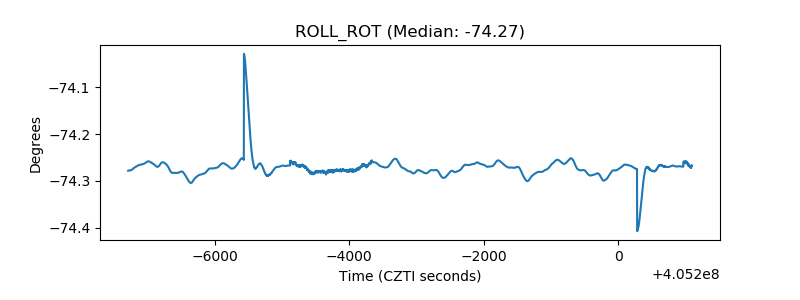 |
| _Roll_DEC | 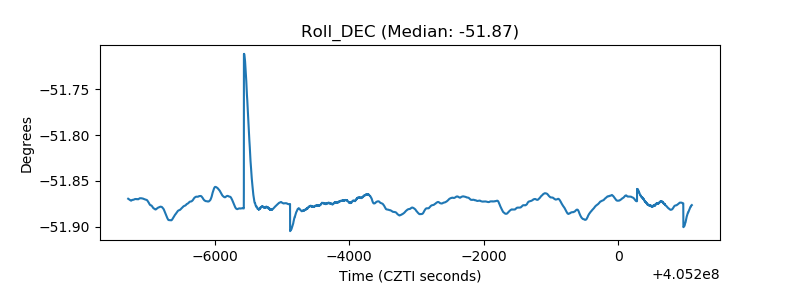 |
| _Roll_RA | 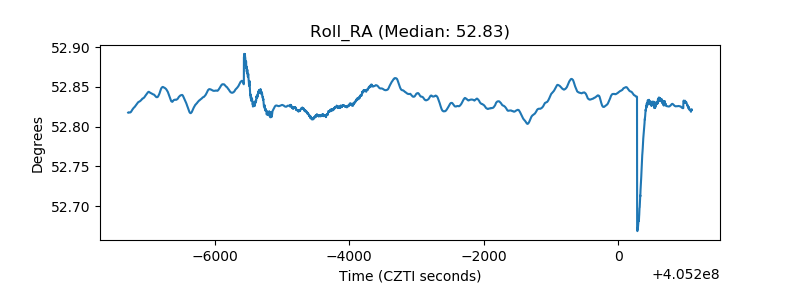 |
| Veto Counter | 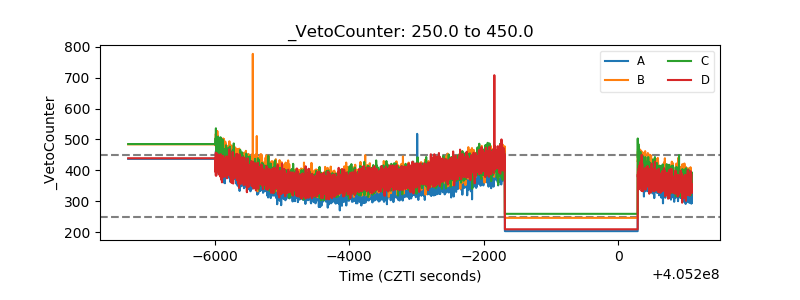 |