| Param | Original file | Final file |
|---|---|---|
| Filename | modeM0/AS1A12_025T09_9000005382_38393cztM0_level2.fits | modeM0/AS1A12_025T09_9000005382_38393cztM0_level2_quad_clean.evt |
| Size (bytes) | 402,209,280 | 83,004,480 |
| Size | 383.6 MB | 79.2 MB |
| Events in quadrant A | 2,686,474 | 569,225 |
| Events in quadrant B | 3,050,857 | 583,941 |
| Events in quadrant C | 2,411,699 | 553,784 |
| Events in quadrant D | 6,349,966 | 454,870 |
| Mode M9 | |||
|---|---|---|---|
| Quadrant | BADHDUFLAG | Total packets | Discarded packets |
| A | 0 | 26 | 0 |
| B | 0 | 26 | 0 |
| C | 0 | 26 | 0 |
| D | 0 | 27 | 0 |
| Mode M0 | |||
|---|---|---|---|
| Quadrant | BADHDUFLAG | Total packets | Discarded packets |
| A | 0 | 11206 | 2 |
| B | 0 | 12611 | 2 |
| C | 0 | 10349 | 2 |
| D | 0 | 22323 | 2 |
| Mode SS | |||
|---|---|---|---|
| Quadrant | BADHDUFLAG | Total packets | Discarded packets |
| A | 0 | 102 | 0 |
| B | 0 | 102 | 0 |
| C | 0 | 102 | 0 |
| D | 0 | 102 | 0 |
| Quadrant | Total seconds | Saturated seconds | Saturation percentage |
|---|---|---|---|
| A | 5015 | 22 | 0.438684% |
| B | 5015 | 33 | 0.658026% |
| C | 5015 | 11 | 0.219342% |
| D | 5015 | 675 | 13.459621% |
Noise dominated data is calculated using 1-second bins in cleaned event files. If a bin has >2000 counts, and if more than 50% of those come from <1% of pixels, then it is considered to be noise-dominated and hence unusable.
| Quadrant | # 1 sec bins | Bins with >0 counts | Bins with >2000 counts | High rate bins dominated by noise | Noise dominated (total time) | Noise dominated (detector-on time) | Marked lightcurve |
|---|---|---|---|---|---|---|---|
| A | 6658 | 5016 | 13 | 13 | 0.20% | 0.26% | 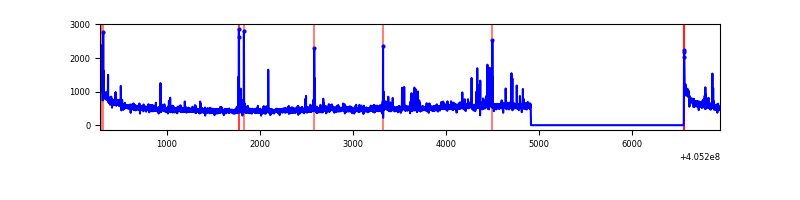 |
| B | 6658 | 5016 | 4 | 4 | 0.06% | 0.08% | 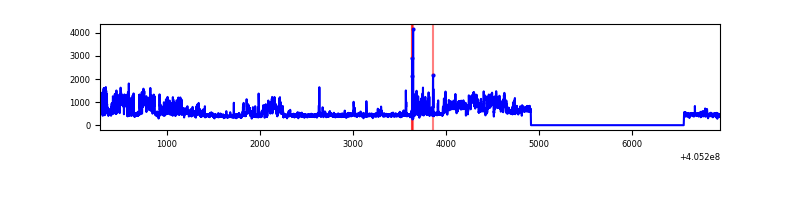 |
| C | 6658 | 5016 | 8 | 8 | 0.12% | 0.16% | 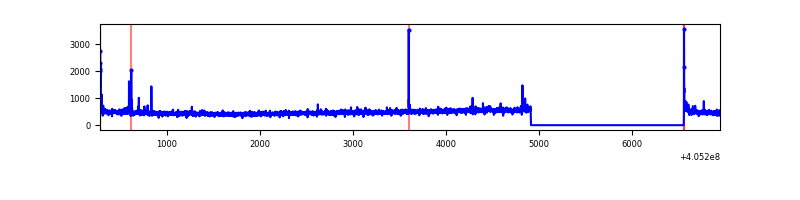 |
| D | 6658 | 5016 | 653 | 653 | 9.81% | 13.02% | 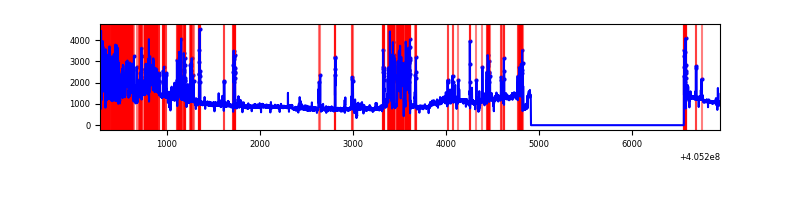 |
Top three noisy pixels from each quadrant. If the there are fewer than three noisy pixels in the level2.evt file, extra rows are filled as -1
| Pixel properties | Quadrant properties | ||||||
|---|---|---|---|---|---|---|---|
| Quadrant | DetID | PixID | Counts | Sigma | Mean | Median | Sigma |
| A | 10 | 83 | 362086 | 3256.86 | 551 | 540 | 111.0 |
| A | 12 | 189 | 59774 | 533.59 | 551 | 540 | 111.0 |
| A | 13 | 248 | 49938 | 444.98 | 551 | 540 | 111.0 |
| B | 0 | 183 | 762690 | 7203.68 | 552 | 536 | 105.8 |
| B | 4 | 232 | 35908 | 334.33 | 552 | 536 | 105.8 |
| B | 4 | 171 | 23744 | 219.36 | 552 | 536 | 105.8 |
| C | 15 | 214 | 212548 | 1678.2 | 543 | 548 | 126.3 |
| C | 0 | 10 | 36446 | 284.17 | 543 | 548 | 126.3 |
| C | 14 | 254 | 33040 | 257.21 | 543 | 548 | 126.3 |
| D | 10 | 203 | 2754124 | 22009.77 | 512 | 497 | 125.1 |
| D | 12 | 227 | 559953 | 4471.73 | 512 | 497 | 125.1 |
| D | 7 | 223 | 386404 | 3084.55 | 512 | 497 | 125.1 |
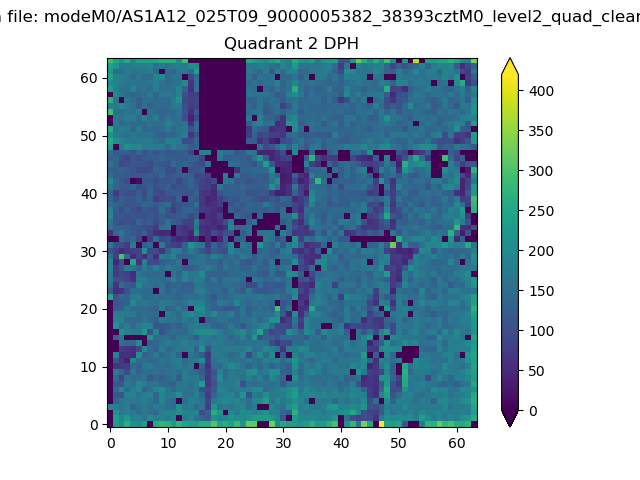
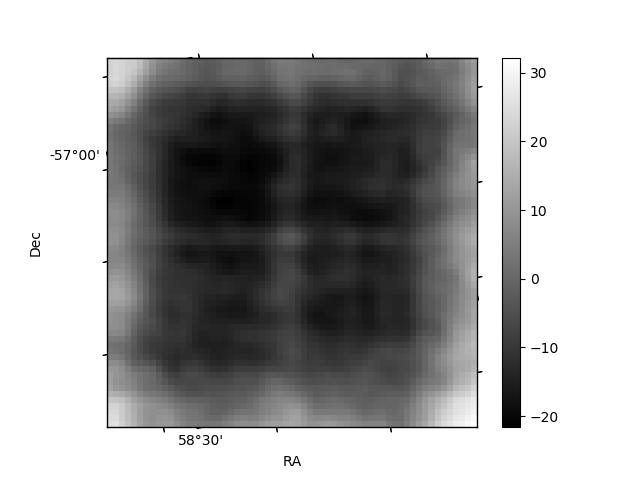
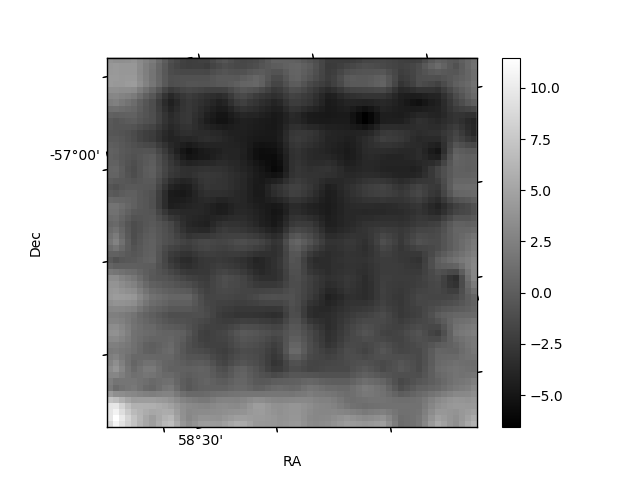
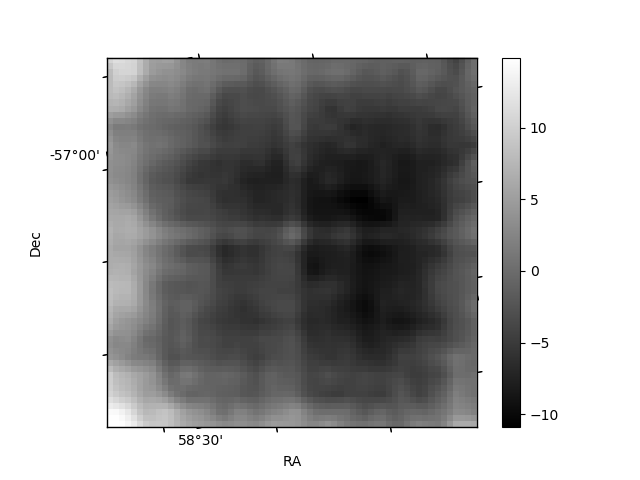
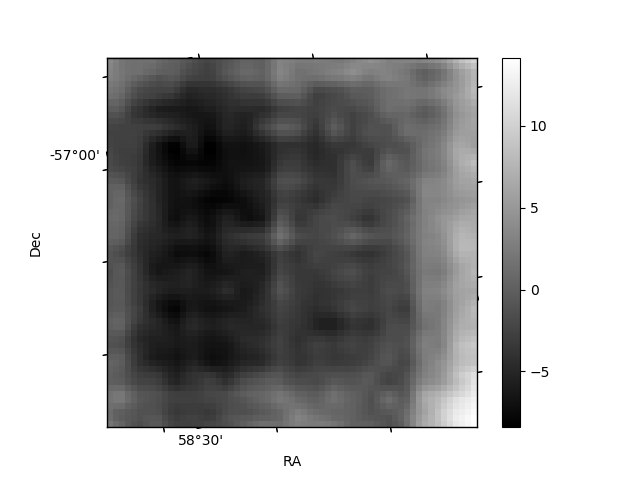
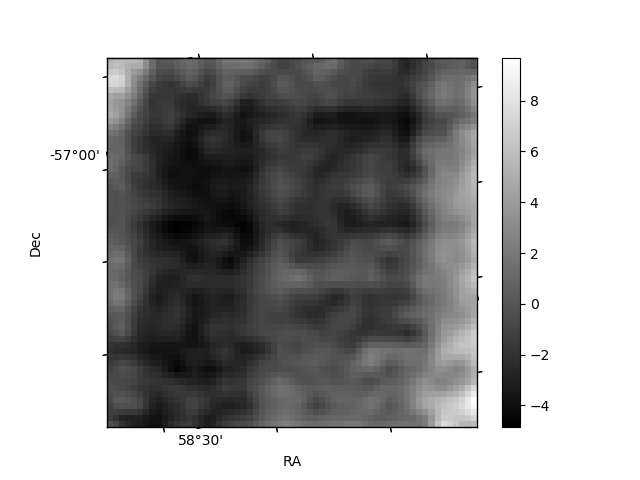
Histogram calculated using DETX and DETY for each event in the final _common_clean file
| Quadrant A | 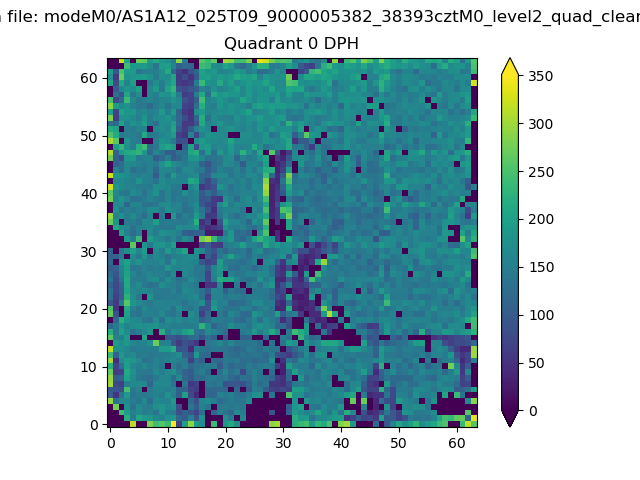 |
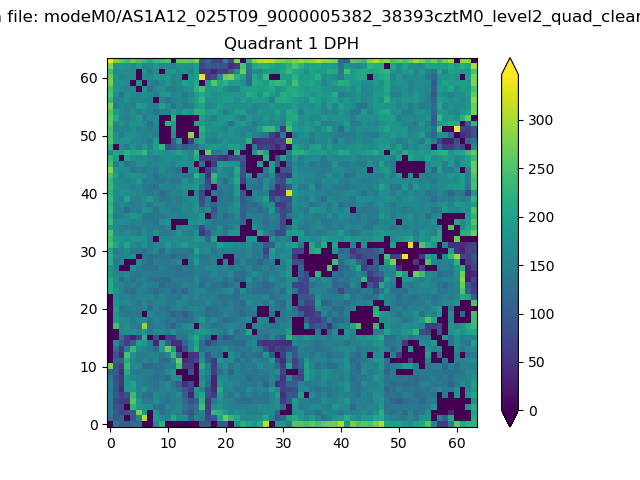 |
Quadrant B |
|---|---|---|---|
| Quadrant D | 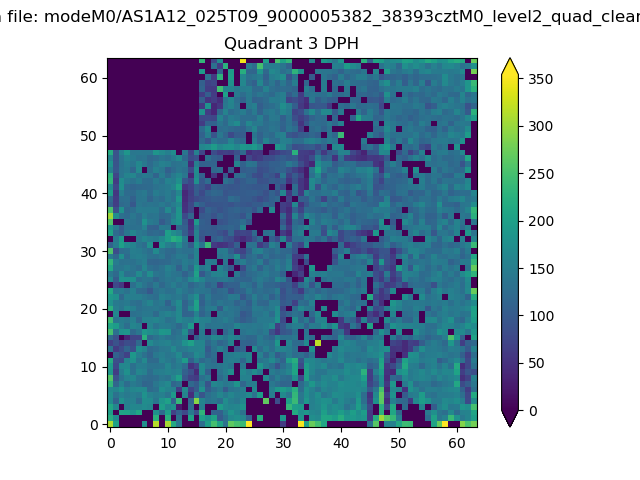 |
 |
Quadrant C |
| Plot type | Count rate plots | Images |
|---|---|---|
| Comparison with Poisson distribution Blue bars denote a histogram of data divided into 1 sec bins. Red curve is a Poisson curve with rate = median count rate of data. |
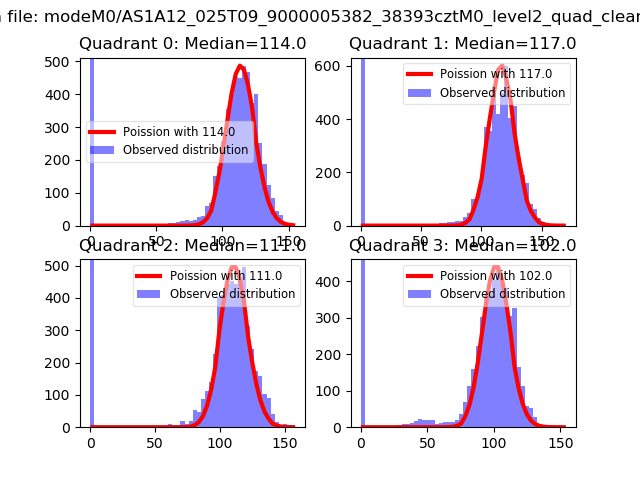 |
 |
| Quadrant-wise count rates Data is divided into 100 sec bins |
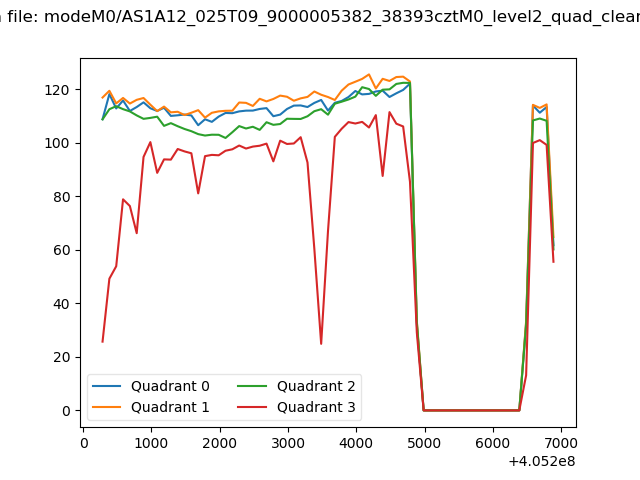 |
|
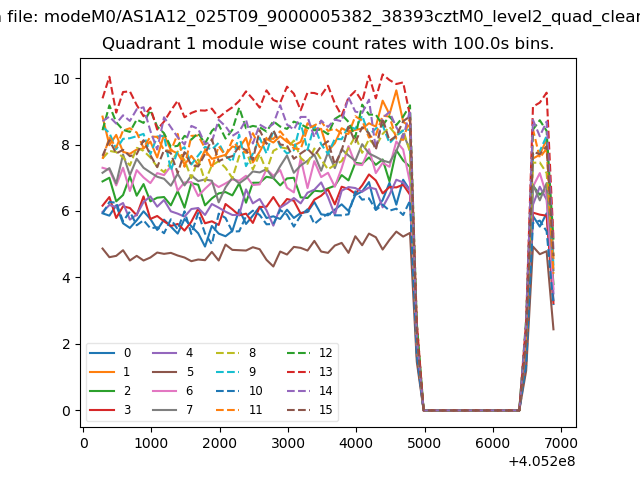
| Module-wise count rates for Quadrant A Data is divided into 100 sec bins |
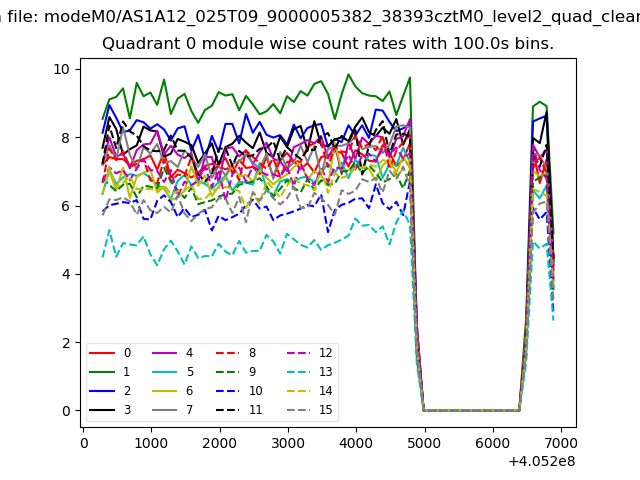 |
 |
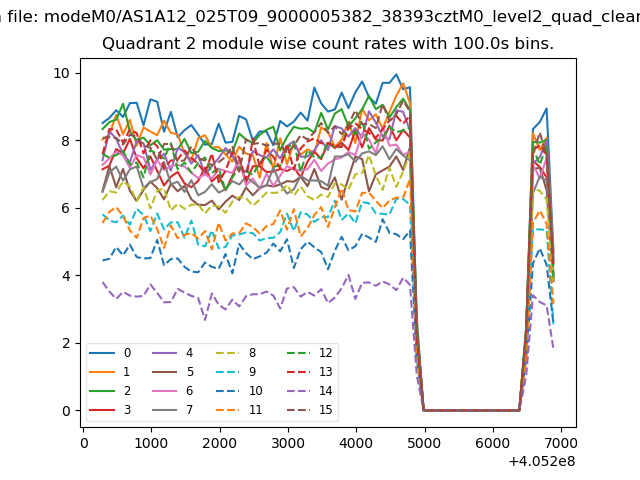
| Module-wise count rates for Quadrant B Data is divided into 100 sec bins |
 |
 |
| Module-wise count rates for Quadrant C Data is divided into 100 sec bins |
 |
 |
| Module-wise count rates for Quadrant D Data is divided into 100 sec bins |
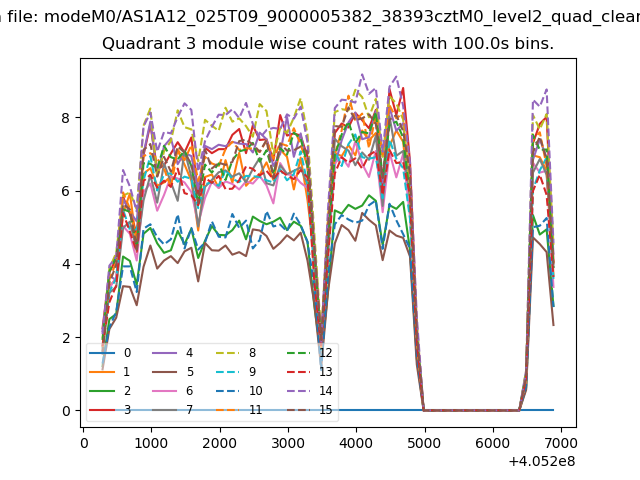 |
 |
| Parameter | Plot |
|---|---|
| CZT HV Monitor | 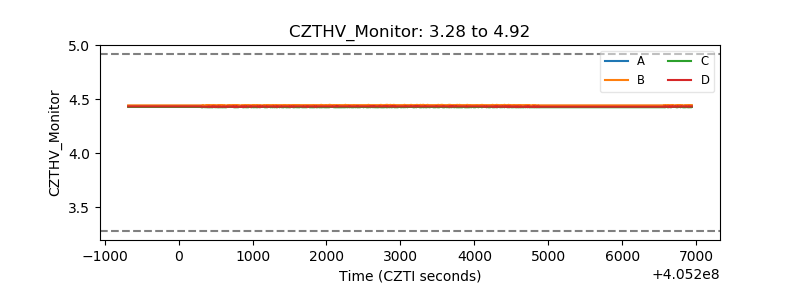 |
| D_VDD | 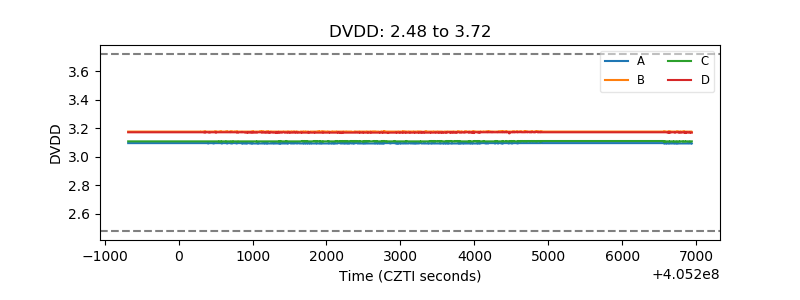 |
| Temperature 1 | 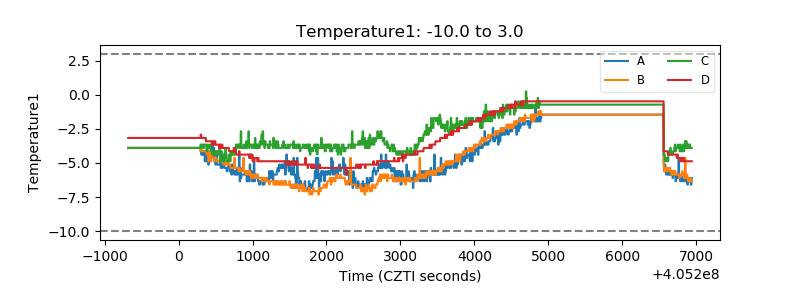 |
| Veto HV Monitor | 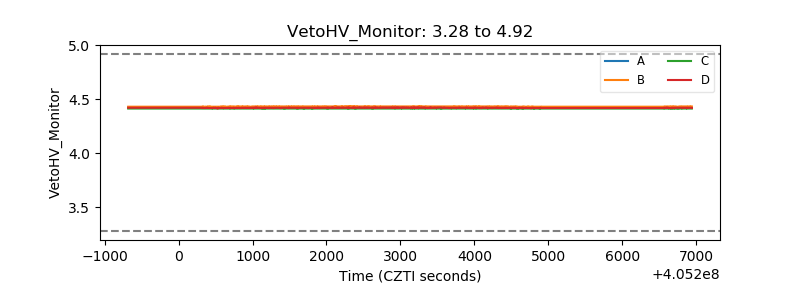 |
| Veto LLD | 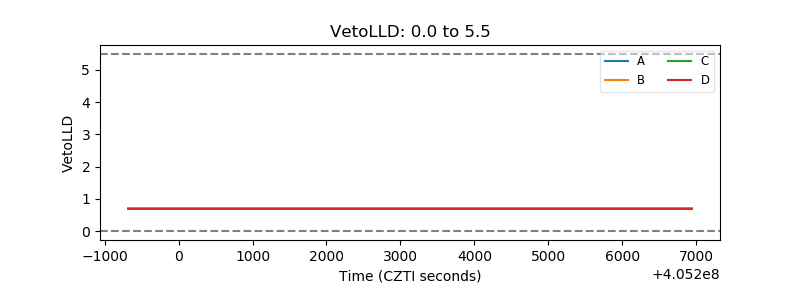 |
| Alpha Counter | 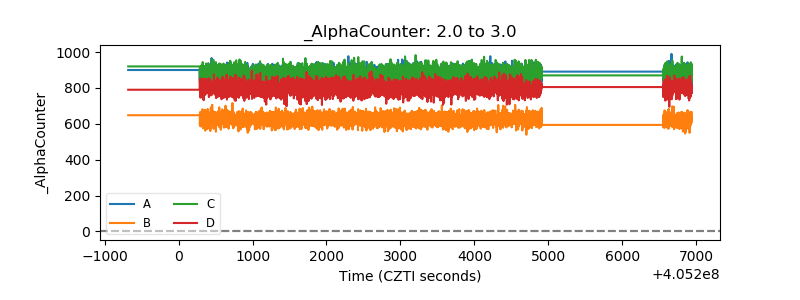 |
| _CPM_Rate | 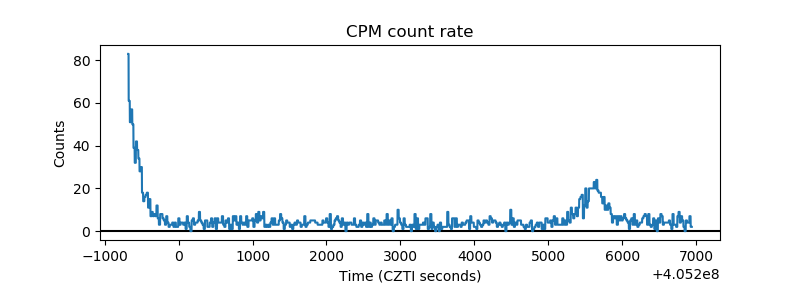 |
| CZT Counter | 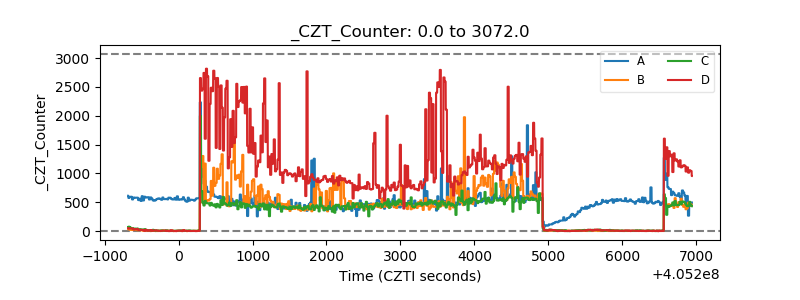 |
| +2.5 Volts monitor | 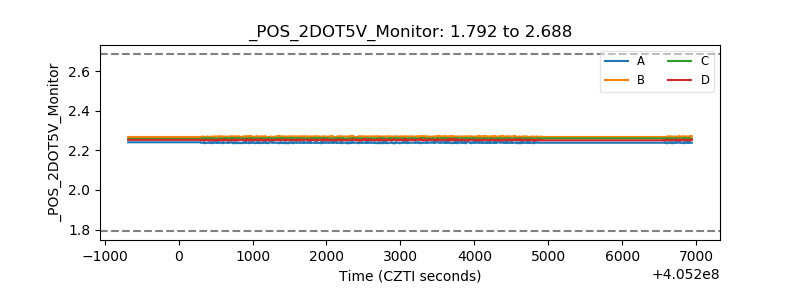 |
| +5 Volts monitor | 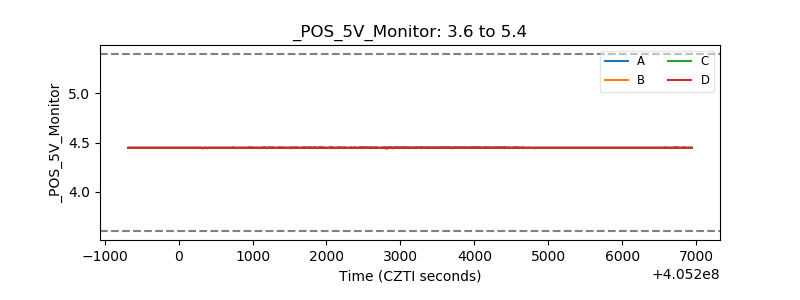 |
| _ROLL_ROT | 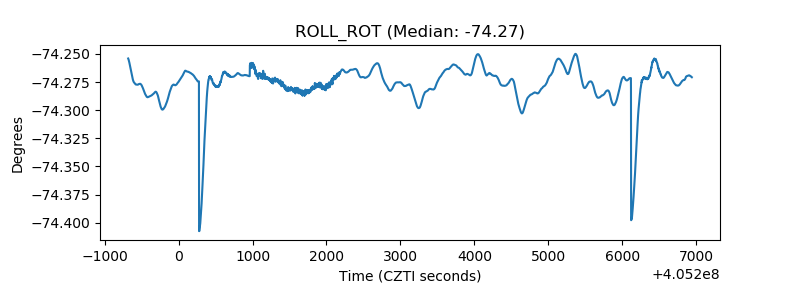 |
| _Roll_DEC | 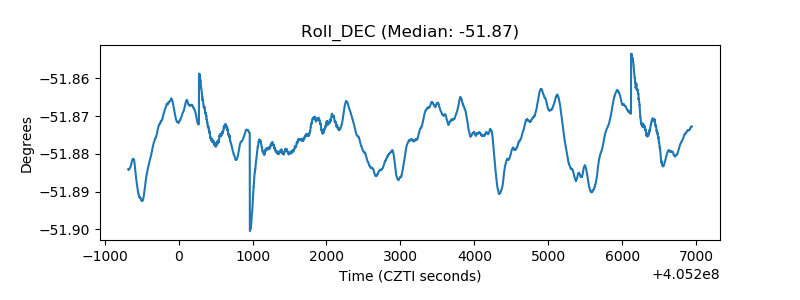 |
| _Roll_RA | 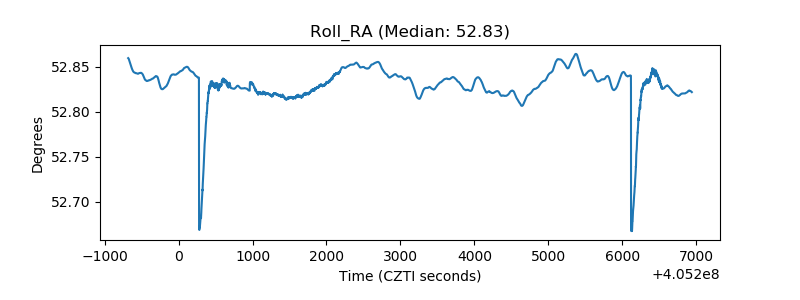 |
| Veto Counter | 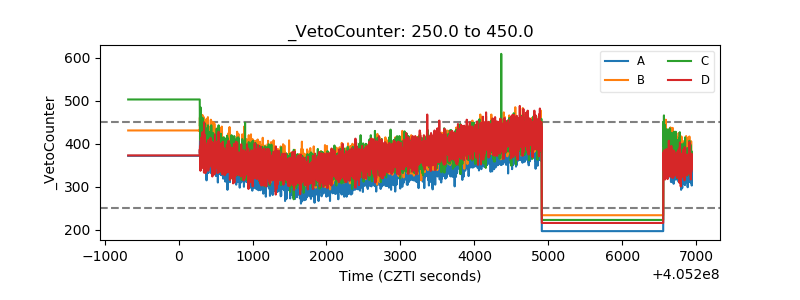 |