| Param | Original file | Final file |
|---|---|---|
| Filename | modeM0/AS1A12_025T10_9000005384_38395cztM0_level2.fits | modeM0/AS1A12_025T10_9000005384_38395cztM0_level2_quad_clean.evt |
| Size (bytes) | 491,060,160 | 100,126,080 |
| Size | 468.3 MB | 95.5 MB |
| Events in quadrant A | 3,753,182 | 683,841 |
| Events in quadrant B | 3,274,548 | 694,120 |
| Events in quadrant C | 2,943,250 | 660,449 |
| Events in quadrant D | 7,728,634 | 563,134 |
| Mode SS | |||
|---|---|---|---|
| Quadrant | BADHDUFLAG | Total packets | Discarded packets |
| A | 0 | 126 | 0 |
| B | 0 | 126 | 0 |
| C | 0 | 126 | 0 |
| D | 0 | 126 | 0 |
| Mode M0 | |||
|---|---|---|---|
| Quadrant | BADHDUFLAG | Total packets | Discarded packets |
| A | 0 | 15043 | 3 |
| B | 0 | 13847 | 2 |
| C | 0 | 12550 | 2 |
| D | 0 | 27125 | 2 |
| Mode M9 | |||
|---|---|---|---|
| Quadrant | BADHDUFLAG | Total packets | Discarded packets |
| A | 0 | 27 | 0 |
| B | 0 | 27 | 0 |
| C | 0 | 27 | 0 |
| D | 0 | 27 | 0 |
| Quadrant | Total seconds | Saturated seconds | Saturation percentage |
|---|---|---|---|
| A | 6163 | 51 | 0.827519% |
| B | 6163 | 90 | 1.460328% |
| C | 6163 | 11 | 0.178485% |
| D | 6163 | 714 | 11.585267% |
Noise dominated data is calculated using 1-second bins in cleaned event files. If a bin has >2000 counts, and if more than 50% of those come from <1% of pixels, then it is considered to be noise-dominated and hence unusable.
| Quadrant | # 1 sec bins | Bins with >0 counts | Bins with >2000 counts | High rate bins dominated by noise | Noise dominated (total time) | Noise dominated (detector-on time) | Marked lightcurve |
|---|---|---|---|---|---|---|---|
| A | 8849 | 6165 | 29 | 29 | 0.33% | 0.47% | 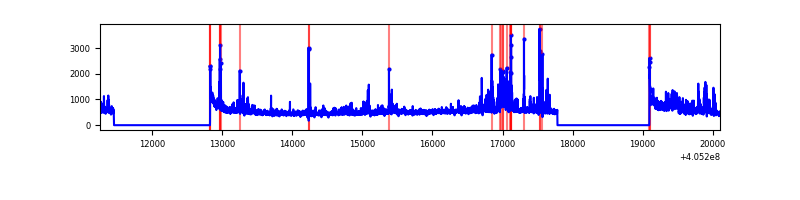 |
| B | 8849 | 6165 | 51 | 51 | 0.58% | 0.83% | 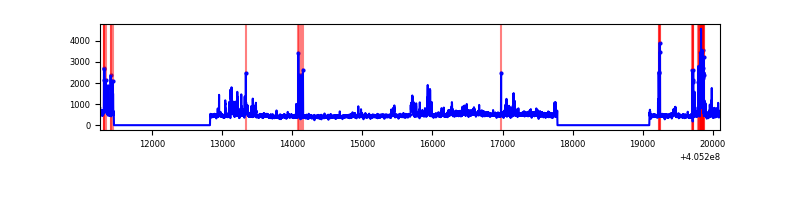 |
| C | 8849 | 6165 | 6 | 6 | 0.07% | 0.10% | 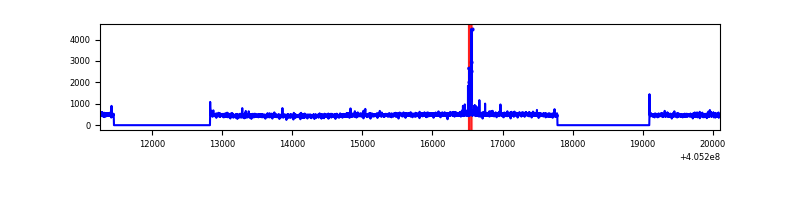 |
| D | 8849 | 6165 | 704 | 704 | 7.96% | 11.42% | 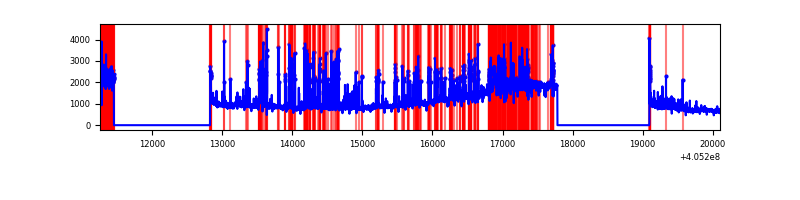 |
Top three noisy pixels from each quadrant. If the there are fewer than three noisy pixels in the level2.evt file, extra rows are filled as -1
| Pixel properties | Quadrant properties | ||||||
|---|---|---|---|---|---|---|---|
| Quadrant | DetID | PixID | Counts | Sigma | Mean | Median | Sigma |
| A | 10 | 83 | 446655 | 3204.88 | 687 | 672 | 139.2 |
| A | 12 | 16 | 339394 | 2434.09 | 687 | 672 | 139.2 |
| A | 9 | 143 | 128766 | 920.5 | 687 | 672 | 139.2 |
| B | 0 | 183 | 182991 | 1379.23 | 685 | 665 | 132.2 |
| B | 8 | 3 | 154362 | 1162.67 | 685 | 665 | 132.2 |
| B | 4 | 232 | 47790 | 356.48 | 685 | 665 | 132.2 |
| C | 15 | 214 | 256066 | 1626.52 | 671 | 674 | 157.0 |
| C | 12 | 249 | 49758 | 312.6 | 671 | 674 | 157.0 |
| C | 15 | 159 | 8716 | 51.22 | 671 | 674 | 157.0 |
| D | 10 | 203 | 3745139 | 23681.2 | 647 | 628 | 158.1 |
| D | 2 | 16 | 917045 | 5795.64 | 647 | 628 | 158.1 |
| D | 13 | 249 | 95214 | 598.18 | 647 | 628 | 158.1 |
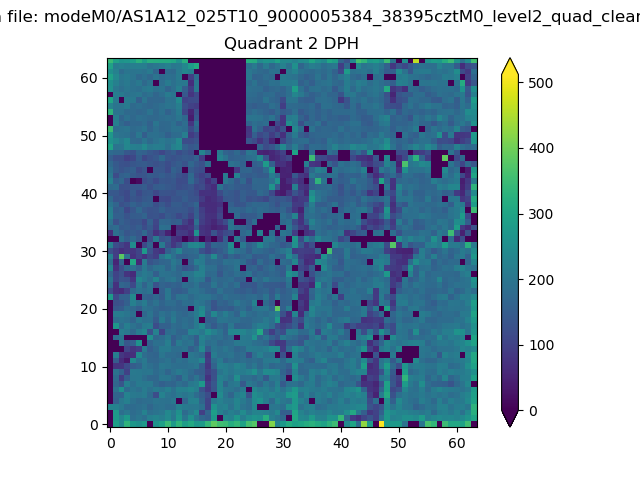
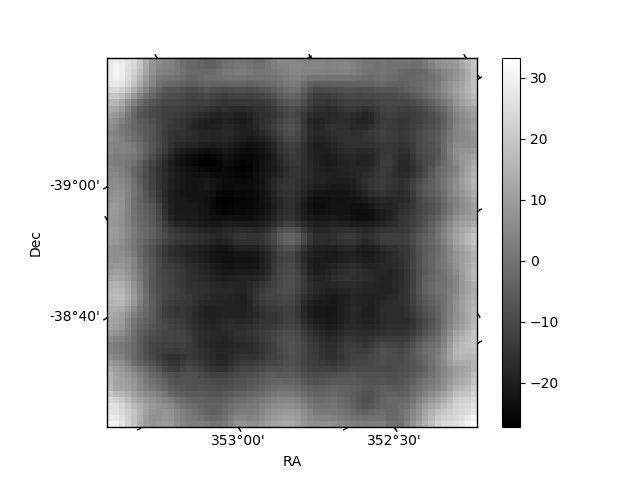
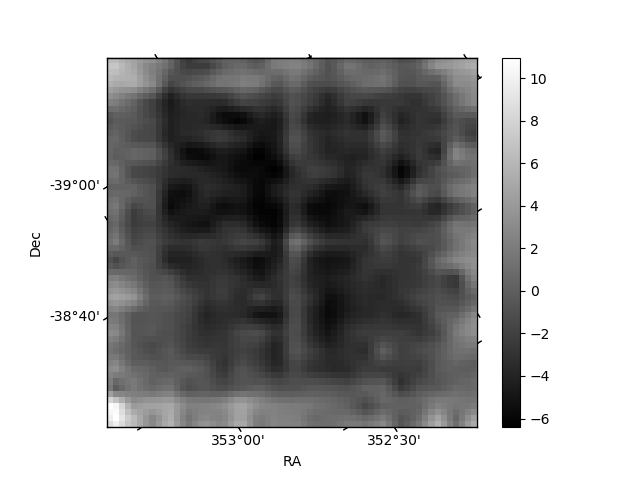
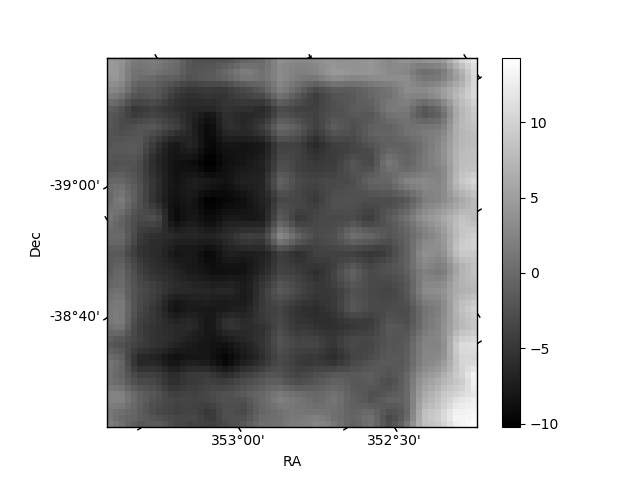
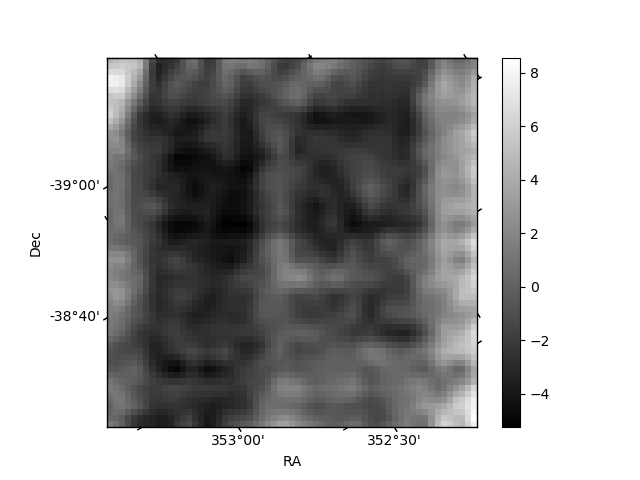
Histogram calculated using DETX and DETY for each event in the final _common_clean file
| Quadrant A | 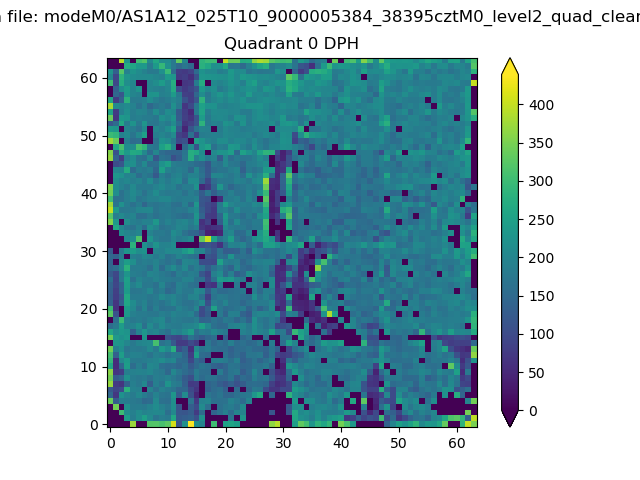 |
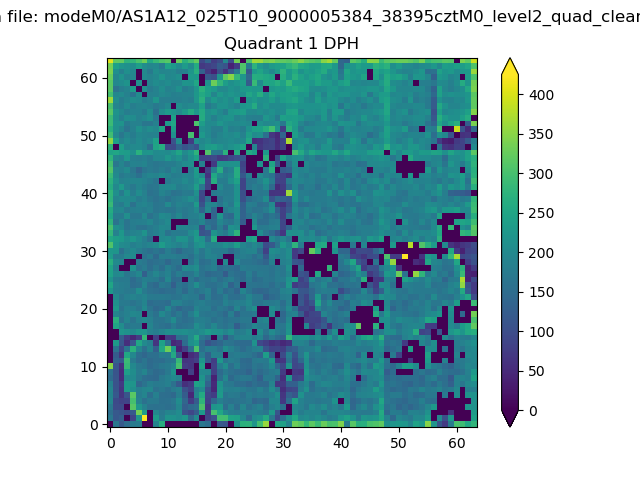 |
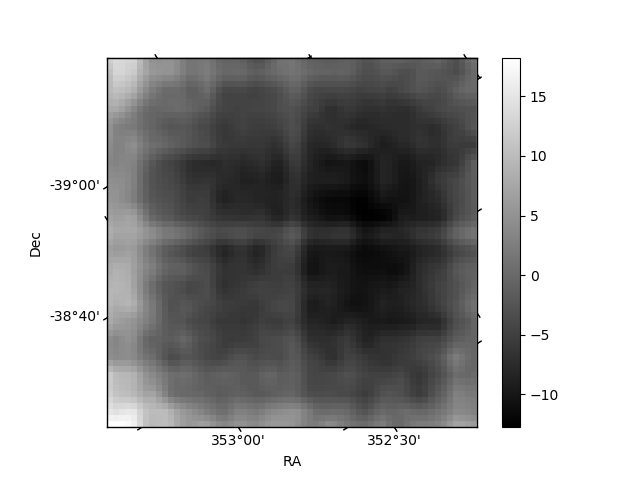
Quadrant B |
|---|---|---|---|
| Quadrant D | 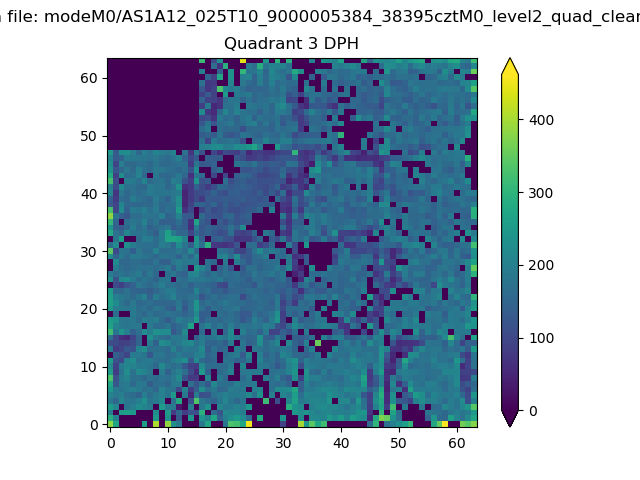 |
 |
Quadrant C |
| Plot type | Count rate plots | Images |
|---|---|---|
| Comparison with Poisson distribution Blue bars denote a histogram of data divided into 1 sec bins. Red curve is a Poisson curve with rate = median count rate of data. |
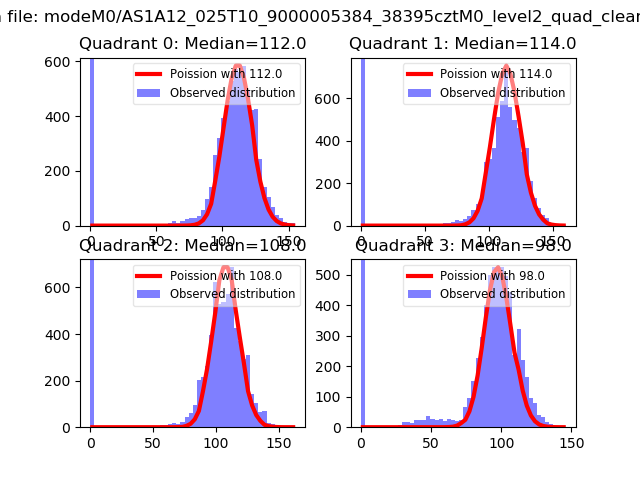 |
 |
| Quadrant-wise count rates Data is divided into 100 sec bins |
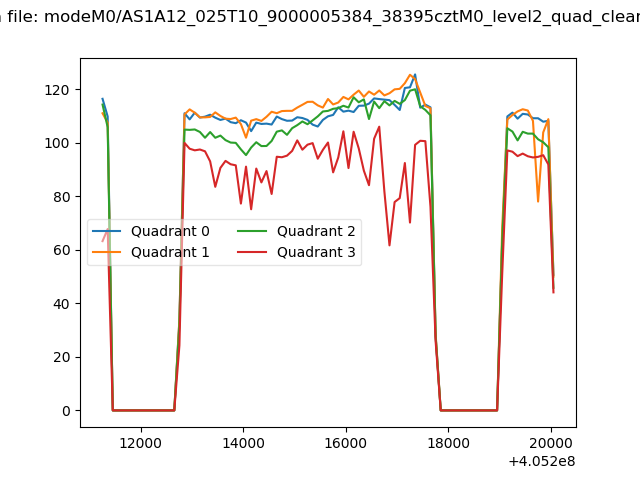 |
|
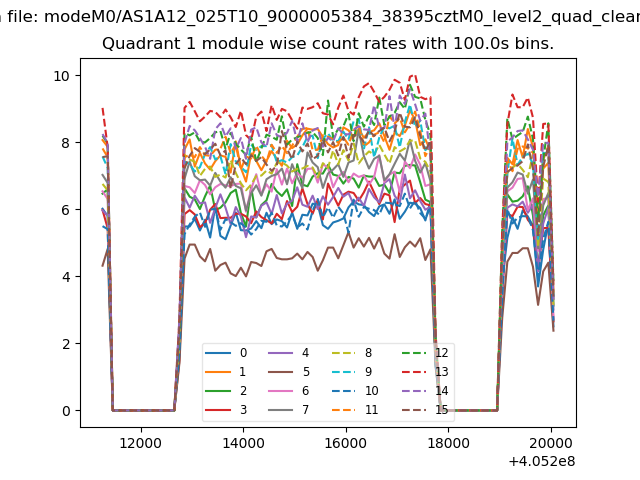
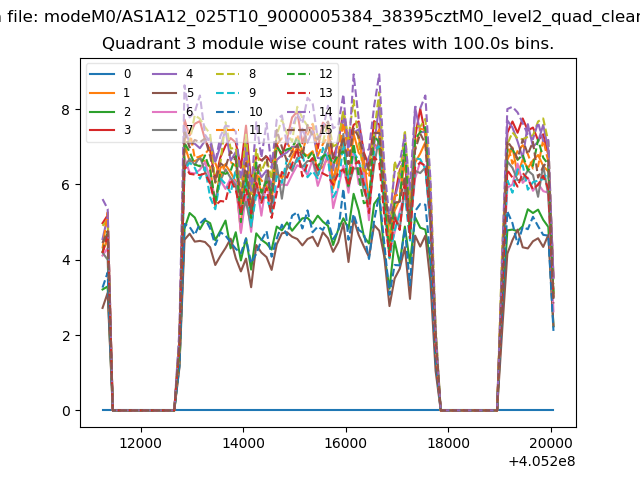
| Module-wise count rates for Quadrant A Data is divided into 100 sec bins |
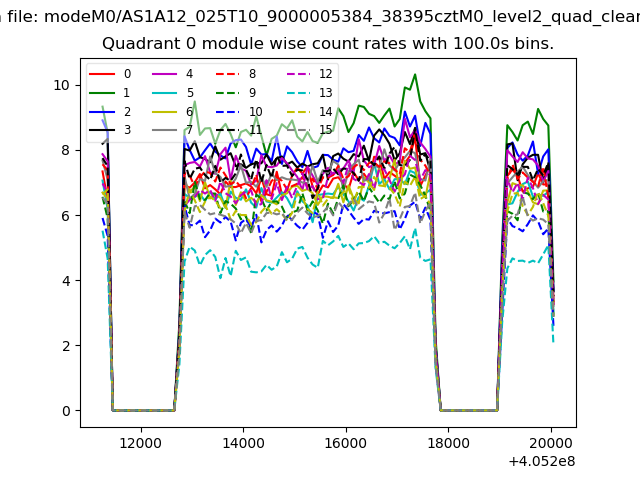 |
 |
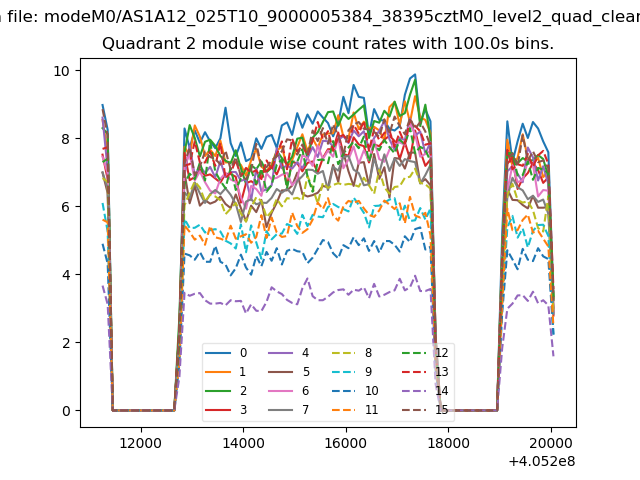
| Module-wise count rates for Quadrant B Data is divided into 100 sec bins |
 |
 |
| Module-wise count rates for Quadrant C Data is divided into 100 sec bins |
 |
 |
| Module-wise count rates for Quadrant D Data is divided into 100 sec bins |
 |
 |
| Parameter | Plot |
|---|---|
| CZT HV Monitor | 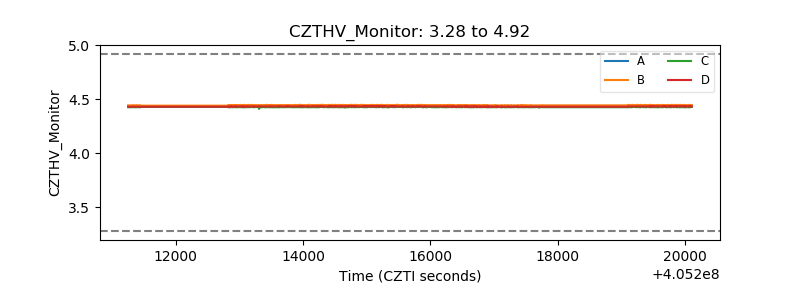 |
| D_VDD | 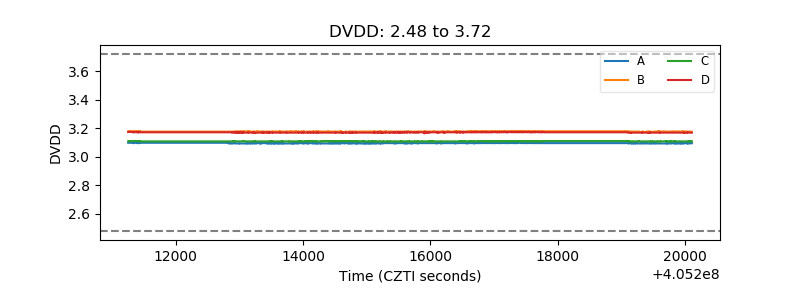 |
| Temperature 1 | 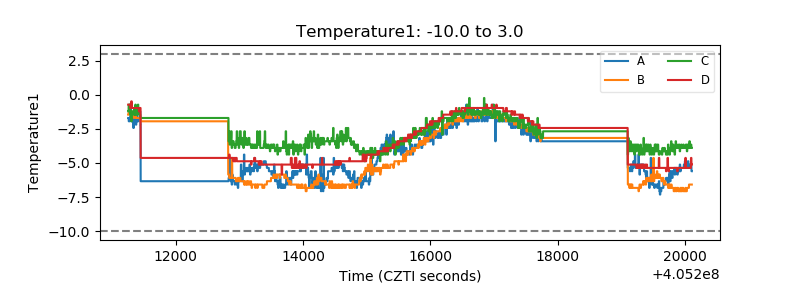 |
| Veto HV Monitor | 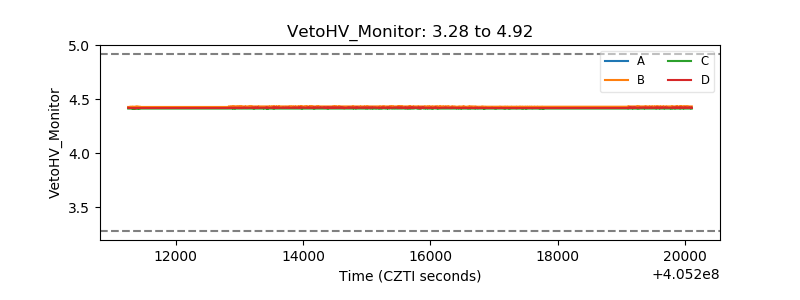 |
| Veto LLD | 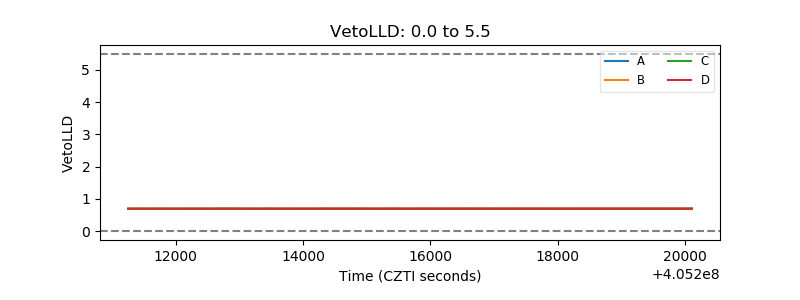 |
| Alpha Counter | 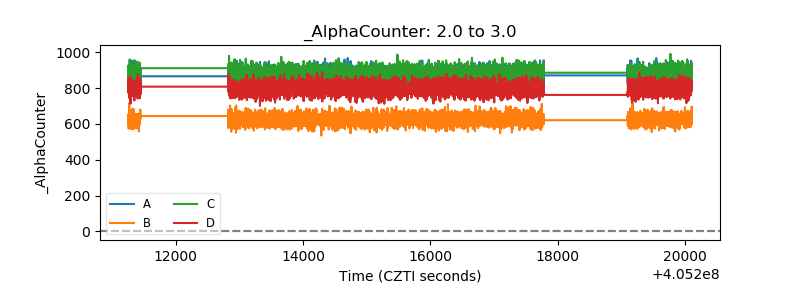 |
| _CPM_Rate |  |
| CZT Counter | 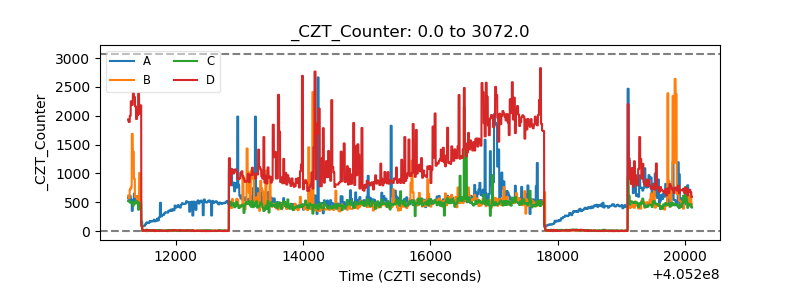 |
| +2.5 Volts monitor | 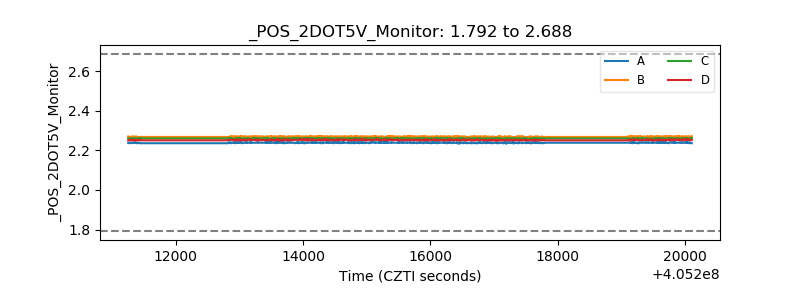 |
| +5 Volts monitor | 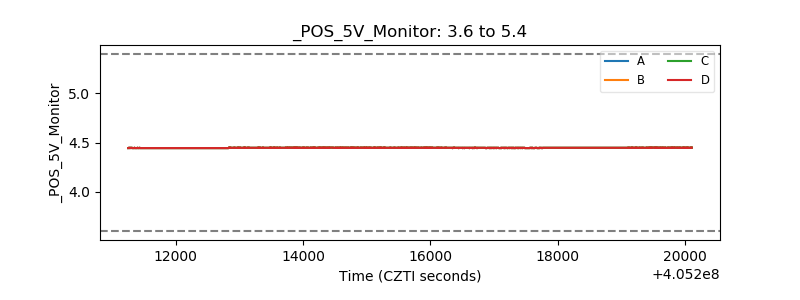 |
| _ROLL_ROT | 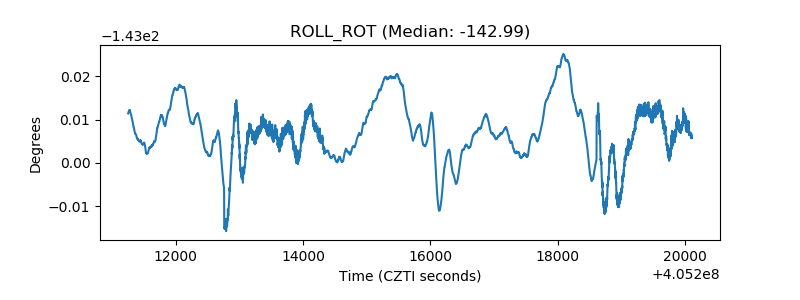 |
| _Roll_DEC | 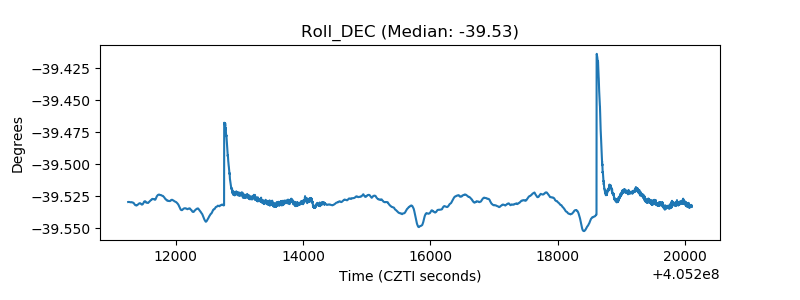 |
| _Roll_RA | 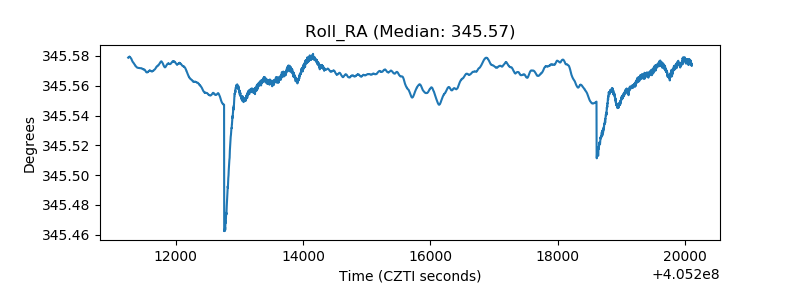 |
| Veto Counter | 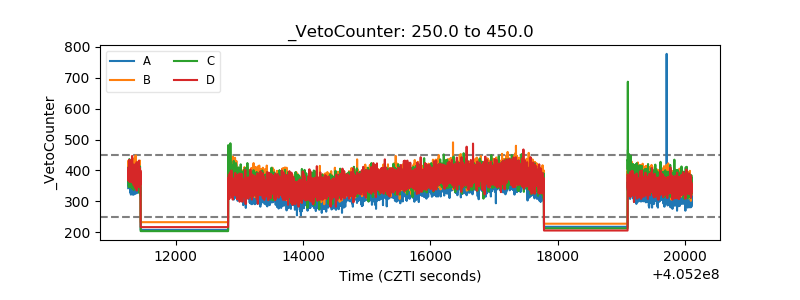 |