| Param | Original file | Final file |
|---|---|---|
| Filename | modeM0/AS1A12_025T10_9000005384_38398cztM0_level2.fits | modeM0/AS1A12_025T10_9000005384_38398cztM0_level2_quad_clean.evt |
| Size (bytes) | 1,325,257,920 | 255,654,720 |
| Size | 1.2 GB | 243.8 MB |
| Events in quadrant A | 8,964,635 | 1,765,247 |
| Events in quadrant B | 12,074,547 | 1,629,955 |
| Events in quadrant C | 7,606,710 | 1,727,514 |
| Events in quadrant D | 19,178,394 | 1,515,409 |
| Mode SS | |||
|---|---|---|---|
| Quadrant | BADHDUFLAG | Total packets | Discarded packets |
| A | 0 | 328 | 0 |
| B | 0 | 328 | 0 |
| C | 0 | 328 | 0 |
| D | 0 | 328 | 0 |
| Mode M0 | |||
|---|---|---|---|
| Quadrant | BADHDUFLAG | Total packets | Discarded packets |
| A | 0 | 36155 | 5 |
| B | 0 | 46204 | 4 |
| C | 0 | 32304 | 4 |
| D | 0 | 68531 | 4 |
| Mode M9 | |||
|---|---|---|---|
| Quadrant | BADHDUFLAG | Total packets | Discarded packets |
| A | 0 | 55 | 0 |
| B | 0 | 55 | 0 |
| C | 0 | 55 | 0 |
| D | 0 | 55 | 0 |
| Quadrant | Total seconds | Saturated seconds | Saturation percentage |
|---|---|---|---|
| A | 15975 | 101 | 0.632238% |
| B | 15975 | 1674 | 10.478873% |
| C | 15975 | 9 | 0.056338% |
| D | 15975 | 1053 | 6.591549% |
Noise dominated data is calculated using 1-second bins in cleaned event files. If a bin has >2000 counts, and if more than 50% of those come from <1% of pixels, then it is considered to be noise-dominated and hence unusable.
| Quadrant | # 1 sec bins | Bins with >0 counts | Bins with >2000 counts | High rate bins dominated by noise | Noise dominated (total time) | Noise dominated (detector-on time) | Marked lightcurve |
|---|---|---|---|---|---|---|---|
| A | 21557 | 15979 | 58 | 58 | 0.27% | 0.36% |  |
| B | 21557 | 15979 | 1117 | 1117 | 5.18% | 6.99% |  |
| C | 21557 | 15979 | 2 | 2 | 0.01% | 0.01% | 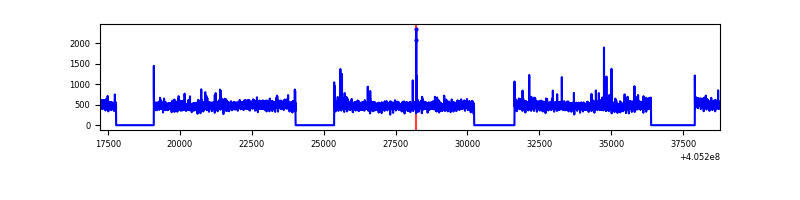 |
| D | 21557 | 15979 | 965 | 965 | 4.48% | 6.04% | 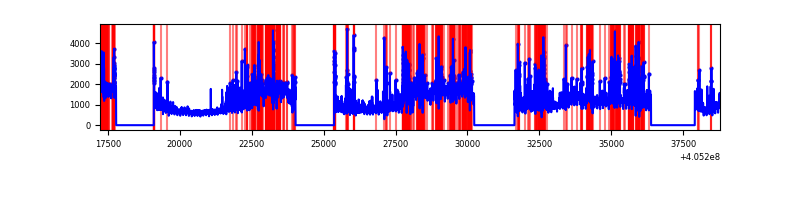 |
Top three noisy pixels from each quadrant. If the there are fewer than three noisy pixels in the level2.evt file, extra rows are filled as -1
| Pixel properties | Quadrant properties | ||||||
|---|---|---|---|---|---|---|---|
| Quadrant | DetID | PixID | Counts | Sigma | Mean | Median | Sigma |
| A | 10 | 83 | 1038667 | 2860.29 | 1799 | 1765 | 362.5 |
| A | 9 | 143 | 291396 | 798.95 | 1799 | 1765 | 362.5 |
| A | 12 | 16 | 236784 | 648.3 | 1799 | 1765 | 362.5 |
| B | 8 | 3 | 3490376 | 10711.43 | 1705 | 1659 | 325.7 |
| B | 0 | 183 | 944690 | 2895.39 | 1705 | 1659 | 325.7 |
| B | 5 | 184 | 339841 | 1038.32 | 1705 | 1659 | 325.7 |
| C | 15 | 214 | 664234 | 1635.89 | 1751 | 1757 | 405.0 |
| C | 12 | 249 | 44309 | 105.07 | 1751 | 1757 | 405.0 |
| C | 15 | 159 | 27422 | 63.37 | 1751 | 1757 | 405.0 |
| D | 10 | 203 | 9119762 | 21651.92 | 1715 | 1665 | 421.1 |
| D | 2 | 16 | 1305556 | 3096.23 | 1715 | 1665 | 421.1 |
| D | 2 | 250 | 452560 | 1070.7 | 1715 | 1665 | 421.1 |
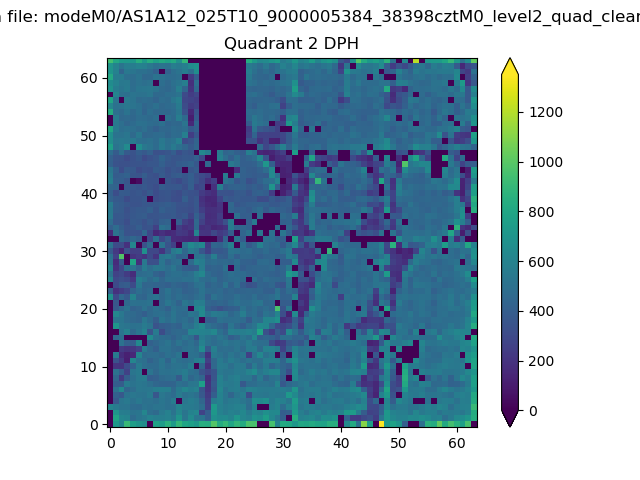
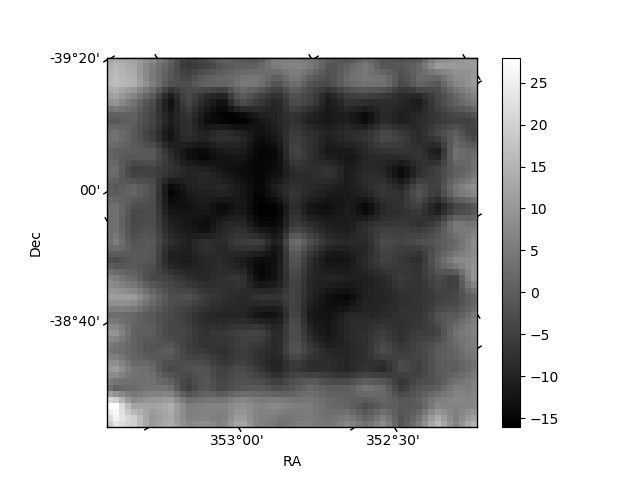
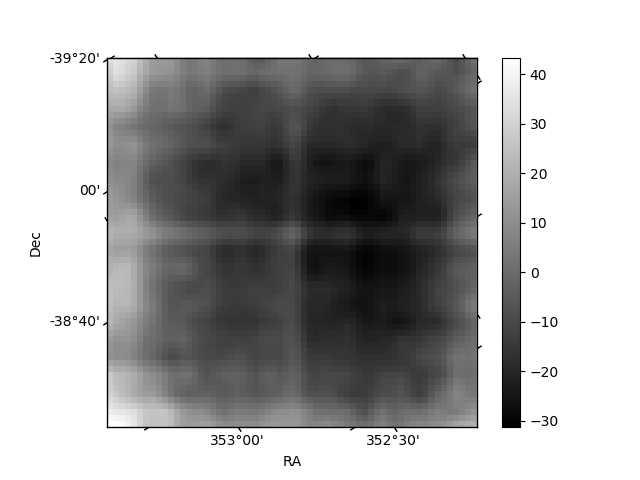
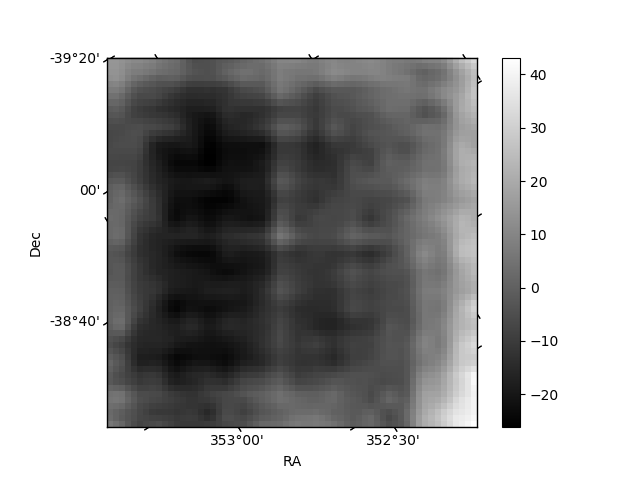
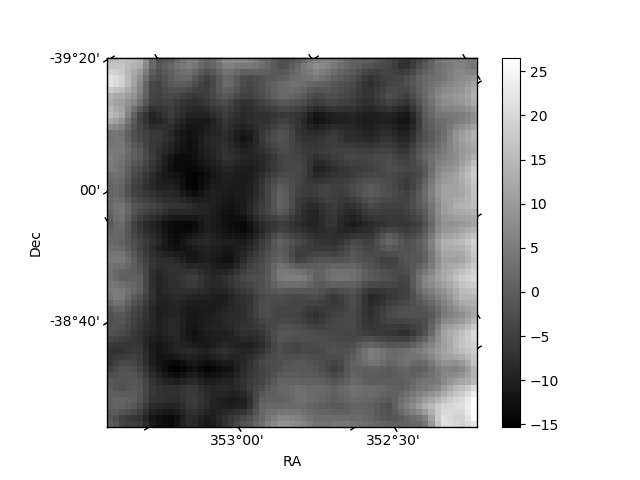
Histogram calculated using DETX and DETY for each event in the final _common_clean file
| Quadrant A | 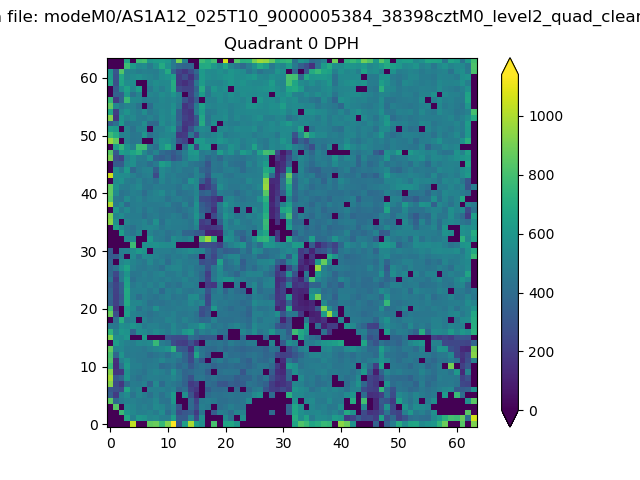 |
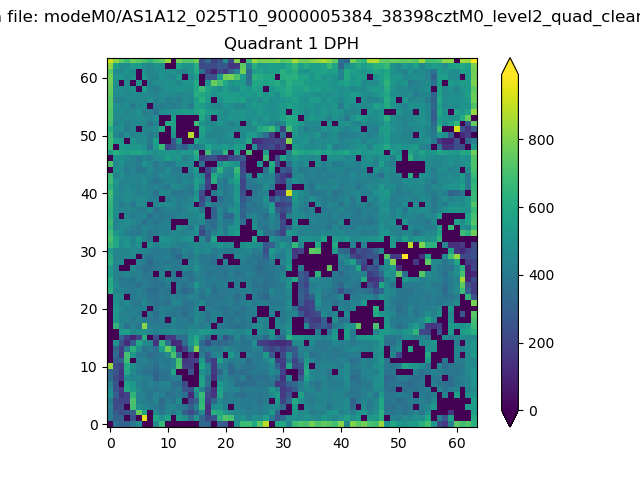 |
Quadrant B |
|---|---|---|---|
| Quadrant D | 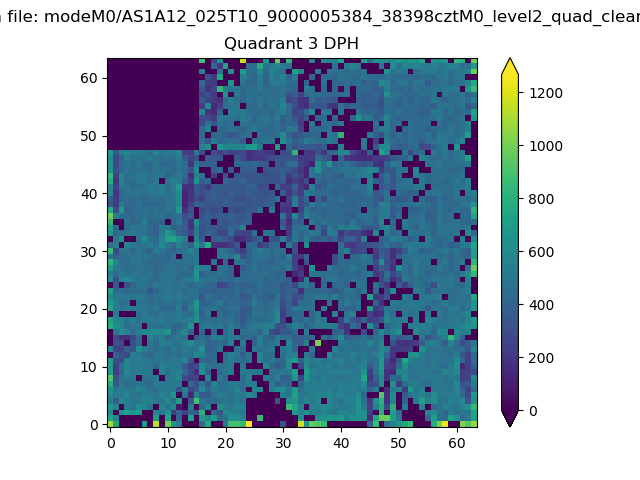 |
 |
Quadrant C |
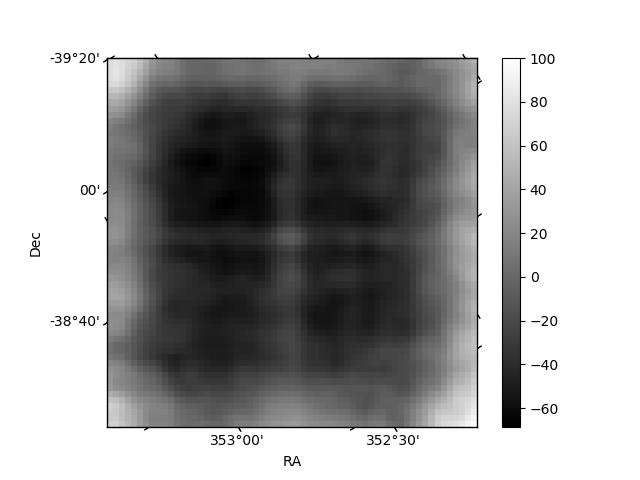
| Plot type | Count rate plots | Images |
|---|---|---|
| Comparison with Poisson distribution Blue bars denote a histogram of data divided into 1 sec bins. Red curve is a Poisson curve with rate = median count rate of data. |
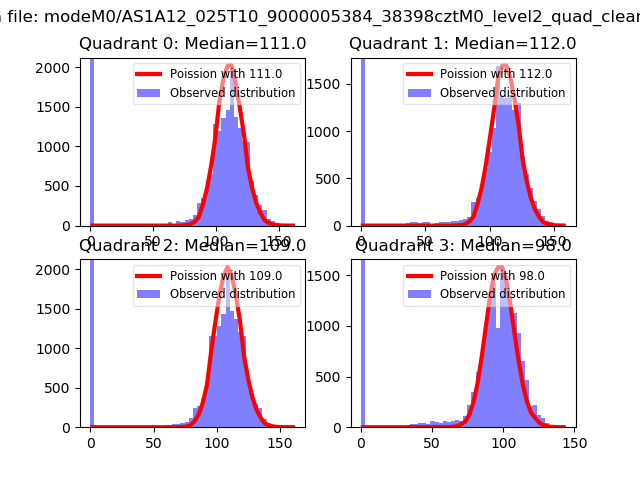 |
 |
| Quadrant-wise count rates Data is divided into 100 sec bins |
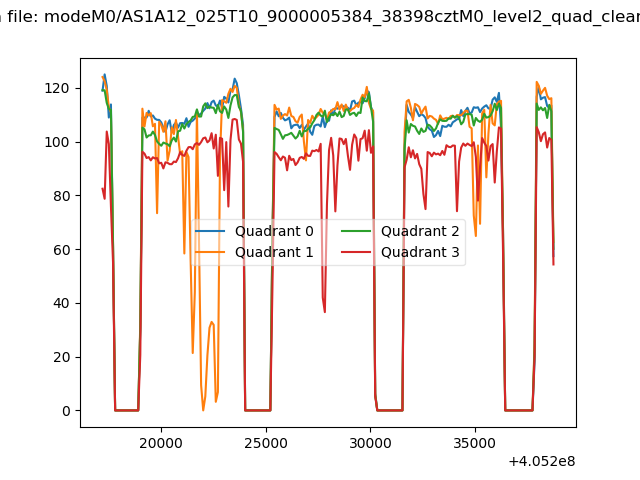 |
|
| Module-wise count rates for Quadrant A Data is divided into 100 sec bins |
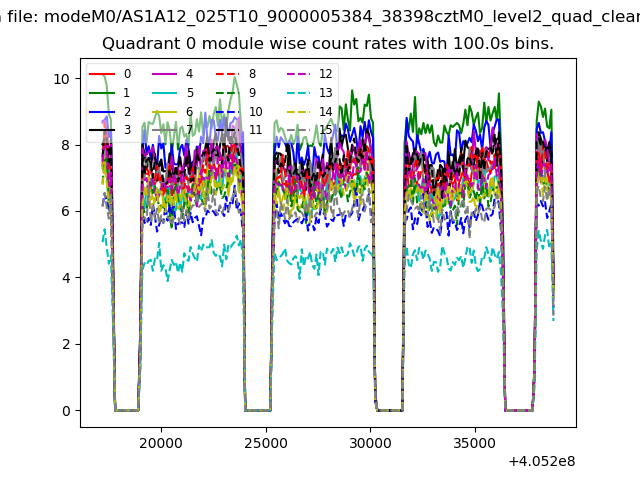 |
 |
| Module-wise count rates for Quadrant B Data is divided into 100 sec bins |
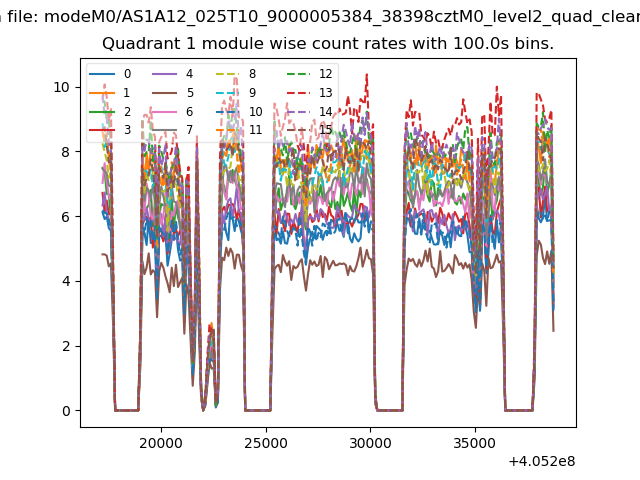 |
 |
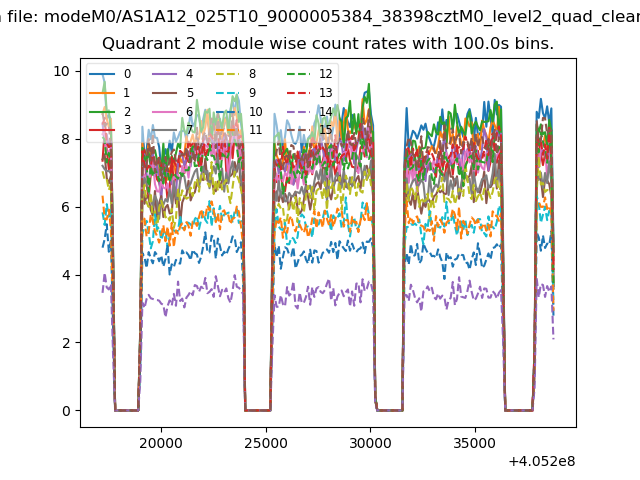
| Module-wise count rates for Quadrant C Data is divided into 100 sec bins |
 |
 |
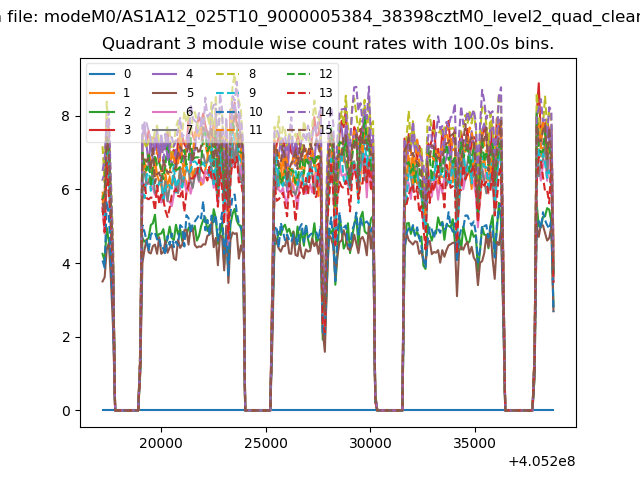
| Module-wise count rates for Quadrant D Data is divided into 100 sec bins |
 |
 |
| Parameter | Plot |
|---|---|
| CZT HV Monitor | 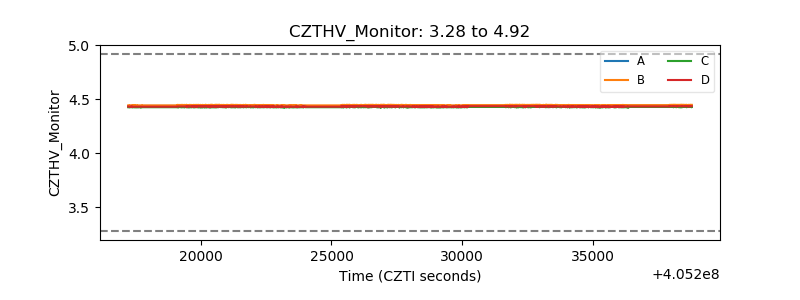 |
| D_VDD |  |
| Temperature 1 | 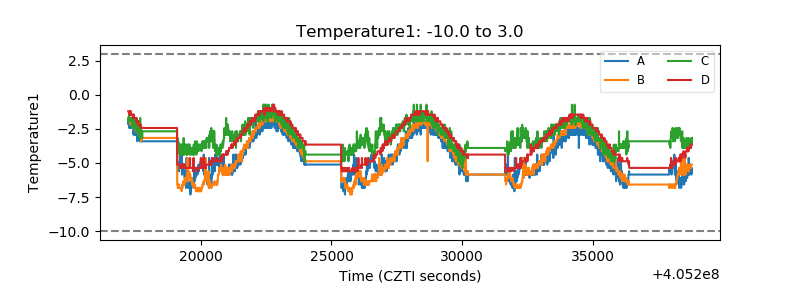 |
| Veto HV Monitor | 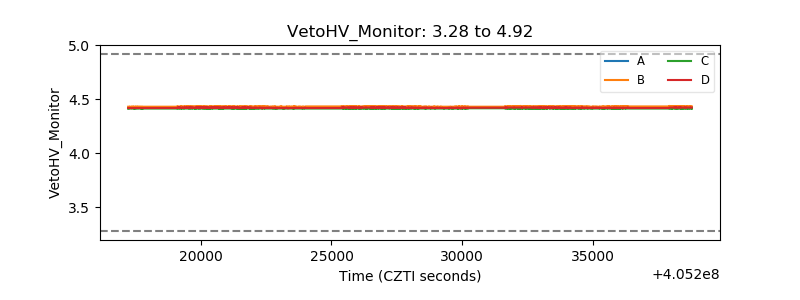 |
| Veto LLD | 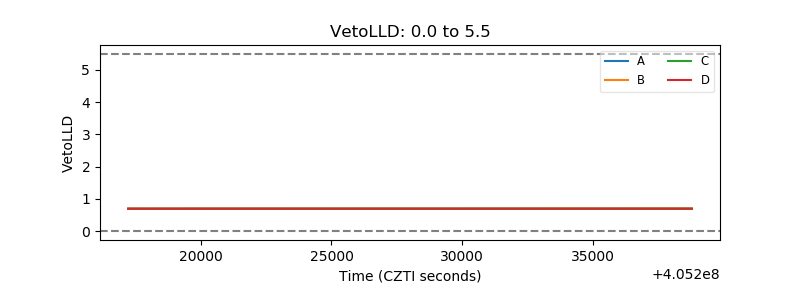 |
| Alpha Counter | 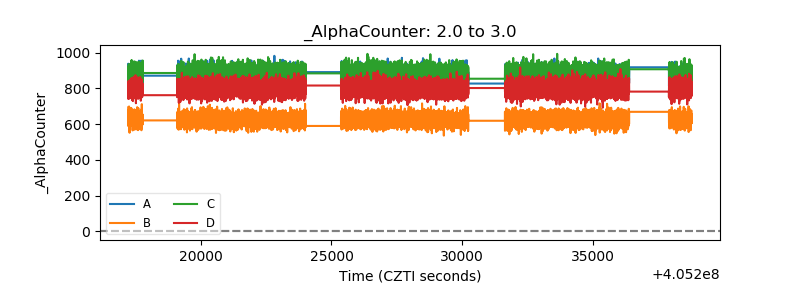 |
| _CPM_Rate | 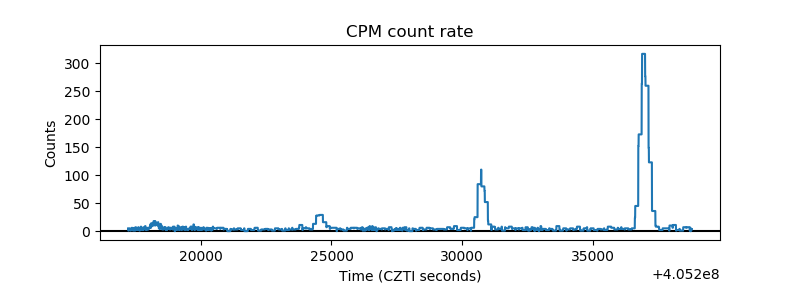 |
| CZT Counter | 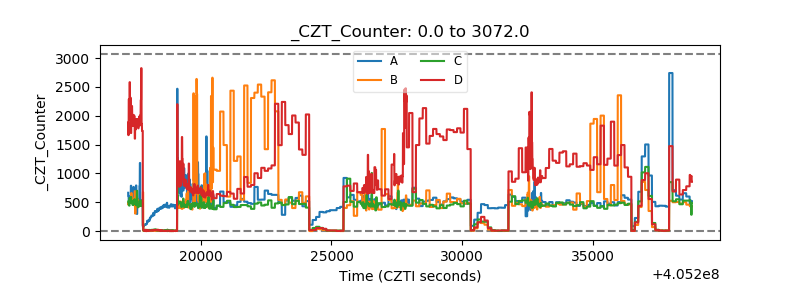 |
| +2.5 Volts monitor | 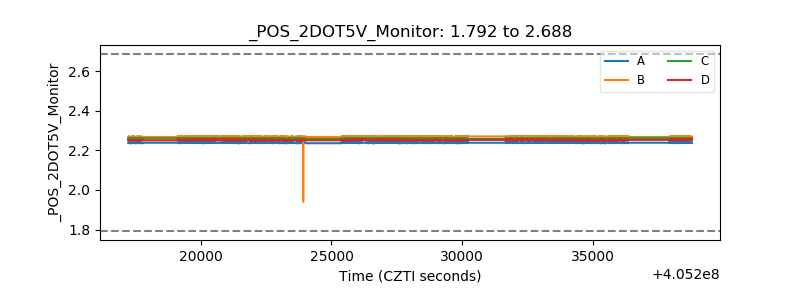 |
| +5 Volts monitor | 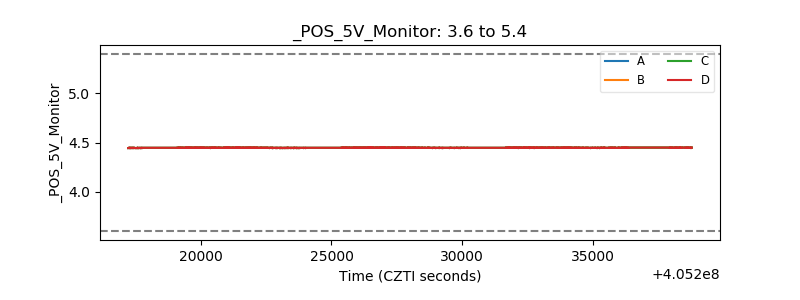 |
| _ROLL_ROT | 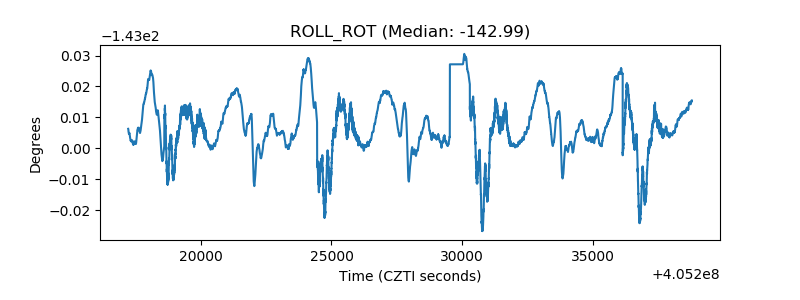 |
| _Roll_DEC | 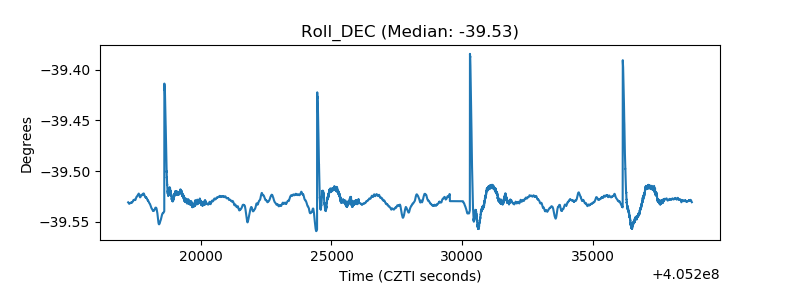 |
| _Roll_RA | 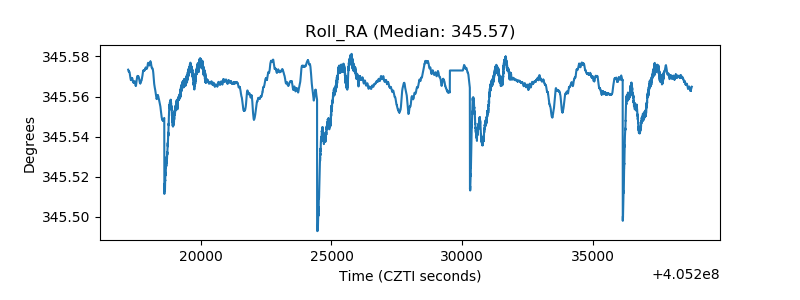 |
| Veto Counter | 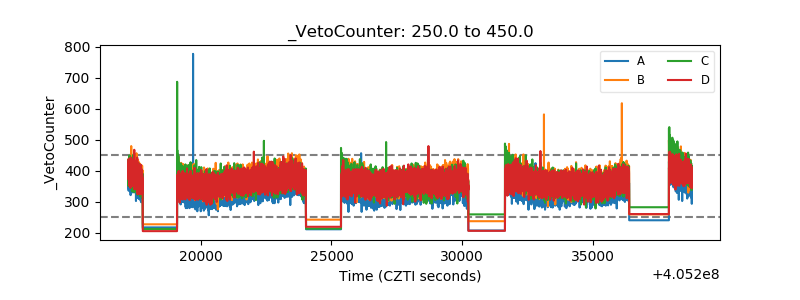 |